DISCUSSION PAPER SERIES - Employment Opportunities and High School Completion during the COVID-19 Recession - Institute of Labor Economics
←
→
Page content transcription
If your browser does not render page correctly, please read the page content below
DISCUSSION PAPER SERIES

IZA DP No. 13802

Employment Opportunities and High
School Completion during the COVID-19
Recession

Kunwon Ahn
Jun Yeong Lee
John V. Winters

OCTOBER 2020
DISCUSSION PAPER SERIES

IZA DP No. 13802

Employment Opportunities and High
School Completion during the COVID-19
Recession

Kunwon Ahn John V. Winters
Iowa State University Iowa State University, CARD, PSMME and
 IZA
Jun Yeong Lee
Iowa State University

OCTOBER 2020

Any opinions expressed in this paper are those of the author(s) and not those of IZA. Research published in this series may
include views on policy, but IZA takes no institutional policy positions. The IZA research network is committed to the IZA
Guiding Principles of Research Integrity.
The IZA Institute of Labor Economics is an independent economic research institute that conducts research in labor economics
and offers evidence-based policy advice on labor market issues. Supported by the Deutsche Post Foundation, IZA runs the
world’s largest network of economists, whose research aims to provide answers to the global labor market challenges of our
time. Our key objective is to build bridges between academic research, policymakers and society.
IZA Discussion Papers often represent preliminary work and are circulated to encourage discussion. Citation of such a paper
should account for its provisional character. A revised version may be available directly from the author.

 ISSN: 2365-9793

 IZA – Institute of Labor Economics
Schaumburg-Lippe-Straße 5–9 Phone: +49-228-3894-0
53113 Bonn, Germany Email: publications@iza.org www.iza.org
IZA DP No. 13802 OCTOBER 2020

 ABSTRACT
 Employment Opportunities and High
 School Completion during the COVID-19
 Recession*
 COVID-19 created major disruptions for young people including health concerns, school
 closures, reduced social opportunities, and a wilting economy. We examine the effect
 of COVID-19 on high school completion in the United States. We find that high school
 completion rates increased considerably in 2020 compared to previous years. We investigate
 various mechanisms and find that worse employment conditions were the driving force.
 The lower opportunity costs of schooling because of the pandemic recession encouraged
 more young people to complete high school. The pandemic created extensive problems in
 education, but fortunately it did not reduce overall high school completion rates.

 JEL Classification: I2, J2
 Keywords: COVID-19, recession, employment, education, human capital

 Corresponding author:
 John V. Winters
 Iowa State University
 Department of Economics
 460B Heady Hall
 518 Farm House Lane, Ames
 Iowa 50011-1054
 USA
 E-mail: winters1@iastate.edu

 * The authors received no funding related to this work and have no conflict of interest to declare. The primary
 data analyzed in this study are publicly available. The authors will share code and processed data with interested
 researchers.
1. Introduction

 The COVID-19 pandemic created devastating losses of heath, life, and economic

opportunities. The pandemic triggered a severe recession in 2020 with the highest

unemployment rate in the United States since at least 1948 (BLS 2020). Employment decreases

were especially severe for young people (Cho and Winters 2020). The country experienced

widespread closures of businesses, schools, and public spaces to reduce the spread of the virus.

School closures disrupted human capital development, and the consequences may last for

decades (Aucejo et al. 2020; Bacher-Hicks et al. 2020; Baron et al. 2020; Psacharopoulos et al.

2020). Many schools moved to online learning and other forms of distance education starting in

March 2020, but the effectiveness was hindered by limited experience with these modes of

delivery, lack of internet access for many students, and the inherent difficulty of virtual learning

for young people.1 COVID-19 caused many schools to end the school year early. The COVID-

19 disruption and school closures occurred at an especially critical time for students in their

senior year of high school. The senior year is the final year of secondary schooling and provides

formative experiences and stepping stones to next stages in life, including entry to college, the

workforce, or the military.

 In this paper we use individual level-data from the U.S. Current Population Survey (CPS)

to examine the effect of COVID-19 on high school completion rates. The difficulties during the

pandemic might have hindered high school completion. However, the overall effect is

theoretically ambiguous because COVID-19 affected both the marginal costs and marginal

benefits of additional schooling in competing ways. Specifically, the arduous transition to

1
 Earlier studies have examined differences in performance between online and face-to-face courses and found that
students taking a course online have significantly worse learning outcomes than those in face-to-face instruction (Xu
and Jaggars 2014; Alpert et al. 2016; Bettinger et al. 2017; Bacolod et al. 2018).

 1
distance education may have increased the marginal costs of schooling, but the worsened

employment opportunities during the recession likely lowered the opportunity cost of time in

schooling. The shift to online learning also likely lowered the benefits of additional schooling

for many young people.

 We find that high school completion rates increased in 2020 relative to previous years,

despite the more challenging learning environment. We then exploit local variation in high

school completion rates and examine mechanisms contributing to the increase in 2020. We find

that increased high school completion rates during COVID-19 are fully attributable to worse

local labor market conditions. The increase in high school completion was especially

pronounced in areas with large employment losses. We do not find high school completion to be

significantly affected by local COVID-19 infection rates nor state policy responses.

 Our paper contributes to two strands of literature. The first is the rapidly growing

literature examining the various economic impacts of COVID-19. This literature has

documented widespread losses in employment and well-being across a variety of regions,

countries, and groups (Adams-Prassl et al. 2020; Beland et al. 2020; Brodeur et al. 2020a; Chetty

et al. 2020; Cho et al. 2020; Coates et al. 2020; Crowley et al. 2020; Pouliakas and Branka

2020).2 Second, we also contribute to a longer literature examining educational decisions via the

human capital framework and specifically contribute to the literature connecting human capital

investment decisions to macroeconomic conditions (Betts and McFarland 1995; Clark 2011;

Atkin 2016; Adamopoulou and Tanzi 2017; Charles et al. 2018).3 Schooling decisions are

2
 A segment of the COVID-19 literature has also identified silver linings from the pandemic including reduced air
pollution due to reduced transportation and burning of fossil fuels (Brodeur et al. 2020b; Dang and Trinh 2020; He
et al. 2020).
3
 An additional education literature examines effects of single school closings (before COVID-19) with students
being displaced to other schools (Engberg et al. 2012; Brummet 2014; Beuchert et al. 2018; Larsson Taghizadeh
2020). The effects appear to depend on the quality of the closing and receiving schools, but there is also evidence of
disruption effects.

 2
typically found to be countercyclical, consistent with a worse economy lowering the opportunity

cost of schooling.4 The COVID-19 pandemic affected multiple factors in individual schooling

decisions, but our analysis suggests that worsened employment opportunities are the dominant

factor affecting changes in high school completion rates during the pandemic.

 Given the substantial difficulties students faced, there may be some relief that high school

completion rates did not go down and actually increased. However, our results do not imply that

no students were harmed. It is also important to recognize that the quality of education was

likely reduced. Furthermore, we can say very little about longer run effects on overall human

capital. Preliminary estimates indicate that college enrollment for Fall 2020 will be down

somewhat, due to students taking gap years and reluctance to pay big money for a less desirable

college experience during COVID-19 (National Student Clearinghouse 2020). Thus, our study

provides important results about high school completion during the COVID-19 pandemic that

should be viewed as part of a larger story that is still unfolding.

2. Theoretical Framework

 Our setting considers young people who have begun their senior year of high school and

must decide whether to complete this final year of secondary schooling ( ). Completing an

additional amount of schooling is a human capital investment that involves both marginal costs

and marginal benefits. The marginal costs include financial costs ( ), effort costs ( ) and the

opportunity cost of time ( ). The majority of high school students in the U.S. are in public

schools with minimal pecuniary costs, but students and their families still incur financial

expenditures for materials, supplies, and technological resources. Schooling requires effort that

4
 A segment of the literature has focused on energy shocks that specifically improved employment opportunities for
young and less-educated men (Black et al. 2005; Rickman et al. 2017; Cascio and Narayan 2020; Kovalenko 2020).

 3
is unpleasant to many students and discourages marginal investments in schooling. Perhaps most

importantly, schooling is time-consuming and reduces the amount of time that young people

could spend on other activities including recreation, social activities, and paid work. The

marginal benefits of additional schooling include the intrinsic pleasure from learning and

socializing with peers in a structured setting ( ) and the net present value of expected higher

future wage earnings ( ). The human capital model predicts that a young person will complete

additional schooling if the marginal benefits exceed the marginal costs, i.e.,

 1

 0

 The COVID-19 pandemic altered the marginal costs and marginal benefits of completing

the senior year of high school in important ways. The recession reduced contemporaneous

employment opportunities and therefore lowered the opportunity cost of individual time

investments in schooling. For students without previous internet access or a home computer,

movement to online instruction increased the financial costs of schooling. Effort costs were

affected in heterogeneous ways. School closures reduced access to complementary schooling

inputs and increased the effort costs of finishing high school for many young people, especially

those with limited skills and resources for managing their own academic progress remotely.

Furthermore, the stress, anxiety, and disruption created by the pandemic more generally may

have reduced student ability to focus on schooling and further increased the costs of effort.

However, many states, districts, and schools implemented policy changes that eased graduation

requirements and lowered the effort costs of finishing for some students. The net effect of the

pandemic on effort costs varied across schools and students.

 COVID-19 and the resulting school closures also reduced the benefits of additional

schooling for many young people. Students unfamiliar and uncomfortable with distance learning

 4
likely learned less in the remote environment, which hindered their human capital development

and ability to increase their future earning potential. The disruptions also made schooling less

pleasant for many and further lowered the benefits of finishing high school. COVID-19 took

away important milestone events for many high school seniors such as prom, college campus

visits, and walking across a high school graduation stage. The reduced social experiences and

formative events may have demoralized some students and discouraged them from completing

high school in 2020.

 Thus, the marginal costs and marginal benefits of finishing high school both changed

during the pandemic, and the net effect on high school completion rates is theoretically

ambiguous. The net effect depends on how the marginal benefits and marginal costs were

affected. If the marginal costs of additional schooling decreased by much more than the

marginal benefits decreased, then we would expect high school completion rates to increase. If

the marginal costs increased overall or decreased by less than the marginal benefits decreased,

then high school completion rates would decrease. Finally, if the benefits and costs changed in

roughly equal magnitude, high school completion rates would be largely unchanged.

3. Empirical Framework

 We use individual-level data from the U.S. Current Population Survey (CPS) to examine

changes in high school completion rates. The CPS collects labor, demographic, and other

information including the highest level of schooling individuals have completed. We use the

July CPS for years 2016-2020 and examine persons ages 18-19 at the time of the survey. We

focus on July because school years for U.S. students typically end in May or June and typically

begin in August or September. 2020 is the COVID-19 treatment year, and 2016-2019 are pre-

 5
treatment years used for comparison. Age 18 is the typical age at high school graduation in the

U.S., but some graduate later because they started school late or repeated a grade.5 We also limit

the sample to persons born in the U.S. to avoid potential influences of COVID-19 and other

recent factors on immigrant composition. Our analysis uses CPS survey weights.

 We first examine how high school completion rates changed in 2020 relative to previous

years. We then examine the extent to which changes in 2020 are attributable to individual

characteristics, local employment conditions, and state public policy responses to COVID-19.

Specifically, we estimate linear probability models of the following form:

 2020 θ (1)

 θ (2)

 is an indicator variable for individual in local area and year that equals one if the

individual has a completed a high school diploma or equivalent (e.g. GED). 2020 is an

indicator variable equal to one for year 2020 and zero otherwise. is a linear time trend

variable that accounts for pre-2020 trends. is a full set of indicator variables

capturing local area fixed effects. Local areas consist of individually identifiable metropolitan

areas and state-specific residual areas for non-metropolitan areas and unidentifiable metro areas.

82.3 percent of the sample lives in one of 260 individually identifiable metropolitan areas.

is a set of individual characteristic control variables including dummies for gender, race, and

ethnicity. is a set of time-varying state and local area characteristics discussed below. In

equation (2), is a set of year indicator variables for each year excluding 2019.6

5
 Some also graduate at age 17 or earlier, but the percentage is relatively small. For our sample, 71.9 percent of
persons age 18 and 90.1 percent of those age 19 have completed high school. For age 17, only 15.7 percent had
completed high school.
6
 This includes 2020 . The variable is not included in equation (2) because it would be collinear with
the full set of year dummies and the regression constant term.

 6
Equation (2) examines differences for each year relative to 2019. We estimate separate

regressions for ages 18 and 19. We cluster standard errors by state.

 We measure local area employment changes from the previous year using data from the

BLS Local Area Unemployment Statistics. Specifically, we compute total employment in each

local area in May for 2015-2020.7 We then compute the percentage change from the previous

year for each year and local area, and include this as our time-varying measure of local

employment conditions. This variable is preferable to the local unemployment rate because the

pandemic reduced labor force participation causing the unemployment rate to understate

employment losses (BLS 2020; Cho and Winters 2020). A stronger economy is expected to raise

opportunity costs of time and reduce individual investments in schooling, so we expect the

variable to have a negative coefficient for high school completion.

 We collected data from various sources on state education policy responses to COVID-19

and construct two indicator variables.8 The first is for whether the state had and eliminated exit

exams that students must pass for graduation.9 The second is an indicator equal to one if the

state implemented a policy allowing seniors to satisfy graduation requirements if they were

7
 This includes paid employment for persons of all ages. Unfortunately, there is no reliable employment measure for
local areas that just includes young people. CPS sample sizes are too small to construct such a measure with
sufficient precision to use as an explanatory variable; the small samples and consequent measurement error would
induce attenuation bias in regression analysis. In results not shown, we did look at national variation in CPS
employment rates for ages 18-19 and found significant decreases in 2020 consistent with expectations and findings
in previous literature for broader age ranges.
8
 Education Week (https://www.edweek.org/ew/section/multimedia/data-how-is-coronavirus-changing-states-
graduation-requirements.html) provides compiled data of changes in graduation requirements for each state through
late April. We confirmed most of the states by finding official announcements from each state department of
education as much as possible. We also searched the "Education commission of the states" website
(https://www.ecs.org/state-education-policy-watch-list/) to look at the education policy responses of each state
through bill enactment status. Further, we looked at local news as well as some of the local school district web sites.
9
 16 states with exit exams scheduled for 2020 completely eliminated the requirements, but two (Idaho and New
Mexico) did not. Most states had no exit exam requirement. The indicator equals one only for those that had and
cancelled exit exams. The 16 states that eliminated exit exams are Arizona, Arkansas, Florida, Kentucky, Louisiana,
Maryland, Massachusetts, Mississippi, Missouri, Nevada, New York, North Dakota, Ohio, Texas, Utah, and
Virginia.

 7
passing before school closure without having to complete additional schooling remotely.10 Both

of these indicators equal zero for all states before 2020; they equal one in 2020 if the state

implemented the policy change in response to COVID-19 and zero if not. These education

policy indicators measure relaxing of requirements and lower effort costs of schooling, so we

expect them to have positive effects on high school completion. There was also variation in

COVID-19 related policies and practices among local schools and teachers. Unfortunately, the

idiosyncratic nature prevents us from measuring sub-state variation in education policy changes.

 We use data from USAFacts (2020) to measure the percentage of the local area

population that had tested positive for COVID-19 through May 31, 2020. A higher local

COVID-19 infection rate is likely to reduce local recreational opportunities and opportunity costs

of time spent on schooling but increase anxiety and effort costs of schooling, so the net expected

effect on schooling is ambiguous. We also include a variable for the number of days (divided by

100) a state shelter in place policy was in effect through May 31, 2020; the measure comes from

the Institute for Health Metrics and Evaluation (IHME 2020). The shelter in place variable has

ambiguous expected effects on schooling similar to the infection rate variable. Finally, we

include an indicator equal to one in 2020 if the state had a Republican governor in 2020; it equals

zero for previous years and for states without a Republican governor. State policy responses

differed between Democratic and Republican governors, with the latter allowing more economic

activity to remain open. Young people in states with Republican governors may also have

expected a shorter duration of the pandemic. The expected effect of having a Republican

governor in 2020 on high school graduation is also ambiguous. Given the uncertain expectations

10
 The 13 states with these statewide policy changes are Alabama, Arkansas, Florida, Illinois, Indiana,
Massachusetts, New York, North Carolina, Oregon, Tennessee, Virginia, Washington, and West Virginia.

 8
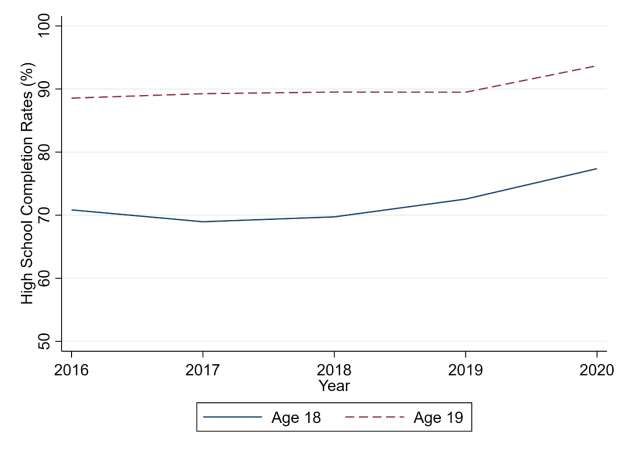
and potential collinearity between some of these variables, we also estimate robustness checks

that include subsets of these variables with results in the appendix.

 Table 1 presents sub-sample means and time differences for selected variables. The first

three columns are for age 18 and the last three columns are for age 19. Columns (1) and (4)

report means for years 2016-2019, and Columns (2) and (5) report means for year 2020.

Columns (3) and (6) present differences in means between the two periods. The share of high

school graduates for age 18 increased from 0.705 in 2016-2019 to 0.774 in 2020, i.e., the high

school graduation rate increased by 6.9 percentage points during 2020 relative to previous years.

This is a large increase and indicates that the COVID-19 pandemic and resulting disruptions

increased high school completion rates overall. For age 19, the share of high school graduates

increased from 0.892 in 2016-2019 to 0.937 in 2020. Some young people graduate high school

at age 19 instead of 18, so the overall percentages are higher for the older group. The 4.5

percentage point increase for age 19 is somewhat smaller than for age 18, but it is still quite

large. Figure 1 shows the annual variation in high school completion rates and reiterates the

large increase in 2020 relative to previous years.

 Table 1 also shows that individual characteristics are similar across the sub-samples, but

there are some differences over time warranting regression analysis with individual control

variables. The local employment change decreased significantly in 2020. It is measured in

percentage points, and the mean went from 0.012 in 2016-2019 to -0.12 in 2020 indicating that

the year-over-year employment change in May 2020 was more than 13 percentage points lower

in 2020 than in previous years. However, there was also considerable variation in 2020

employment conditions across local areas as documented in previous literature (Chetty et al.

2020; Cho et al. 2020; Forsythe et al. 2020). The standard deviation for the local employment

 9
change variable was 0.051 in year 2020 for both ages (not reported in the table). Cho et al.

(2020) document that early employment losses were especially severe in large metropolitan areas

because of greater population density and virus exposure. Local industrial structure also

mattered as local areas with employment concentrated in the leisure and hospitality sector were

especially hard hit. The other explanatory variables in Table 1 equal zero in 2016-2019 by

construction but have non-zero means in 2020.

4. Regression Results

 Table 2 reports regression results for variants of equation (1). The first three columns are

for age 18 and the last three are for age 19. Columns (1) and (4) include no time-varying state

and local area characteristic variables. Columns (2) and (5) add the local employment change

variable. Columns (3) and (6) present the full specification.

 Column (1) reports that the high school completion rate for age 18 increased by 5.7

percentage points in 2020 relative to previous years controlling for individual characteristics and

a linear time trend. The year trend variable is not statistically significant, but its inclusion does

moderately reduce the Column (1) Year 2020 Dummy coefficient estimate; see Appendix Table

A1 for equation (1) results without the year trend variable. In Column (2) the local employment

change variable is significantly negative as expected, and the Year 2020 Dummy coefficient

decreases and is not statistically significant. In Column (3), the local employment change

variable is again negative and statistically significant, but the other time-varying state and local

variables are not statistically significant individually nor jointly. Columns (4) through (6) follow

a similar pattern as (1) through (3). Column (4) indicates a significant increase in high school

 10
completion in 2020, but this goes away in Column (5) when controlling for local employment

change and none of the other time-varying state and local variables are significant in Column (6).

 The results in Table 2 indicate that high school completion rates significantly increased

overall in 2020, and the driving factor was the worsened labor market conditions. Multiplying

the local employment change coefficients in Table 2 by the corresponding changes in sub-sample

means over time in Table 1 implies that the worse labor market increased high school completion

by 6.8 to 6.9 percentage points for age 18 and by 4.2 to 4.3 percentage points for age 19; these

magnitudes are nearly identical to the overall changes in high school completion reported in

Table 1. That is, the worse employment conditions appear to fully explain the 2020 increase in

high school completion rates.11

 A few caveats are worth noting. First, we are measuring overall effects on high school

completion rates, but there may have been unobservable heterogeneous effects with some

students pushed into high school completion and others pushed out of high school completion.

We are capturing the overall effect, and an overall positive effect does not preclude negative

effects for some individuals. For example, the worse economy reduced employment

opportunities and encouraged high school completion for many young people, but it also reduced

household income for many young people whose parents lost jobs and could have disrupted their

schooling. Some young people may have even quit school and entered the labor force due to

parental job loss during the pandemic. We are unable to provide evidence on such

heterogeneous effects, but they are a possible consideration for future research. Second, high

school completion is an important outcome but only one component of educational attainment.

11
 In results not shown, we also conducted an Oaxaca-Blinder decomposition of the changes between 2016-2019 and
2020 and again found that the local employment change variable was the driving factor. Specifically, the
decomposition suggests that the local employment change variable explains a 6.6 percentage point decline for age
18 and a 4.5 percentage point decline for age 19.

 11
If students have been disrupted in their education due to school closures and distance learning, it

may harm their overall human capital development and future labor market outcomes.

 Table 3 presents results for variants of equation (2) which includes dummies for each

year excluding 2019 as the base year. The six columns are structured similarly to Table 2. The

results in Table 3 are very similar to Table 2. The local employment change coefficient

modestly decreases in magnitude in Columns (2) and (3) and modestly increases magnitude in

Columns (5) and (6). Multiplying the local employment changes coefficients by the change in

sample mean implies that the worse labor market due to COVID-19 increased high school

completion by 6.6 to 6.7 percentage points for age 18 and by 4.3 percentage points for age 19.

The other state and local characteristics are neither individually nor jointly significant. Appendix

Tables A2 and A3 examine the robustness to alternative specifications of time-varying state and

local characteristics. Results for the local employment change variable are very similar to Table

2.

5. Conclusion

 COVID-19 disrupted lives and livelihoods around the world. The U.S. experienced

record unemployment in April 2020. COVID-19 severely impacted education via school

closures, online learning, and major uncertainties for how to proceed. Many young people

struggled educationally, economically, socially, and emotionally. There was some concern that

COVID-19 may have reduced student performance and lowered graduation rates for high school

seniors. We present a human capital framework relating schooling decisions to marginal costs

and marginal benefits. We examine changes in high school completion rates in 2020 relative to

previous years. High school completion rates increased by 6.9 percentage points for persons age

18 and by 4.5 percentage points for persons age 19. We investigate the importance of

 12
contributing factors and find that worse local employment conditions are the driving force. As

the economy worsened, the opportunity cost of schooling decreased. The lower marginal cost of

schooling encouraged more young people to complete high school.

 Our analysis is valuable for researchers, policymakers, and educators. For researchers,

our findings provide reaffirming empirical support for the human capital framework as a model

for understanding individual education decisions, especially high school completion. A weak

economy reduces employment opportunities for young people and they respond by increasing

their investment in schooling. For policymakers and educators, it is noteworthy that the overall

effects of COVID-19 and efforts to combat it did not reduce high school completion rates.

Students certainly struggled in many ways, but it is important to understand that high school

completion rates were not overall adversely impacted in 2020 despite school closures, online

learning, and other challenges. By increasing overall high school completion rates, many high

school seniors achieved something positive in an otherwise negative environment. Of course,

the pandemic-related disruptions were deleterious for many young people and their human

capital development. Some impacts of the pandemic will last well into the future, so it is

important that the education community keeps working to support students and provide the best

education possible given the circumstances.

 13
References

Adamopoulou, E. and Tanzi, G.M., 2017. Academic drop-out and the Great Recession. Journal

 of Human Capital, 11(1), 35-71.

Adams-Prassl, A., Boneva, T., Golin, M. and Rauh, C., 2020. Inequality in the impact of the

 coronavirus shock: Evidence from real time surveys. Journal of Public Economics, 189,

 Article 104245.

Alpert, W.T., Couch, K.A. and Harmon, O.R., 2016. A randomized assessment of online

 learning. American Economic Review, 106(5), 378-82.

Atkin, D., 2016. Endogenous skill acquisition and export manufacturing in Mexico. American

 Economic Review, 106(8), 2046-85.

Aucejo, E.M., French, J., Araya, M.P.U. and Zafar, B., 2020. The impact of COVID-19 on

 student experiences and expectations: Evidence from a survey. Journal of Public

 Economics, Forthcoming, Article 104271.

Bacher-Hicks, A., Goodman, J. and Mulhern, C., 2020. Inequality in household adaptation to

 schooling shocks: Covid-induced online learning engagement in real time. NBER

 Working Paper No. 27555.

Bacolod, M., Mehay, S. and Pema, E., 2018. Who succeeds in distance learning? Evidence from

 quantile panel data estimation. Southern Economic Journal, 84(4), 1129-1145.

Baron, E.J., Goldstein, E.G. and Wallace, C.T., 2020. Suffering in silence: How COVID-19

 school closures inhibit the reporting of child maltreatment. Journal of Public Economics,

 190, Article 104258.

Beland, L.P., Fakorede, O. and Mikola, D., 2020. Short-term effect of COVID-19 on self-

 employed workers in Canada. Canadian Public Policy, 46(S1), S66-S81.

 14
Bettinger, E.P., Fox, L., Loeb, S. and Taylor, E.S., 2017. Virtual classrooms: How online college

 courses affect student success. American Economic Review, 107(9), 2855-75.

Beuchert, L., Humlum, M.K., Nielsen, H.S. and Smith, N., 2018. The short-term effects of

 school consolidation on student achievement: Evidence of disruption? Economics of

 Education Review, 65, 31-47.

Betts, J.R. and McFarland, L.L., 1995. Safe port in a storm: The impact of labor market

 conditions on community college enrollments. Journal of Human Resources, 30(4), 741-

 765.

Black, D.A., McKinnish, T.G. and Sanders, S.G., 2005. Tight labor markets and the demand for

 education: Evidence from the coal boom and bust. ILR Review, 59(1), 3-16.

Brodeur, A., Gray, D.M., Islam, A. and Bhuiyan, S., 2020a. A literature review of the economics

 of COVID-19. IZA Discussion Paper No. 13411.

Brodeur, A., Cook, N. and Wright, T., 2020b. On the effects of COVID-19 Safer-At-Home

 policies on social distancing, car crashes and pollution. IZA Discussion Paper No. 13255.

Brummet, Q., 2014. The effect of school closings on student achievement. Journal of Public

 Economics, 119, 108-124.

Bureau of Labor Statistics, 2020. The Employment Situation April 2020. US Department of

 Labor News Release, https://www.bls.gov/news.release/archives/empsit_05082020.pdf,

 Accessed May 8, 2020.

Cascio, E.U. and Narayan, A., 2020. Who needs a fracking education? The educational response

 to low-skill biased technological change. ILR Review, Forthcoming.

Charles, K.K., Hurst, E. and Notowidigdo, M.J., 2018. Housing booms and busts, labor market

 opportunities, and college attendance. American Economic Review, 108(10), 2947-94.

 15
Chetty, R., Friedman, J.N., Hendren, N. and Stepner, M., 2020. How did COVID-19 and

 stabilization policies affect spending and employment? A new real-time economic tracker

 based on private sector data. NBER Working Paper No. 27431.

Cho, S.J. and Winters, J.V., 2020. The distributional impacts of early employment losses from

 COVID-19. Iowa State University Economics Working Paper No. 20011,

 https://lib.dr.iastate.edu/econ_workingpapers/106/

Cho, S.J., Lee, J.Y. and Winters, J.V., 2020. Employment impacts of the covid-19 pandemic

 across metropolitan status and size. Iowa State University Economics Working Paper No.

 20015, https://lib.dr.iastate.edu/econ_workingpapers/110/

Clark, D., 2011. Do recessions keep students in school? The impact of youth unemployment on

 en olmen in o com lo ed ca ion in England. Economica, 78(311), 523-545.

Coates, B., Cowgill, M., Chen, T. and Mackey, W., 2020. Shutdown: Estimating the COVID-19

 employment shock. Grattan Institute Working Paper No. 2020-03

Crowley, F., Doran, J. and Ryan, G., 2020. The impact of Covid-19 restrictions on workers: Who

 is most exposed? SRERC Working Paper Series No. SRERCWP2020-3.

Dang, H.A. and Trinh, T.A., 2020. Does the COVID-19 pandemic improve global air quality?

 New cross-national evidence on its unintended consequences. IZA Discussion Paper No.

 13480.

Engberg, J., Gill, B., Zamarro, G. and Zimmer, R., 2012. Closing schools in a shrinking district:

 Do student outcomes depend on which schools are closed? Journal of Urban Economics,

 71(2), 189-203.

 16
Flood, S., King, M., Rodgers, R., Ruggles, S., and Warren, J.R., 2020. Integrated Public Use

 Microdata Series, Current Population Survey: Version 7.0 [dataset]. Minneapolis, MN:

 IPUMS. https://doi.org/10.18128/D030.V7.0

Forsythe, E., Kahn, L.B., Lange, F. and Wiczer, D., 2020. Labor demand in the time of COVID-

 19: Evidence from vacancy postings and UI claims. Journal of Public Economics, 189,

 Article 104238.

He, G., Pan, Y. and Tanaka, T., 2020. The short-term impacts of COVID-19 lockdown on urban

 air pollution in China. Nature Sustainability, Forthcoming.

Institute for Health Metrics and Evaluation (IHME), 2020. COVID-19 Mortality, Infection,

 Testing, Hospital Resource Use, and Social Distancing Projections [dataset]. Seattle,

 United States of America: Institute for Health Metrics and Evaluation (IHME),

 University of Washington.

Kovalenko, A., 2020. Natural resource booms, human capital, and earnings: Evidence from

 linked education and employment records. University of Texas Working Paper.

Larsson Taghizadeh, J., 2020. Effects of school closures on displaced students and future cohorts

 in Sweden 2000-2016. Labour Economics, Forthcoming.

National Student Clearinghouse. 2020. Stay Informed with the Latest Enrollment Information,

 September 24, 2020. https://nscresearchcenter.org/stay-informed/

Pouliakas, K. and Branka, J., 2020. EU jobs at highest risk of COVID-19 social distancing: Will

 the pandemic exacerbate labour market divide? IZA Discussion Paper No. 13281.

Psacharopoulos, G., Collis, V., Patrinos, H.A. and Vegas, E., 2020. Lost wages: The COVID-19

 cost of school closures. World Bank Policy Research Working Paper No. 9246.

 17
Rickman, D.S., Wang, H. and Winters, J.V., 2017. Is shale development drilling holes in the

 human capital pipeline? Energy Economics, 62, 283-290.

USAFacts, 2020. Coronavirus Locations: COVID-19 Map by County and State [dataset].

 https://usafacts.org/visualizations/coronavirus-covid-19-spread-map/, Accessed June 10,

 2020.

Xu, D. and Jaggars, S.S., 2014. Performance gaps between online and face-to-face courses:

 Differences across types of students and academic subject areas. Journal of Higher

 Education, 85(5), 633-659.

 18
Figure 1: High School Completion Rates, 2016-2020

So ce: a ho e ima e using the U.S. Current Population Survey for July.

 19
Table 1: Sub-Sample Means and Time Differences for Selected Variables
 (1) (2) (3) (4) (5) (6)
 Age 18 Age 18 Age 18 Age 19 Age 19 Age 19
 2016-19 2020 Difference 2016-19 2020 Difference
High School Graduate 0.705 0.774 0.069*** 0.892 0.937 0.045***
Female 0.492 0.484 -0.007 0.498 0.500 0.002
Black 0.133 0.145 0.011 0.151 0.123 -0.028**
Native American 0.009 0.012 0.002 0.010 0.010 0.000
Asian 0.035 0.039 0.003 0.035 0.041 0.006
Pacific Islander 0.005 0.003 -0.002 0.003 0.004 0.001
Multi-racial 0.037 0.024 -0.013** 0.030 0.037 0.008
Hispanic 0.211 0.221 0.010 0.199 0.211 0.011
Local Employment Change 0.012 -0.120 -0.132*** 0.012 -0.122 -0.134***
Dropped Exit Exams * Y2020 0 0.416 0.416*** 0 0.438 0.438***
Passing Graduates * Y2020 0 0.357 0.357*** 0 0.319 0.319***
Local COVID Infection Rate 0 0.521 0.521*** 0 0.539 0.539***
Shelter in Place Days (/100) 0 0.475 0.475*** 0 0.463 0.463***
Republican Governor * Y2020 0 0.453 0.453*** 0 0.481 0.481***
Notes: The full sample includes persons in the 2016-2020 July CPS ages 18-19 and born in the U.S.
*Significant at the ten percent level; **Significant at five percent level; ***Significant at one percent
level.

 20
Table 2: High School Completion Regression Results
 (1) (2) (3) (4) (5) (6)
 Age 18 Age 18 Age 18 Age 19 Age 19 Age 19
 Year 2020 Dummy 0.057** -0.010 0.002 0.033** -0.009 -0.047*
 (0.023) (0.042) (0.063) (0.014) (0.024) (0.027)
 Year Trend 0.005 0.004 0.004 0.003 0.002 0.003
 (0.008) (0.007) (0.007) (0.004) (0.004) (0.004)
 Local Employment Change -0.518** -0.521** -0.318** -0.315**
 (0.196) (0.230) (0.143) (0.148)
 Dropped Exit Exams * Y2020 -0.026 0.021
 (0.042) (0.020)
 Passing Graduates * Y2020 -0.030 -0.019
 (0.030) (0.019)
 Local COVID Infection Rate 0.015 0.003
 (0.025) (0.012)
 Shelter in Place Days (/100) -0.011 0.048
 (0.069) (0.039)
 Republican Governor * Y2020 0.012 0.024
 (0.045) (0.019)
 Individual Controls Yes Yes Yes Yes Yes Yes
 Local Area Fixed Effects Yes Yes Yes Yes Yes Yes
 Observations 6,790 6,790 6,790 6,074 6,074 6,074
Notes: Standard errors in parentheses are clustered by state. Individual controls include dummy variables
for sex, race, and ethnicity. Local areas include identifiable metropolitan areas and state-specific residuals
for non-metropolitan areas and unidentifiable metropolitan areas. *Significantly different from zero at the
ten percent level; **Significant at five percent level; ***Significant at one percent level.

 21
Table 3: High School Completion Regression Results with Individual Year Dummies
 (1) (2) (3) (4) (5) (6)
 Age 18 Age 18 Age 18 Age 19 Age 19 Age 19
 Year 2020 Dummy 0.053*** -0.012 0.001 0.037*** -0.005 -0.044
 (0.019) (0.038) (0.060) (0.012) (0.023) (0.027)
 Year 2018 Dummy -0.023 -0.020 -0.020 -0.001 0.001 0.001
 (0.021) (0.021) (0.021) (0.013) (0.014) (0.014)
 Year 2017 Dummy -0.027 -0.024 -0.024 -0.005 -0.002 -0.003
 (0.016) (0.016) (0.016) (0.013) (0.013) (0.013)
 Year 2016 Dummy -0.015 -0.012 -0.012 -0.009 -0.007 -0.008
 (0.022) (0.021) (0.021) (0.014) (0.014) (0.014)
 Local Employment Change -0.502** -0.505** -0.322** -0.320**
 (0.198) (0.229) (0.149) (0.153)
 Dropped Exit Exams * Y2020 -0.026 0.021
 (0.042) (0.020)
 Passing Graduates * Y2020 -0.030 -0.019
 (0.030) (0.019)
 Local COVID Infection Rate 0.015 0.003
 (0.025) (0.012)
 Shelter in Place Days (/100) -0.011 0.048
 (0.069) (0.039)
 Republican Governor * Y2020 0.011 0.024
 (0.044) (0.019)
 Individual Controls Yes Yes Yes Yes Yes Yes
 Local Area Fixed Effects Yes Yes Yes Yes Yes Yes
 Observations 6,790 6,790 6,790 6,074 6,074 6,074
Notes: Standard errors in parentheses are clustered by state. 2019 is the omitted year. Individual controls
include dummy variables for sex, race, and ethnicity. Local areas include identifiable metropolitan areas
and state-specific residuals for non-metropolitan areas and unidentifiable metropolitan areas.
*Significantly different from zero at the ten percent level; **Significant at five percent level;
***Significant at one percent level.

 22
Appendix Tables

Table A1: High School Completion Regression Results without Year Trend Variable
 (1) (2) (3) (4) (5) (6)
 Age 18 Age 18 Age 18 Age 19 Age 19 Age 19
Year 2020 Dummy 0.069*** -0.002 0.011 0.040*** -0.004 -0.042
 (0.016) (0.038) (0.059) (0.009) (0.024) (0.026)
Local Employment Change -0.532*** -0.537** -0.327** -0.325**
 (0.197) (0.233) (0.140) (0.145)
Dropped Exit Exams * Y2020 -0.026 0.021
 (0.042) (0.020)
Passing Graduates * Y2020 -0.030 -0.019
 (0.030) (0.019)
Local COVID Infection Rate 0.014 0.003
 (0.025) (0.012)
Shelter in Place Days (/100) -0.012 0.047
 (0.069) (0.039)
Republican Governor * Y2020 0.011 0.024
 (0.044) (0.019)
Individual Controls Yes Yes Yes Yes Yes Yes
Local Area Fixed Effects Yes Yes Yes Yes Yes Yes
Observations 6,790 6,790 6,790 6,074 6,074 6,074
Notes: Standard errors in parentheses are clustered by state. Individual controls include dummy variables for sex,
race, and ethnicity. Local areas include identifiable metropolitan areas and state-specific residuals for non-
metropolitan areas and unidentifiable metropolitan areas. *Significantly different from zero at the ten percent
level; **Significant at five percent level; ***Significant at one percent level.

 23
Table A2: Alternative Specifications of State and Local Characteristics Results for Age 18
 (1) (2) (3) (4) (5) (6) (7)
 Age 18 Age 18 Age 18 Age 18 Age 18 Age 18 Age 18
 Year 2020 Dummy -0.002 0.000 0.007 0.004 0.013 -0.003 0.004
 (0.039) (0.039) (0.039) (0.038) (0.047) (0.047) (0.063)
 Year Trend 0.004 0.004 0.004 0.004 0.004 0.004 0.004
 (0.007) (0.007) (0.007) (0.007) (0.007) (0.007) (0.007)
 Local Employment Change -0.518** -0.520*** -0.520*** -0.500** -0.516** -0.517** -0.492**
 (0.199) (0.189) (0.194) (0.206) (0.222) (0.228) (0.225)
 Dropped Exit Exams * Y2020 -0.021 -0.018 -0.019 -0.022 -0.026 -0.029
 (0.031) (0.030) (0.029) (0.035) (0.041) (0.042)
 Passing Graduates * Y2020 -0.030 -0.028 -0.031 -0.030 -0.031 -0.031
 (0.033) (0.031) (0.032) (0.030) (0.031) (0.029)
 Local COVID Infection Rate 0.012 0.013 0.015
 (0.024) (0.025) (0.025)
 Shelter in Place Days (/100) -0.023 -0.012
 (0.067) (0.068)
 Republican Governor * Y2020 0.014 0.017
 (0.042) (0.045)
 Local COVID Death Rate 0.328
 (0.298)
 Individual Controls Yes Yes Yes Yes Yes Yes Yes
 Local Area Fixed Effects Yes Yes Yes Yes Yes Yes Yes
 Observations 6,790 6,790 6,790 6,790 6,790 6,790 6,790
Notes: Standard errors in parentheses are clustered by state. Individual controls include dummy variables for sex,
race, and ethnicity. Local areas include identifiable metropolitan areas and state-specific residuals for non-
metropolitan areas and unidentifiable metropolitan areas. *Significantly different from zero at the ten percent level;
**Significant at five percent level; ***Significant at one percent level.

 24
Table A3: Alternative Specifications of State and Local Characteristics Results for Age 19
 (1) (2) (3) (4) (5) (6) (7)
 Age 19 Age 19 Age 19 Age 19 Age 19 Age 19 Age 19
 Year 2020 Dummy -0.021 -0.004 -0.016 -0.016 -0.026 -0.023 -0.048*
 (0.024) (0.026) (0.025) (0.025) (0.027) (0.025) (0.028)
 Year Trend 0.002 0.003 0.003 0.003 0.003 0.003 0.003
 (0.004) (0.004) (0.004) (0.004) (0.004) (0.004) (0.004)
 Local Employment Change -0.328** -0.316** -0.327** -0.327** -0.307** -0.339** -0.299**
 (0.146) (0.140) (0.140) (0.147) (0.152) (0.149) (0.149)
 Dropped Exit Exams * Y2020 0.025 0.026 0.026 0.029 0.020 0.020
 (0.018) (0.019) (0.019) (0.020) (0.020) (0.020)
 Passing Graduates * Y2020 -0.015 -0.017 -0.017 -0.019 -0.016 -0.020
 (0.019) (0.018) (0.019) (0.019) (0.019) (0.019)
 Local COVID Infection Rate 0.000 -0.001 0.003
 (0.013) (0.013) (0.012)
 Shelter in Place Days (/100) 0.026 0.047
 (0.038) (0.038)
 Republican Governor * Y2020 0.013 0.027
 (0.017) (0.019)
 Local COVID Death Rate 0.122
 (0.124)
 Individual Controls Yes Yes Yes Yes Yes Yes Yes
 Local Area Fixed Effects Yes Yes Yes Yes Yes Yes Yes
 Observations 6,074 6,074 6,074 6,074 6,074 6,074 6,074
Notes: Standard errors in parentheses are clustered by state. Individual controls include dummy variables for sex,
race, and ethnicity. Local areas include identifiable metropolitan areas and state-specific residuals for non-
metropolitan areas and unidentifiable metropolitan areas. *Significantly different from zero at the ten percent level;
**Significant at five percent level; ***Significant at one percent level.

 25
You can also read