DIGITAL RESOURCE PRODUCTIVITY - ECOMAGINATION, THE INDUSTRIAL INTERNET, AND THE GLOBAL RESOURCE CHALLENGE
←
→
Page content transcription
If your browser does not render page correctly, please read the page content below
DIGITAL
  RESOURCE
PRODUCTIVITY
      ECOMAGINATION,
 THE INDUSTRIAL INTERNET,
      AND THE GLOBAL
   RESOURCE CHALLENGE

                            By Brandon Owens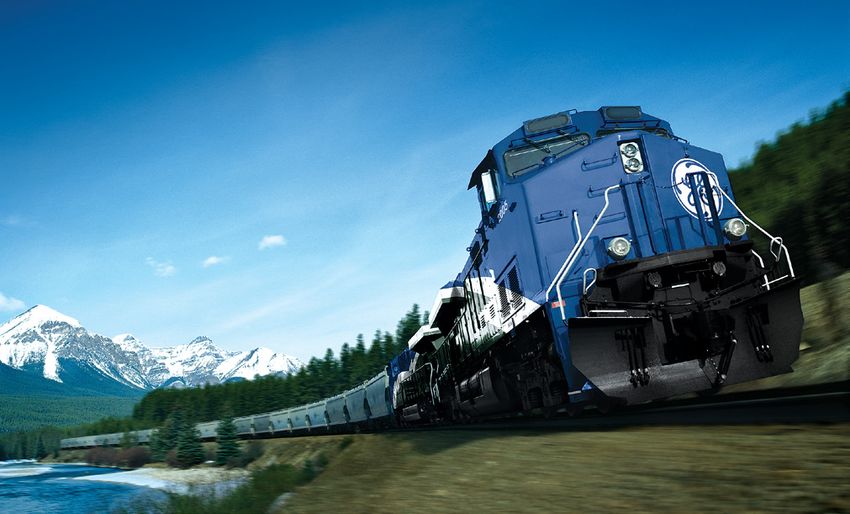
DIGITAL RESOURCE PRODUCTIVITY

AUTHOR BIOGRAPHY

Brandon Owens, Strategy & Analytics Director,
Ecomagination

Brandon Owens is an economist , energy analyst ,
researcher, and writer. His research has been pub-
lished in industry-leading journals such as INFORMS,
Public Utilities Fortnightly, Energy Policy, and Research
Evaluation. A keynote speaker and expert witness,
Mr. Owens has been cited in periodicals such as
the New York Times and USA Today.

The author of GE’s 2014 whitepaper “The Rise of
Distributed Power,” Mr. Owens is currently the
director of ecomagination Strategy & Analytics
at GE, where he helps guide the strategic direction
of GE’s flagship corporate sustainability program.
Prior to this role, he was the Manager of Strategy
& Analytics within GE Energy’s Global Strategy &
Planning group.

Prior to joining GE in 2007, Mr. Owens was Director of
Research at Cambridge Energy Research Associates
(IHS CERA). Earlier, he served as Senior Analyst
for the National Renewable Energy Laboratory
(NREL). Mr. Owens holds an MS in Mineral Economics
from the Colorado School of Mines and a BA in
Mathematics and Economics from the University
of Colorado at Boulder.

DIGITAL RESOURCE PRODUCTIVITY

CONTENTS

Executive Summary                           4

I. Introduction                             9

II. The Global Natural Resource Challenge   10
Natural Resources and Economic Growth       12
The Vice Is Tightening                      12
The Resource Productivity Imperative        15

III. When Hardware Meets Software           19
Ecomagination                               19
The Industrial Internet                     20

IV. Powering the Future                     27
Lighting                                    27
Aviation                                    29
Power                                       29
Rail                                        30
Water                                       30
Wind                                        31
Oil and Gas                                 33
Beyond the Power of 1%                      33

V. Conclusion                               35

                                            3
EXECUTIVE SUMMARY
EXECUTIVE SUMMARY
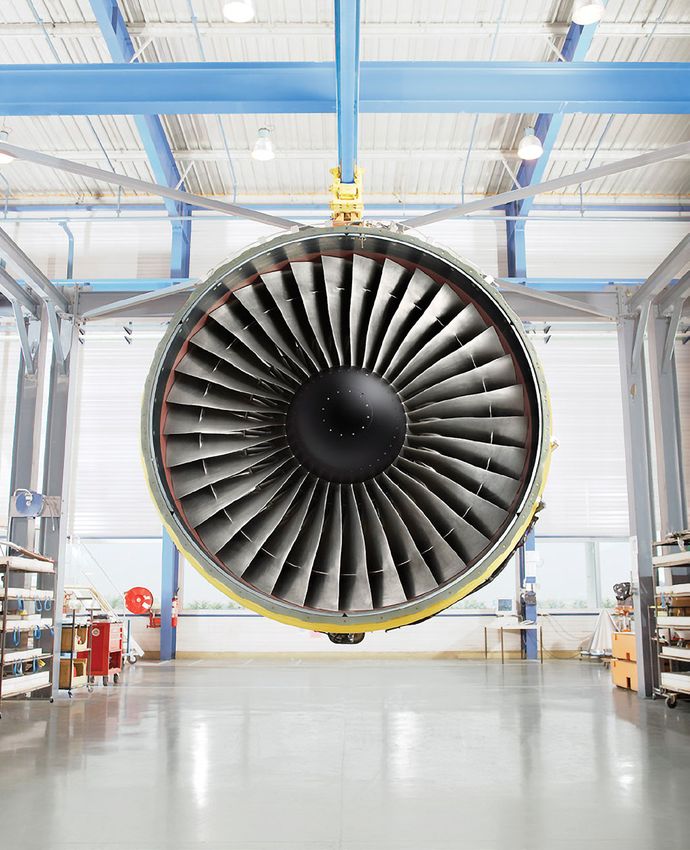
Ecomagination (www.ge.com/about-us/ecomagination) for select wide-body aircraft . GEnx engines use
is GE’s commitment to developing technologies that advanced GE propulsion technology to reduce fuel
reduce our consumption of natural resources, while cre- consumption, associated carbon dioxide (CO2) and
ating economic benefit for our customers. Established oxides of nitrogen (NOx) emissions, noise, and oper-
in 2005, GE’s ecomagination program has been at the ating cost , compared to the engines they replace.
forefront of resource productivity solutions for a dec- In comparison with the previous model (GE’s CF6
ade. Since its founding, the GE technologies and solu- engine), the GEnx engine reduces fuel consump-
tions in the ecomagination portfolio have generated tion by more than 10 percent , which translates to
$180 billion in revenue. GE has maintained its commit- a double-digit reduction in CO2.
ment to efficient resource solutions by investing $15
billion in research and development over this period. As we enter the second decade of GE’s ecomagination
strategy, the need for resource efficiency and envi-
Ecomagination technologies are at the cutting edge ronmentally sustainable solutions around the world
of resource productivity. For example, consider GE’s has never been stronger. The fact is, a great global
GEnx aircraft engines, GE’s turbofan engine family resource challenge is upon us. The demand for natural
© 2014 General Electric Company. All rights reserved.
This material may not be copied or distributed in whole or in part 4
without prior permission of the copyright owner.EXECUTIVE SUMMARY
resources is outstripping available supplies in many enables more efficient management and use of
regions around the world. Regional resource imbal- human, capital, and natural resources within indus-
ances are occurring for energy, water, food, and trial machines, fleets, facilities, and networks. The
materials. These imbalances are driving up com- Industrial Internet enables resources to be opti-
modity prices and creating resource stresses that mized across the entire industrial system.
have social, political, and economic implications.
The integration of efficient
A global resource challenge hardware with Internet-
is upon us. In the absence enabled software is the
of resource productivity new frontier in natural
improvements, both materials resource productivity. We
extraction and energy con- call this Digital Resource
sumption will increase by Productivity.
80 percent by 2030.
The combination of ecomagination solutions with
The global resource challenge is poised to become the Industrial Internet has the potential to play
even greater in the years ahead. Expected increases a key role in solving the global resource chal-
in gross domestic product (GDP) and population levels lenge. The integration of efficient hardware with
over the next 15 years will translate into even stronger Internet-enabled software is the new frontier of
levels of resource demand. Our analysis indicates natural resource productivity. This approach pro-
that in the absence of additional improvements in vides an avenue to achieve resource productivity
the intensity of resource use per dollar of GDP, both improvements above and beyond those that can
materials extraction and energy consumption will be achieved through hardware advances alone.
increase by 80 percent by 2030. Further, accord- We call this Digital Resource Productivity, and
ing to the Organization for Economic Co-operation we believe that productivity improvements can
and Development (OECD), without additional water be doubled over the next 15 years by integrating
conservation and productivity improvements, the software and hardware to optimize resource use.
number of people living under water stress will
grow from 1 billion today to 3.9 billion in 2050.1 Resource productivity improvements of this mag-
nitude would have major implications for global
Additional solutions are needed to hold resource industrial energy consumption. Over the last decade,
demand in check without risking human or eco- through advances in the efficiency of hardware,
nomic development . Enter the Industrial Internet energy productivity improved at a rate of 1 percent
(www.gesoftware.com/industrial-internet). By per year. If this same rate were to persist through
combining remote sensors, communications 2030 as expected, global industrial energy con-
technologies, and cloud-based computing with sumption will grow from 270 quadrillion Btu (quads)
industrial machinery, the Industrial Internet opens in 2013 to 416 quads in 2030. However, if the rate
new avenues for increasing the productivity of of energy productivity improvement is doubled to
the global industrial complex. The integration of 2 percent per year through the combination of
industrial hardware with Internet-based software efficient hardware and Internet-enabled software,
© 2014 General Electric Company. All rights reserved.
This material may not be copied or distributed in whole or in part 5
without prior permission of the copyright owner.EXECUTIVE SUMMARY
then global industrial energy consumption will Consider GE’s PowerUp solution, which is available
be held to 346 quads by 2030. That represents for wind turbine models across GE’s installed base
a reduction of 70 quads, which is equivalent to and is part of GE’s ecomagination Brilliant Wind™
roughly 12 billion barrels of oil—or just over a third turbine platform. PowerUp harnesses the Industrial
of the world’s annual oil consumption. Internet to drive higher power output and create new
revenue streams for wind farm operators. PowerUp
The important role that software can play in address- analyzes tens of thousands of data points in a wind
ing the global resource challenge is widely recog- farm every second in order to fine-tune performance
nized by corporate leaders, and some are taking and increase output. PowerUp is already at work
action in response. A 2014 survey of 254 corporate in the field, improving wind turbine performance.
executives sponsored by GE and Accenture provides For example, since European utility E.ON’s 469 wind
some insight . When asked about their top strate- turbines enrolled in PowerUp, power output has
gies related to big data and analytics over the next increased by 4.1 percent, the equivalent of adding
one to three years, 60 percent identified resource 19 additional GE wind turbines.
management as a top priority. More respondents
identified resource management as a top strategy Ecomagination is GE’s commitment to creating
than any other category. Furthermore, 55 percent of technologies that maximize resource efficiency,
corporate executives indicated that improving safety economics, and environmental performance.
and environmental emissions was a top strategy. The Since its founding in 2005, the GE technologies
importance of resource management and environ- and solutions in the ecomagination portfolio
mental stewardship is not only top of mind for many have generated $180 billion in revenue. GE
executives, it has become a strategic imperative in has maintained its commitment to efficient
the context of big data and analytics initiatives.2 resource solutions by investing $15 billion in
research and development over this period.
Digital Resource Productivity is
not just a vision of the future— The Industrial Internet is the integration of
complex physical machinery with networked
it is here today. Industrial sensors and software. The Industrial Internet
Internet solutions developed by draws together fields such as machine learn-
GE are already at work improv- ing, big data, the Internet of Things (IoT), and
machine-to-machine communication to ingest
ing resource productivity for data from machines, analyze it (often in real
our customers. time), and use it to optimize operations.
Digital Resource Productivity is not just a vision of Digital Resource Productivity is the combina-
the future—it is here today. Industrial Internet solu- tion of ecomagination solutions with Industrial
tions developed by GE are already at work improving Internet software innovations. By enabling opti-
resource productivity for our customers. Since 2012, mization to occur on an industrial scale, the
GE has released 40 Industrial Internet solutions with integration of efficient hardware and advanced
many more on the horizon. All of them are part of software offers a new approach to achieving
the Predictivity™ suite of solutions, which is now accelerated resource productivity.
included in the ecomagination portfolio.
© 2014 General Electric Company. All rights reserved.
This material may not be copied or distributed in whole or in part 6
without prior permission of the copyright owner.EXECUTIVE SUMMARY
Figure 1. The power of two: when hardware meets software
Continued ecomagination hardware advances combined with Industrial
Internet software have the potential to transform global resource use.
When hardware meets software, barriers to resource productivity im-
provement can be broken.
Ecomagination Industrial Accelerated
Hardware Internet Software Resource Productivity
• Design improvements • Big data analysis • Industrial-scale
• Advanced materials • Machine learning resource savings
• Integrated hardware techniques • Fuel consumption
approaches • Predictive maintenance reductions
• Asset and system • Water conservation
optimization • Reduced emissions
Source: GE.
© 2014 General Electric Company. All rights reserved.
This material may not be copied or distributed in whole or in part
without prior permission of the copyright owner.EXECUTIVE SUMMARY
Also consider GE’s Flight Efficiency Services™, tool, InSight opens the door to a range of possi-
an Internet-enabled aviation navigation service bilities that lead to increased water productivity
that examines flight data to design more efficient and reduced water consumption.
flight patterns. The result is a reduction in both
fuel consumption and flight miles. Brazilian air- These examples represent a handful of hardware
line Gol Linhas Aéreas Inteligentes has employed and software solutions within GE’s ecomagination
Flight Efficiency Services and has already realized portfolio. Whether it’s reduced jet fuel consump-
US$100 million in savings over five years. They tion, lower natural gas use, diesel fuel savings,
have saved an average of 22 miles per flight and reductions in water consumption, or increases
77 gallons of jet fuel per flight , and have reduced in wind power—each of these solutions provides
CO 2 emissions by 1,628 pounds per flight . direct benefits that enhance resource productivity.
And this is just a sampling, with many more inno-
Another example is GE’s Movement Planner™, which vations on the horizon. That’s the most exciting
is the railroad equivalent of an air-traffic control part—the journey has just begun. A new world
system. The Movement Planner is breakthrough of possibilities is being unlocked through the
technology enabling more locomotives to run on Industrial Internet . Software solutions commer-
the same railroad track at faster speeds and with cially available and under development are just
greater efficiency—without laying new track. In the the tip of the iceberg. That’s why we believe that
United States, Norfolk Southern has implemented the integration of ecomagination hardware and
Movement Planner along its entire 20,000 route software has the potential to double the future
miles in its 22-state rail network. Deborah Butler, rate of resource productivity improvement .
Norfolk Southern’s chief information officer, says
her railroad has seen a 6.3 percent reduction in At GE, we are excited about the opportunity to play
fuel usage and 10–20 percent increases in velocity a role in helping to confront the global resource
by installing Movement Planner on its network. 3 challenge. Today we are embarking upon a new
In general, better velocity also means better cap- frontier of Digital Resource Productivity by expand-
ital utilization—when trips are faster, the railroad ing ecomagination to encompass GE’s Predictivity
needs less capital equipment to operate them. suite of solutions. Join us as we help transform
This saves even more resources. the future of global resource productivity.
GE’s Water & Process InSight solution also holds We are embarking upon
great promise as a resource productivity tool.
InSight provides a method to improve water pro- a new frontier of Digital
ductivity as well as reduce water consumption Resource Productivity by
in wastewater, boiler water, and cooling water expanding ecomagination
treatment applications. InSight is a knowledge
management system that transforms vast amounts to encompass GE’s
of operating data at industrial water facilities Predictivity™ suite of solu-
into meaningful and actionable information that tions. Join us as we help
enables operational optimization, data visualiza-
tion, diagnostics, and reporting. By providing a transform the future of global
centralized data management and operations resource productivity.
© 2014 General Electric Company. All rights reserved.
This material may not be copied or distributed in whole or in part 8
without prior permission of the copyright owner.I. INTRODUCTION
I. INTRODUCTION
A great global resource challenge is upon us. The machinery, the Industrial Internet opens new ave-
demand for natural resources is outstripping avail- nues for increasing the productivity of the global
able supplies in many regions around the world. industrial complex. The integration of industrial
Regional resource imbalances are occurring for hardware with Internet-based software enables
energy, water, food, and materials. These imbal- more efficient management and use of human,
ances are driving up commodity prices and cre- capital, and natural resources within industrial
ating resource stresses that have social, political, machines, fleets, facilities, and networks. The
and economic implications. Industrial Internet enables resources to be opti-
mized across the entire industrial system.
Since its inception in 2005, GE’s ecomagination has
been part of the solution to global resource challenges. The combination of ecomagination solutions with
Ecomagination is GE’s commitment to developing the Industrial Internet has the potential to play a
technologies that make the most of the world’s key role in solving the global resource challenge.
valuable natural resources. GE’s ecomagination The integration of efficient hardware with Internet-
program has been at the forefront of resource enabled software is the new frontier of natural
productivity solutions for a decade. However, given resource productivity. This approach provides an
the pace of rising resource demand, it is clear that avenue to achieve resource productivity improve-
additional—more revolutionary—solutions will be ments above and beyond those that can be achieved
required to hold resource demand in check without through hardware advances alone. We call this
risking human or economic development . Digital Resource Productivity.
That’s where the Industrial Internet comes in. By
combining remote sensors, communications tech-
nologies, and cloud-based computing with industrial
© 2014 General Electric Company. All rights reserved.
This material may not be copied or distributed in whole or in part 9
without prior permission of the copyright owner.II. THE GLOBAL NATURAL RESOURCE CHALLENGE
II. THE GLOBAL
NATURAL RESOURCE
CHALLENGE
The demand for natural resources is on the rise Btu (quads) to 530 quads in 2012.5 Coal and natural
across the globe. This is not new—natural resources gas consumption grew the most. Coal consumption
have always been a critical input to economic rose 59 percent from 96 to 152 quads and natu-
growth and rising living standards. However, the ral gas consumption rose from 90 to 125 quads.6
rate of growth in natural resource use has accel- These increases are being driven by population
erated since the turn of the twenty-first century. growth and the industrialization of the developing
This rapid rise in demand has created challenges world, which has accelerated since 2000.
for all natural resources. The challenges are most
acute for water and minerals. At the global, regional, and local level, natural
resource supplies have often struggled to keep pace
This trend is evident when we examine data for with accelerated demand. The imbalance between
a subset of all natural resources—materials and supply and demand is evident when we examine
energy. Figure 2 shows the growth in the extraction global traded commodity prices. Real prices for
of materials and consumption of energy. Materials all commodities have increased significantly since
consumption includes biomass, fossil energy car- the turn of the century. The World Bank’s real price
riers, ores, and industrial minerals, as well as bulk indices have risen for all commodities since 1998.
minerals used for construction.4 Since 2000, mate- Energy prices have increased fivefold, non-energy
rials extraction has grown at an average annual prices have risen 60 percent , and precious metal
rate of 3.4 percent rising from 49.7 gigatons (Gt) prices have grown 360 percent .7
in 2000 to an estimated 70 Gt by 2010. The larg-
est growth has come from construction minerals, Some natural resources, such as water, are not
which have risen from 17.5 Gt in 2000 to approx- traded in formalized commodity markets and do
imately 30 Gt in 2012. not have transparent prices that reflect increasing
scarcity. In order to gain insight into these resources,
Energy consumption has also grown since 2000. it is necessary to examine resource availability and
According to the United States Energy Information stresses at the local level. In the case of water, like
Administration (EIA), total primary energy con- energy, it is clear that in many parts of the world
sumption grew by 33 percent, from 398 quadrillion demand is outstripping available supplies.
© 2014 General Electric Company. All rights reserved.
This material may not be copied or distributed in whole or in part 10
without prior permission of the copyright owner.II. THE GLOBAL NATURAL RESOURCE CHALLENGE
Figure 2. Global materials extraction and energy consumption (1960–2010)
Global Materials Consumption Global Energy Consumption
Between 2000 and 2009, global materials consump- Between 2000 and 2010, global energy consump-
tion increased 37 percent. The largest increases tion increased by 33 percent. The largest increases
37 33
have come from construction materials. have come from coal.
+ %
+ %
70 700
60 Biomass 600 Coal
Gigatons of materials consumption*
Quads of energy consumption**
Construction Natural
50 minerals 500 gas
Fossil Oil
energy
40 carriers
400
Ores and Other
industrial
30 minerals 300
20 200
10 100
0 0
1960 1970 1980 1990 2000 2009 1960 1970 1980 1990 2000 2010
+37% +33%
*Source: Krausmann et al., “Growth in global materials use, GDP and population during the 20th century,”
Ecological Economics 68, no. 10 (2009): 2696–2705. Data version 1.2, revised August 2011.
**Source: US Energy Information Administration (EIA), International Energy Statistics,
available at http://www.eia.gov/cfapps/ipdbproject/IEDIndex3.cfm, accessed August 26, 2014.
© 2014 General Electric Company. All rights reserved.
This material may not be copied or distributed in whole or in part
without prior permission of the copyright owner.II. THE GLOBAL NATURAL RESOURCE CHALLENGE
The World Resources Institute (WRI) has exam- and resource consumption had weakened. However,
ined local water stress throughout the globe and since the turn of the twenty-first century, the
found extreme stress in select areas across all link between global incomes and materials use
seven continents. The most stressed regions are has tightened. Between 2000 and 2010, resource
Africa, the Middle East , and Australia. According use and incomes levels grew in tandem. Global
to the Organization for Economic Co-operation incomes rose at an average annual rate of 2.4
and Development (OECD), one billion people live in percent , while per capita materials grew at an
water-stressed regions today. 8 Furthermore, WRI average annual rate of 2.2 percent .
expects water stress to intensify over the next 15
years across all scenarios. 9 Ensuring adequate The Vice Is Tightening
supplies of water in many parts of the world will
be a challenge in the face of rising population The stronger linkage between natural resource
and economic output levels. consumption and incomes has important implica-
tions for the pace and direction of natural resource
The trends are clear—since the year 2000, natural demand over the next 15 years. If the relationship
resource demand has risen rapidly, and this has persists, expected increases in gross domestic
had a direct and measurable impact on resource product (GDP) and population levels will translate
availability and commodity prices. In this environ- into even stronger levels of resource demand. In
ment , the challenge is to ensure that communi- fact , GE analysis indicates that in the absence
ties and businesses have the resources that they of additional improvements in the intensity of
need to improve livings standards and sustain resource use per dollar of GDP, both materials
economic activities. extraction and energy consumption will increase
by 80 percent by 2030.
Natural Resources and Economic Growth
In the absence of improve-
Natural resources are, and always have been, a
critical ingredient to economic growth and rising
ments in the intensity of
income levels. The historical connection between resource use per dollar
natural resources and economic growth can be of GDP, both materials
better understood by examining the link between
materials consumption and incomes. The relation-
extraction and energy
ship between per capita resource consumption consumption will increase
and income between 1900 and 2011 is illustrated by 80 percent by 2030.
in Figure 5.
This assessment of future resource consumption
In the past, there have been periods of time where is based on population and economic growth out-
both incomes and resource use rose slowly (1900– looks. According to the United Nations, the global
1950), periods where both have risen more rapidly population level will increase from 7.2 to 8.4 billion
(1951–1970), and periods where resource use has by 2030. This means that 1.2 billion people will
stagnated, but incomes have continued to rise be added to the planet in the next 16 years. Over
(1971–1990). By the end of the twentieth century, 90 percent of this population growth will occur in
the strength of the correlation between incomes the developing world.
© 2014 General Electric Company. All rights reserved.
This material may not be copied or distributed in whole or in part 12
without prior permission of the copyright owner.II. THE GLOBAL NATURAL RESOURCE CHALLENGE
Figure 3. Rising commodity prices reflect increasing resource scarcity (1960–2013)
Global Commodity Prices Energy Prices
500
The rise in commodity prices since the turn of the
+
century is a reflection of the global resource crunch.
Since 1998, energy prices have increased fivefold,
non-energy prices have risen 60 percent, and pre-
cious metal prices have grown 360 percent.
%
Precious Metal Prices Non-Energy Prices
+360 +60 % %
140
120 Non-energy
prices
100
Commodity Price Index
80
Precious metal
prices
60 Energy
prices
40
20
0
1960 1965 1970 1975 1980 1985 1990 1995 2000 2005 2010 2013
Source: World Bank, Commodity Price Data (The Pink Sheet), updated August 4, 2014.
© 2014 General Electric Company. All rights reserved.
This material may not be copied or distributed in whole or in part
without prior permission of the copyright owner.II. THE GLOBAL NATURAL RESOURCE CHALLENGE
Figure 4. 2013 global water stress map
Global Water Stress
1.2
Water is a critical natural resource. Water stress is
present around the world and is expected to inten-
sify over the next decade in the presence of rising
economic and population levels.
Extremely High Stress (>80%)
The baseline water stress indicator estimates the High Stress (40–80%)
degree to which freshwater availability is an ongo- Medium-High Stress (20–40%)
ing concern. High levels of baseline water stress are Moderate Stress (10–20%)
associated with increased socioeconomic competi- Low Stress (II. THE GLOBAL NATURAL RESOURCE CHALLENGE
GDP is expected to rise too. GE estimates that world
GDP will grow from an estimated $78.2 trillion by the The size of today’s challenge should not be
end of 2014 to $138.4 trillion by 2030. That’s a 77 underestimated; nor should the obstacles
percent increase in global output. A full 75 percent to diffusing more resource-efficient tech-
of this growth will occur in the developing world. nologies throughout the global economy.
The next 20 years appear likely to be quite
This has important implications for resource use, different from the resource-related shocks
because growth in less developed countries will that have periodically erupted in history.
require the construction of critical infrastructure Up to 3 billion more middle-class consum-
such as buildings, transportation networks, energy ers will emerge in the next 20 years com-
systems, and water facilities. The development of pared with 1.8 billion today, driving up
this infrastructure requires increased resource demand for a range of different resources.
use. There is strong evidence to support this. The This soaring demand will occur at a time
surge in materials use over the last decade has when finding new sources of supply and
coincided with a construction boom in China. As a extracting them is becoming increasingly
result , 60 percent of the growth in materials use challenging and expensive… Compounding
since 2000 has been due to growth in the con- the challenge are stronger links between
sumption of construction-related minerals. The resources, which increase the risk that
concentration of growth in the developing world shortages and price changes in one
over the next two decades also tells us that the resource can rapidly spread to others.11
majority of increase in resource demand will occur
in these regions as well.
The truth is, meeting projected resource demand
At the global level, the net result will be more indi- would require historically unprecedented increases
viduals at higher income levels by 2030. Global per in supply. Rapid growth in supply can involve
capita incomes are expected to rise from US$10,794 significant capital, infrastructure, and geopo-
(2005 purchasing power parity [PPP]) to US$16,430 litical risks. Much of the solution to the global
(2005 PPP) by 2030. That’s a 52 percent increase resource challenge is going to have to come from
in global per capita income. As we have seen, demand-side options in the form of increased
higher income levels are correlated with greater resource productivity. The key question and the
natural resource use. In fact , if there are no gains crux of the global resource challenge is: How can
in resource productivity, the increase in global we do more with the world’s natural resources?
per capita incomes from $10,794 to $16,430 will
translate into an 80 percent increase in material The Resource Productivity Imperative
and energy consumption levels by 2030.
Resource productivity is a measure of the quantity
Given the costs and risks associated with expand- of goods or services provided per unit of resources
ing resource supplies, an 80 percent increase in used. At the economy level, it can be expressed in
natural resource consumption by 2030 is simply terms of resources consumed per dollar of GDP. We
infeasible. A 2011 study by the McKinsey Global can calculate global resource productivity for materials
Institute (MGI) highlighted the challenges of growing and energy consumption. Similar data is not available
global resource consumption.10 According to MGI: to calculate water productivity at the global level.
© 2014 General Electric Company. All rights reserved.
This material may not be copied or distributed in whole or in part 15
without prior permission of the copyright owner.II. THE GLOBAL NATURAL RESOURCE CHALLENGE
Figure 5. Global per capita materials use and income (1950–2010)
Per Capita Materials Consumption and Income Levels
+ 31.3
Per capita materials consumption and per capita
incomes were correlated throughout the twentieth
century. Since the turn of the century, the linkage
%
has strengthened and they have grown in tandem.
11 $11,000
Per capita
materials
10 consumption $10,000
9 $9,000
Per Capita Materials Consumption (tons per person)
8 $8,000
7 $7,000
Per Capita Income
6 $6,000
Per capita
income levels
5 $5,000
4 $4,000
3 $3,000
2 $2,000
1 $1,000
0 $0
1950 1955 1960 1965 1970 1975 1980 1985 1990 1995 2000 2005 2012
+31.3%
Source: Krausmann et al., “Growth in global materials use, GDP and population during the 20th century,”
Ecological Economics 68, no. 10 (2009): 2696–2705. Data version 1.2, revised August 2011. Population data
from United Nations Population Division, Change to World Population Prospects: The 2012 Revision.
Income data from GE.
© 2014 General Electric Company. All rights reserved.
This material may not be copied or distributed in whole or in part 16
without prior permission of the copyright owner.II. THE GLOBAL NATURAL RESOURCE CHALLENGE
In 2010, the global GDP was US$68.7 trillion (2005 growing economies and population. According
PPP). Global materials consumption in 2010 was 70.7 to the OECD, if current trends persist , the num-
Gt. Thus, the level of global materials productivity ber of people subject to water stress will grow
in 2010 was $970 per ton of materials. Materials from 1 billion today to over 3.9 billion by 2050.
productivity has actually fallen since 2000 from $976 Already, 63 percent of the population in Brazil,
per ton. Similarly, global energy consumption in Russia, India, and China together are living under
2012 was 530 quads. In 2012, the global GDP was medium-to-severe water stress; this share will
US$73.5 trillion (2005 PPP). Thus, the level of global increase to 80 percent by 2050. 13
energy productivity in 2012 was $139 per million Btu.
How will the world accelerate resource produc-
Historically, due to the onward march of technol- tivity to meet the resource needs of growing
ogy progress, resource productivity has steadily economies and populations over the next two
improved. Between 1970 and 1999, global mate- decades? After examining the global resource
rials productivity improved at an average annual challenge, MGI identified resource productivity
rate of 1.2 percent. However, more recently, in the improvements that could address more than 80
period between 2000 and 2010, materials pro- percent of expected growth in demand for energy,
ductivity improved at a much slower rate of 0.2 60 percent of anticipated growth in demand for
percent . Rapid growth in the developing world, water, and one-quarter of expected growth in
which has led to a construction boom, is largely demand for steel. 14
responsible for the reduction. The productivity
of energy has also improved over time. Between MGI’s identified solutions are heavily focused on
1970 and 2012, energy productivity improved at hardware and process improvements. 15 The top
an average annual rate of 1.2 percent . solutions identified by MGI include building energy
efficiency, large-scale farm yield improvements,
In the face of the global resource challenge, there and food waste reduction. The message from MGI’s
is an urgent need to maintain continued resource research is that there is tremendous scope for con-
productivity improvements and keep resource use tinued resource productivity improvements. They
in check. Because resource productivity improve- caution, however, that implementing the identified
ments must occur without sacrificing economic solutions will not be easy. They estimate that only
growth, this is also known as decoupling resource 20 percent of the solutions are readily achievable
use from economic growth. In the words of the and conclude that additional measures will be
OECD: “Rising income and aspirations for better required to meet global resource demand by 2030.
living standards will increase the pressure on the
planet’s natural resources. The economic prospects Clearly, additional solutions beyond currently
of many of the poorest countries are threatened identified options will be required to solve the
by unsustainable use of natural resources, uncon- global resource challenge. Fortunately, there’s
trolled pollution in rapidly growing cities, and the another set of potential solutions that haven’t
impacts of climate change.” 12 been fully considered by MGI or others. These
solutions are the product of 50 years of contin-
The resource challenge is not limited to energy uous innovation and are now in a position to
and materials. Water resources will also be transform how resources are used within the
stretched to the limit in order to keep up with global industrial system.
© 2014 General Electric Company. All rights reserved.
This material may not be copied or distributed in whole or in part 17
without prior permission of the copyright owner.II. THE GLOBAL NATURAL RESOURCE CHALLENGE
Figure 6. Going up—population, GDP, and incomes expected to rise
Population Growth Economic Growth
Todays’ global population level of 7.2 billion will The size of the global economy will increase by
grow to 8.4 billion by 2030, an increase of 1.2 billion US$18.8 trillion (2005 purchasing power parity) be-
people on the planet. Ninety-one percent of the in- tween 2014 and 2030. Over 75 percent of this growth
crease will occur in the developing world. will occur in the developing world.
+ 1.2 billion people
by 2030
+$ 18.8 trillion
2014–2030
Per Capita Income Growth
Growing populations and economies will push up income levels.
Between 2014 and 2030, global per capita incomes will rise by 52 percent.
Indonesia India
400,000 Nigeria China
Iran
Ethiopia Brazil
USA
100,000
Japan
20,000 UK
Population Growth (2014–2030)
5,000
1,000 Per capita
income growth
200
>1.5%
50
1.0–1.5%
10
0.5–1.0%
2 Developing countries
Developed countriesIII. WHEN HARDWARE MEETS SOFTWARE III. WHEN HARDWARE MEETS SOFTWARE Ecomagination Ecomagination is GE’s commitment to devel- generated more than $180 billion in revenue. oping technologies that make the most of the GE has maintained its commitment to efficient world’s valuable natural resources. Established resource solutions by investing $15 billion in in 2005, GE’s ecomagination program has been research and development over this period. We at the forefront of resource productivity solu- have also reduced our environmental impact tions. Since its founding, the GE technologies and by reducing our greenhouse gas emissions and solutions in the ecomagination portfolio have freshwater use. © 2014 General Electric Company. All rights reserved. This material may not be copied or distributed in whole or in part 19 without prior permission of the copyright owner.
III. WHEN HARDWARE MEETS SOFTWARE

Ecomagination technologies are at the cutting                             be controlled to operate at top performance. The
edge of resource productivity. For example, con-                          J920 FleXtra mechanical structure is designed to
sider GE’s GEnx aircraft engines, GE’s turbofan                           allow high-peak firing pressure. In combination
engine family for select wide-body aircraft . GEnx                        with the latest miller technology and two-stage
engines use advanced GE propulsion technology to                          turbocharging, the J920 FleXtra engine can achieve
reduce fuel consumption, associated carbon dioxide                        a top-of-its-class electrical efficiency of 48.7 per-
(CO2) and oxides of nitrogen (NOx) emissions, noise,                      cent for 50 Hz and 49 percent for 60 Hz.
and operating cost, compared to the engines they
replace. In comparison with the previous model                            Ecomagination solutions by GE
(GE’s CF6 engine), the GEnx engine reduces fuel
by more than 10 percent , which translates to a                           will continue to play a key role
double double-digit reduction in CO2.                                     in increasing resource produc-
GE’s Evolution Series locomotive is another example
                                                                          tivity over time.
of resource-efficient ecomagination technology. The
Evolution locomotive is the most technologically                          These ecomagination solutions are concrete exam-
advanced diesel-electric, heavy-haul locomotive in the                    ples of the latest hardware innovations that have
world today. GE has just released the Evolution Series                    improved resource productivity across industries
Tier 4 engine, which is the first mainline locomotive                     over the last decade. At GE, given our commitment
to meet the United States Environmental Protection                        to continued research and development targeted
Agency’s stringent Tier 4 emission standards, which                       toward resource-efficient solutions, we are excited
call for the single-largest emission reduction in the                     about the continued prospects for additional tech-
rail sector’s history. The new locomotive will meet                       nology advances in the future. However, we also
this standard without the use of aftertreatment .                         recognize that given the global resource challenge,
GE Transportation has invested $600 million in                            there is a need for even greater resource productivity
the Evolution Series since its introduction in 2005.                      improvements than can be delivered by hardware
The point is, thanks to continuous innovation and                         improvements alone. In our view, the key to solving
investment, these types of hardware improvements                          the great global resource challenge involves the
by GE and others will continue and will play a key                        integration of traditional advances in industrial equip-
role in increasing resource productivity over time.                       ment through an initiative like GE’s ecomagination
                                                                          program with the Internet-enabled software that
A final example from the ecomagination portfolio is                       squeezes the most out of hardware and enables
GE’s J920 FleXtra gas engine, which is at the top of                      broader optimization across the industrial system.
its class for electrical efficiency and is designed for
durability, simple installation, and maintainability.                     The Industrial Internet 16
Based on the extensive experience of GE’s Type 6
gas engine combustion system, the J920 FleXtra                            Software has been used in industrial processes
unit is equipped with an advanced pre-chamber                             since 1959. That’s the year that Texaco’s Port
combustion system with spark ignition for longer                          Arthur refinery became the first chemical plant
part life. In addition, the individual gas mixing                         to use digital control. The Port Arthur refinery
achieved by port injection in combination with                            used an RW-300 mainframe manufactured by
cylinder-specific sensors allows each cylinder to                         Ramo-Wooldridge Corporation and led the way in

© 2014 General Electric Company. All rights reserved.
This material may not be copied or distributed in whole or in part   20
without prior permission of the copyright owner.
III. WHEN HARDWARE MEETS SOFTWARE
Figure 7. A decade of ecomagination
2005 Goals 2007 Expansion 2010 Progress 2013 Success
In 2005, GE launched ecomagination, its commitment and strategy In 2007, GE announced a new
1. $5 billion invested in clean R&D. 1. $12 billion invested in clean R&D.
to solve the world’s biggest energy and environmental challenges. commitment in addition to the
2. $85 billion in ecomagination 2. $160 billion in ecomagination
original three.
product revenue. product revenue.
GE commits to:
3. 22% reduction in GE’s GHG emissions 3. 32% reduction in GE’s GHG emissions
1. Doubling its investment in clean research and development 4. GE commits to reducing its global
from the 2004 baseline. from the 2004 baseline.
(R&D) from $700 billion/year to $1.5 billion/year by 2010. water use by 20 percent between
4. 30% reduction in water use from 4. 45% reduction in GE’s water use
2. Growing revenues from ecomagination 2006 and 2012.
the 2006 baseline. from the 2006 baseline.
products to at least $20 billion.
3. Reducing its greenhouse gas (GHG) emissions
by at least 1% by 2012.
2005 2007 2009 2010 2012 2014
2005 2007 2007 2010 2012 2014
GE creates the ecomagination product review GE Transportation’s partner GE’s broad portfolio of GE commits to buying Ecomagination Nation, a global GE opens the ecomagination
scorecard, which quantifies a product’s or United Group Rail delivers 10 ecomagination products 25,000 alternative fuel GE Power & Water initiative center in Masdar City, United
solution’s environmental benefits. Evolution Series locomotives spans the entire range vehicles by 2015 to use in its designed to protect the Arab Emirates.
to Rio Tinto Iron Ore, bringing of GE businesses. fleets and those of its fleet- 25,000 environment by encouraging
advanced locomotive technology services business in 2010: employees to take action, gains
2005 to an energy-intensive industry. increasing momentum within GE. 2014
GE surpasses 5,000 installations 2007 GE provides its ZeeWeed™
for its 1.5 megawatt wind turbine. GE invests more 2010 1500 ultrafiltration system
1
2007 than $1 billion Ecomagination software 2012 to the Santa Eufemia water
2006
5,000 The GEnx becomes the quietest,
most energy-efficient and fastest-
on clean R&D,
drawing closer to $ solution, Movement Planner™,
makes it possible for trains
GE’s ecomagination portfolio
expands to include CNG In A
treatment plant in
Northern Portugal.
GE increases its annual selling large engine in GE Aviation the 2005 pledge billion to move more freight faster Box™, GE’s fully integrated CNG
900
investment in clean R&D history. Emirates, an airline based to invest $1.5 and more efficiently on fuel supply system.
2014
from $700 to $900 million
and expands research on $ in Dubai, is among those GE
customers that have chosen GEnx
billion by 2010. existing rail lines.
San Diego becomes the first
renewable energy, clean coal, million engines to power their fleets. 2013 city to install LightGrid™, GE’s
carbon captures, water, and 2009 2010 Ecomagination launches wireless lighting control system.
energy efficiency. GE surpasses GE researchers set a world Brilliant™ Wind, a renewable
1.5
2007 its clean tech record of 12.8% thin film energy system comprised of
2014
2006
GE Energy’s Jenbacher gas
engines power Japan’s largest
R&D goal of
$1.5 billion one $ solar panel efficiency.
12.8%
a wind turbine, battery and
software. The system harnesses GE sets new ecomagination
15
GE launches ecomagination in China, wood gas-to-energy plant. year early. billion the power of the Industrial commitments. After investing
2010
nearly 100 years since GE first began
working in the country. Proficy™, a software platform for
Internet and reaps the benefits
of energy storage without
$15 billion in clean R&D since
2005, GE commits to investing $
measuring and managing the the high costs. a total of $25 billion by 2020. billion
efficiency of manufacturing GE also commits to reducing
A Decade of Ecomagination operations, is included in the
ecomaginaton portfolio.
GHG emissions and water
use by another 20% from the
2011 baseline.
GE’s ecomatination initiative, launched in 2005, led to the development of ultra-efficient technologies that 2011
have provided resource productivity improvements across industries. Looking ahead, ecomagination Ecomagination opens GE to 2014
outside innovation through GE’s Predictivity™ Industrial
and the Industrial Internet promise to unleash accelerated resource productivity improvements. the Ecomagination Challenge. Internet solutions are added
Collaborating with venture capital to the ecomagination portfolio.
firms, GE invests more than
Source: GE. $130 million in 22 companies to
help bring exciting new energy
© 2014 General Electric Company. All rights reserved. This material may not be copied or distributed in whole or in part without prior permission of the copyright owner. technologies to the world.III. WHEN HARDWARE MEETS SOFTWARE
the development of industrial computer control. 17 be tracked and controlled remotely. In 1999, the
Since that time, software has become increasingly Massachusetts Institute of Technology (MIT) estab-
integrated into industrial machinery. lished the Auto-ID Center to conduct research
focused on IoT. During the same year, the world’s
Industrial software developed in successive genera- first machine-to-machine protocol, MQ Telemetry
tions. In the 1960s, the first generation of industrial Transport (MQTT), was developed. By 2008, the first
software used large minicomputers with no connectivity international IoT conference took place in Zurich.
to other systems. By the 1970s, second-generation
software systems were in place that were distributed By 2010, improvements in information technologies
across multiple connected stations. Network proto- enabled the IoT to be applied to industrial machin-
cols were proprietary and not standardized during ery. This led to the Industrial Internet, which is the
this period. By the 1990s, third-generation industrial fourth generation of industrial software systems.
control software was in use. These systems were Technology advances include falling computing prices,
distributed and networked, and could be spread the miniaturization of computers, increasing band-
across multiple local area networks and geogra- width, and the emergence of cloud computing. All
phies, often with a single supervisor and historian. of these technology trends together provided the
tailwinds necessary to launch the Industrial Internet.
The Internet was developed in parallel to the devel-
opment of increasingly sophisticated industrial con- In 2011, GE announced its commitment to a $1 billion
trol software. The first nodes of what would become investment in industrial software and analytics over
the Advanced Research Projects Agency Network a three-year period. In 2013, GE released Predix, the
(ARPANET) were established in 1969. ARPANET was first software platform for the Industrial Internet .
the precursor to today’s Internet. In 1982, the Internet By 2014, GE had developed 40 Industrial Internet
protocol (TCP/IP) was established. This standard enabled applications in its Predictivity suite of solutions
seamless communication between interconnected using the Predix platform. The Industrial Internet
networks. The Internet grew to over 300,000 hosts by Consortium was founded in 2014 to further devel-
1990. In 1991, after the ARPANET project was con- opment, adoption, and widespread use of intercon-
cluded, all commercial restrictions on the use of the nected machines, intelligent analytics, and people at
Internet were removed. As is well known, the Internet work. The momentum behind the Industrial Internet
blossomed into a global force for communications is explosive. Over 12.5 billion devices are connected
and retail commerce in the 1990s and 2000s. The to the Internet, and CISCO estimates that there will
world was transformed in a myriad of well-docu- be 25 billion devices connected to the Internet by
mented ways by the emergence of the Internet. By 2015 and 50 billion by 2020.20
2010, the number of Internet hosts exceeded 800
million.18 The amount of data stored digitally today The development of the Industrial Internet is a
reached 300 exabytes (10 to the power of 18).19 transformative milestone for industrial resource use
because it adds a new dimension to resource produc-
In 1994, the concept of the Internet of Things (IoT) tivity. Starting in the 1960s, first-generation industrial
was first developed. The basic idea was to affix software systems were able to optimize resource
sensors to common objects in order to connect use at the machine level. In the 1970s and 1980s,
these items to the Internet . This would create interconnected second-generation industrial software
an interconnected universe where objects could systems enabled resources to be optimized at the
© 2014 General Electric Company. All rights reserved.
This material may not be copied or distributed in whole or in part 22
without prior permission of the copyright owner.III. WHEN HARDWARE MEETS SOFTWARE © 2014 General Electric Company. All rights reserved. This material may not be copied or distributed in whole or in part 23 without prior permission of the copyright owner.
III. WHEN HARDWARE MEETS SOFTWARE
Figure 8. Industrial Internet timeline
1950s–1960s 1970s–1980s 1990s–2000s 2010s–Today
Monolithic Distributed Networked Industrial Internet
Enabled Machine-Level Enabled Facility-Level Enabled Enterprise-Level Enables Global Network
Resource Optimization Resource Optimization Resource Optimization Resource Optimization
The first generation of industrial control soft- The second generation of industrial control soft- The third generation of industrial control software Over the last decade, cloud computing, network
ware used large mini-computers connected to ware was distributed across multiple independent were distributed and networked, and computers bandwidth increases, hardware improvements,
industrial machines with no connectivity to other workstations connected through proprietary com- could be interconnected through a secure local area and software advances have enabled the emer-
systems. They had limited security. munications protocols. They had limited security. network (LAN). The systems spread across multiple gence of the Industrial Internet.
LANs and across geographies.
1950 1960 1970 1980 1990 1990 2000 2010 2020
1959 1969 1982 1990 1999 2010 2013
Texaco’s Port Arthur refinery The first nodes of what The Internet protocol The Internet grows to over The Massachusetts The number of Internet hosts GE develops Predix, the first
becomes the first chemical will become the Advanced (TCP/IP) is established. 300,000 hosts. Institute of Technology exceeds 800 million. software platform for the
plant to use digital control. Research Projects Agency This standard enabled (MIT) establishes the Industrial Internet.
Network (ARPANET) are seamless communication Auto-ID Center to conduct
established. ARPANET was the between interconnected 1991 research focused on IoT. 2010
precursor to today’s Internet. networks. After the ARPANET During the same year, Improvements in information 2014
project was concluded, all the world’s first machine- technologies enable the IoT GE’s portfolio grows to 40 Industrial
commercial restrictions on to-machine protocol, to be applied to industrial Internet applications within its
1985 the use of the Internet are MQ Telemetry Transport machinery. Predictivity™ suite of solutions using
The number of hosts on removed. (MQTT), is developed. the Predix platform. The Industrial
the Internet (all TCP/IP Internet Consortium is established to
Evolution of Industrial Software Systems interconnected networks)
reaches 2,000. 1994 2008
2012
GE announces its commitment
further the development, adoption,
and widespread use of the Industrial
The concept of the Internet The first international IoT to a $1 billion investment in Internet.
Industrial software systems have evolved over the last 50 years from mono- of Things (IoT) is first conference takes place in software and analytics and
developed. The basic idea Zurich. launches the Software and
lithic systems that enabled machine-level control to the Industrial Internet, was to affix sensors to Analytical Center of Excellence 2015
which facilitates resource optimization for global industrial networks. common objects in order to in California. CISCO estimates that there will be
connect these items to the 25 billion devices connected to the
Internet. Internet by 2015 and 50 billion by
Source: GE research, the Computer History Museum (www.computerhistory.org). 2020.
© 2014 General Electric Company. All rights reserved.
This material may not be copied or distributed in whole or in part
without prior permission of the copyright owner.III. WHEN HARDWARE MEETS SOFTWARE
facility level. By the 1990s, fully networked third-gen- Resource productivity improvements of this mag-
eration industrial software systems enabled entire nitude, due to the integration of industrial hard-
industrial enterprises to optimize their resource use. ware and Internet-enabled software, would have
major implications for global industrial energy
However, it is only with the emergence of the Industrial consumption. Over the last decade, through
Internet that optimization can occur at the global advances in the efficiency of hardware, energy
level, across entire industrial networks like rail- productivity improved at a rate of 1 percent per
way, airline, and electric power. The efficiency and year. If this same rate were to persist through
operation of entire airline or railroad networks can 2030 as expected, then global industrial energy
be controlled with emerging Industrial Internet consumption will grow from 270 quads in 2013 to
solutions. Likewise, entire electricity grids can be 416 quads in 2030. However, if the rate of energy
controlled and optimized with intelligent software productivity improvement is doubled to 2 percent
solutions. This level of optimization is new and it per year through the combination of efficient hard-
required 50 years of software innovation to get here. ware and Internet-enabled software, then global
This new element offers promise for the accelera- industrial energy consumption will be held to 346
tion of resource productivity improvements above quads by 2030. That represents a reduction of 70
and beyond a level that was previously possible. quads, which is equivalent to roughly 12 billion
barrels of oil—or just over a third of the world’s
This is why we believe the combination of annual oil consumption today.
ecomagination solutions with the Industrial
Internet has the potential to play a key role in solv- The important role that software can play in address-
ing the global resource challenge. Digital Resource ing the global resource challenge is widely recog-
Productivity, which is the integration of efficient nized by corporate leaders, and some are taking
hardware with Internet-enabled software, is the action in response. A 2014 survey of 254 corpo-
new frontier of natural resource productivity. This rate executives sponsored by GE and Accenture
approach provides an avenue to achieve resource provides some insight . 21 When asked about their
productivity improvements above and beyond top strategies related to big data and analytics
those that can be achieved through hardware over the next one to three years, 60 percent iden-
advances alone. tified resource management as a top priority. More
respondents identified resource management as a
The integration of efficient top strategy than any other category. Furthermore,
hardware with Internet- 55 percent of corporate executives indicated that
improving safety and environmental emissions
enabled software is the new was a top strategy. The importance of resource
frontier in natural resource management and environmental stewardship is
productivity. This approach not only top of mind for many executives, it has
become a strategic imperative in the context of
provides an avenue to achieve big data and analytics initiatives.
resource productivity improve-
ments above and beyond those
that can be achieved through
hardware advances alone.
© 2014 General Electric Company. All rights reserved.
This material may not be copied or distributed in whole or in part 25
without prior permission of the copyright owner.You can also read