Digital Payments: On track to a less-cash future - QR; POS Investment focus wallets to other payment modes - JMFL Research Portal
←
→
Page content transcription
If your browser does not render page correctly, please read the page content below
06 November 2019

SECTOR UPDATE
INDIA INTERNET

                          Digital Payments:
                     On track to a less-cash future

             Digital                            Investment focus
                              Key enablers -
        transactions to                            to shift from
                            Payment gateways;
        reach USD 41tn                           wallets to other
                                 QR; POS
            by FY25                             payment modes
6 November 2019

SECTOR UPDATE
INDIA | INTERNET

             TABLE OF CONTENTS
                                                                                            Prince Poddar
                                                                                            prince.poddar@jmfl.com
             03    Introduction
                                                                                            Tel: (91 22) 62241879
             04    Focus Charts
             06    Fintech – attracting investments from global VCs                         Swapnil Potdukhe
                                                                                            Swapnil.potdukhe@jmfl.com
             07    Payments industry in India                                               Tel: (91 22) 62241876
             09    Landscaping the digital payments industry
             10    Sizing the digital payments market                                       Pankaj Kapoor
                                                                                            pankaj.kapoor@jmfl.com
             12    Digital payment infrastructure                                           Tel: (91 22) 66303089
             14    Pay-modes which enable digital payments
             15    Business economics for digital payments enablers
             17    Future of digital payments: Key themes
                   -    Evolving use-cases in digital payments
                   -    Positioning of payment gateway aggregators
                   -    POS deployment – government’s digital agenda
                   -    POS penetration to aid higher card transactions
                   -    UPI to lead the growth in digital payments
                   -    Will wallets be able to survive the onslaught of UPI?
             26    Government’s smart initiatives for digital payments
             28    Survey – online survey on digital payments
             29    Funding of payments intermediaries in India
             33    How are digital payments faring globally?
             35    Takeaways from management meetings
             36    Company Profiles
             60    Appendix                                                                JM Financial Research is also available on:
                                                                                           Bloomberg - JMFR ,
                   -    How have the digital payments evolved in India?
                                                                                           Thomson Publisher & Reuters
                   -    How card transaction processing works?                             S&P Capital IQ and FactSet and Visible
                                                                                           Alpha

                                                                                           Please see Appendix I at the end of this
                                                                                           report for Important Disclosures and
                                                                                           Disclaimers and Research Analyst
                                                                                           Certification.

  RECENT REPORTS

     Digital Insurance                Info Edge                  Shared Mobility   India used car report       India Road Sector

  JM Financial Institutional Securities Limited                                                                                Page 2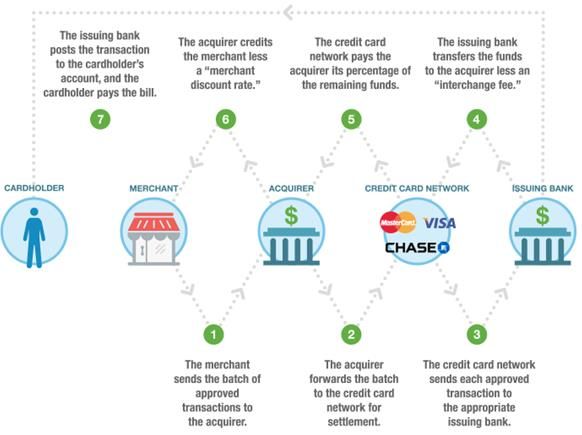
6 November 2019

SECTOR UPDATE
INDIA INTERNET

   On track to a less-cash future

    In the first report in our India Fintech series (Channel choices driving market expansion, 28Aug’19), we covered the Digital Insurance
    market in detail. We discussed how new-age insurance companies and web aggregators are leveraging the digital medium to
    penetrate the insurance industry. In this report, we attempt a deep-dive into India’s digital payments market, which is still primarily
    cash-driven despite the government’s continued efforts to make India a cashless economy. The trend is however changing, albeit
    slowly.

    Digital penetration in payments is still low in the country; this is because until a few years ago, there was limited infrastructure to
    support such payments. However, with the government’s push and innovations from PE-backed fintech companies, both users and
    merchants are slowly adopting digital transactions. From a user perspective, IMPS, NEFT and net/mobile-banking were the services
    that helped pick up adoption initially, while merchants benefitted from infrastructure support such as payment gateways, QR codes
    (introduced by Paytm in 2015) and a growing push towards POS machines; this helped provide a variety of payment options with
    convenience, speed and security. More recently, the sector has been fuelled by government initiatives such as Demonetization, the
    introduction of Unified Payments Interface (UPI) and Bharat Bill Payment System (BBPS) along with relief on service tax,
    rationalisation of merchant discount rate (MDR), support on issuance of ‘Rupay cards’ and deployment of POS devices in rural areas.

    Sizing the digital payments market                                     Digital Infrastructure is the key for penetration

    We estimate the digital payments industry to post a CAGR of            Across the various modes of payments available today, we
    11.9% over FY19-25E, reaching INR 2,875tn (USD 41tn) by                believe infrastructure support has been the key driver of
    FY25E. However, a major proportion of this market                      growth in digital transactions. Within online digital payments,
    constitutes RTGS, NEFT and IMPS, which we have chosen to               payment gateways have fuelled the sector, while in the
    exclude from our discussions. We believe UPI would record              offline mode, deployment of POS machines and QR codes
    the most robust growth among all pay modes, posting a                  served as key catalysts. UPI, the major contributor of digital
    CAGR of 82% over FY25E and reaching INR 317tn (USD                     payments in the last 18 months, has been enabled across
    4.5tn). Among non-traditional payment modes, we expect                 platforms by these infrastructure providers and can now be
    prepaid instruments (PPIs) to post the lowest CAGR of 12%              used on QR, POS machines as well as payment gateways to
    during the same period. This is likely because several                 make direct payments to merchants. With improving
    payments are expected to shift to UPI/cards during the given           technology and reach, this support is likely to become more
    period, which would also fuel overall growth in the digital            efficient, faster and secure and is expected to pull more
    payments industry.                                                     merchants online.

    Business economics for digital payment enablers                        Investment focus to shift from wallets to other modes

    Our interactions with several experts in the payments industry         The steady growth in share of digital payment volumes in
    indicate that P2M payments adoption is slated to boost                 India over the last few years is leading to increased investor
    digital payments across the country. A merchant incurs a               interest in the digital-payment enabling companies. While the
    wide range of fixed, variable and optional charges while               initial round of investments was largely focused on mobile
    accepting payments. These charges vary across pay modes                wallet companies, the next rounds of investment
    and range from 0.3% (for UPI) to over 2% (for credit cards)            opportunities are likely to be found by UPI enablers, payment
    of the total transaction amount. In most cases, a major share          gateways and POS/QR providers as wallets may find fewer
    of the interchange fee goes to the issuing bank, which takes           incremental use cases owing to the growing popularity of UPI
    the risk on the transaction. The rationalisation of MDR by the         payments. Moreover, substantial government support to push
    RBI/NPCI should help digital adoption by new businesses,               the adoption of card payments (especially Rupay), is also likely
    especially for unorganised businesses.                                 to impact the use of mobile wallets in India.

  JM Financial Institutional Securities Limited                                                                                        Page 3
Internet 6 November 2019
Focus charts
Exhibit 1. Digital payments market size (INR tn) Exhibit 2. Digital payments value market share (excluding RTGS)
3,000 2,875
NEFT UPI IMPS NACH** Credit Card @ POS Debit Card @ POS PPIs
2,583
1% 0.4%
2,500 100%
2,294 2% 2%
90% 5% 7%
2,035 6%
3% 9%
2,000 1,810 80%
1,618 70%
1,466 31%
1,500 60%
1,240
50%
990
1,000 797 40% 81%
30%
48%
500 20%
10%
0 0%
FY16 FY17 FY18 FY19 FY20F FY21F FY22F FY23F FY24F FY25F FY19 FY25F
Source: RBI, JM Financial Estimates Source: RBI, JM Financial Estimates. Note: We have excluded RTGS from this exhibit as the payment is
used for big ticket transactions that skew the value market share.
Exhibit 3. Size and likely growth trend in different pay modes
9% NACH Bubble size indicates transaction value (in INR tn)
in FY25F
Average transaction size change (FY19-25F)
7%
UPI
IMPS
5%
3%
Credit Card @ POS
1% RTGS Debit Card @PoS
-1% 0% 10% 20% 30% 40% 50% 60% 70% 80%
PPIs Volume CAGR (FY19-25F)
-3%
NEFT
-5%
Source: JM Financial
Exhibit 4. Number of digital payments per capita in a year in India Exhibit 5. Digital payments value as a % of GDP
25 22.4 800%
769%
20 750% 726%
15 13.2 700%
10.7
644%
10 650%
5.4
4.1
5 600% 579%
561%
0 550%
FY15 FY16 FY17 FY18 FY19 FY15 FY16 FY17 FY18 FY19
Source: RBI, JM Financial Source: RBI, JM Financial
JM Financial Institutional Securities Limited Page 4
Internet 6 November 2019
Exhibit 6. Payments processed by online gateways in India (in USD bn)
60
50
50
All numbers are in USD bn
40
30
20
14
10
10 7
5 5
1
0
Billdesk* PayU Atom** CCAvenue PayMate Razorpay*** Instamojo
Source: Media Reports, Company Websites, Infibeam Presentation (1QFY20), JMFLe.
Note 1: Billdesk numbers likely include offline bill payments processed through agents
Note 2: Atom has omni-channel presence and offline payments are likely included in its numbers
Note 3: Razorpay numbers are on annualized basis
Exhibit 7. In volume terms, UPI now accounts for 32% of total Exhibit 8. Average per credit card usage (no. of transactions) at POS
digital transactions in the country far exceeds debit card usage at POS and ATM combined
1.1% 0.8% 0.6% 0.5% 37 37
100% 40 36
5.2% 6.9% 7.5% 7.4%
90% 8.5% 32
16.6% 13.2% 9.9% 35
80% 29
13.0% 11.9%
30
70% 17.1%
21.2%
16.3% 25
60% 19.7%
50% 23.5% 20
20.1% 23.5%
40%
26.4% 15 13 12
11 11
30% 10
20% 32.3% 10
35.7% 32.0%
3 4 5
10% 22.9% 5 2
1
0.2% 6.2%
0%
FY17 FY18 FY19 5MFY20 0
FY15 FY16 FY17 FY18 FY19
UPI Cards @ POS PPIs NACH NEFT IMPS RTGS (Customer) Credit - PoS Debit - ATM Debit - PoS
Source: RBI, NPCI, JM Financial Source: RBI, JM Financial
Exhibit 9. PhonePe and Google Pay lead the UPI payments market Exhibit 10. UPI transactions now significantly exceed wallet
(% of transactions, Aug’19) transactions, within 3 years of launch
Others UPI transactions (million) Wallet transactions (million)
Paytm 1000
9%
BHIM 17%
2% 900
800
700
600
500
PhonePe
400
37%
300
Google Pay
35% 200
Jul-18
Apr-19
Aug-18
Sep-18
Jul-19
Aug-19
Jan-19
Dec-18
May-19
Jun-18
Jun-19
Nov-18
Oct-18
Feb-19
Mar-19
Source: Media Report, JM Financial Source: RBI, NPCI, JM Financial
JM Financial Institutional Securities Limited Page 5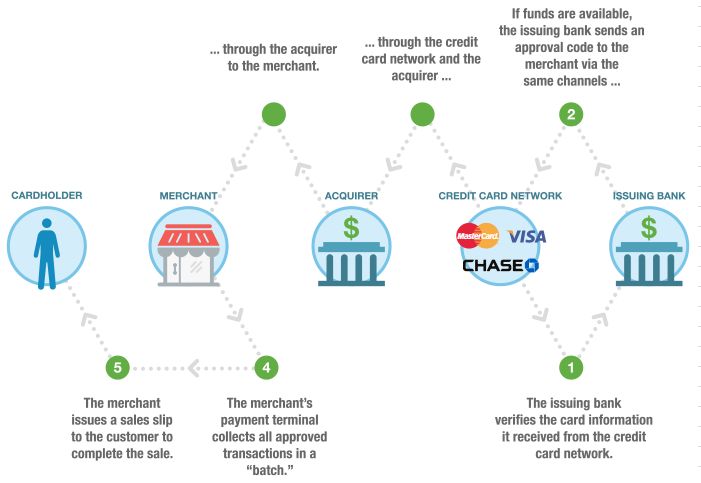
Internet 6 November 2019
Fintech – attracting investments from global VCs
Fintech companies primarily offer a convenient and personalised financial services
experience to customers; this is driven by data and analytics that are arguably better than Digital insurance
those used by banks or other financial institutions. Although gradual, Fintech has been
expanding in India in steps, beginning with initiatives such as ‘Aadhaar’ and ‘bank
accounts for all’ to ‘platforms for moving money digitally’. These have consistently been
Digital payments
supported by the government with a big push after Demonetization. Several Fintech start-
ups have used these opportunities to position themselves strongly in the digital economy.
Also, this revolution has compelled investors from overseas to show interest in the space.
Digital lending
The sector has been attracting large VC investments, especially in the past 3-5 years, with
about 19% of the overall tech investment in India going to Fintech as at end-Jul'19. This
share of funding was as low as 4% in 2014. However, a huge shift in the popularity of
the online medium and a large number of transactions taking place digitally in the past 5 Wealth-tech
years has allowed several Fintech start-ups as well as traditional players to see their
volumes rise. Demonetization provided an additional boost to the sector.
Exhibit 11. Robust growth in digital retail transactions
Digital transactions value (INR tn) YoY Growth
1,600
25%
24%
1,400
24%
1,200 Digital transaction numbers are
18% growing fast, driven by UPI and
1,000 19% affordable data costs.
800
14%
12% 14%
600
9%
400
9%
200
1,240
1,466
700
797
990
633
0 4%
FY15 FY16 FY17 FY18 FY19 5MFY20
Source: RBI, NPCI. Digital transactions include RTGS (Customer), NEFT, IMPS, NACH/ECS, UPI, credit and debit cards at POS and prepaid
payment instruments.
Exhibit 12. Fintech funding in India and as a proportion to total tech funding
Fintech funding (USD mn) Fintech share in overall tech funding
2,500 20%
18%
19% 19%
2,000 15% 16%
17%
13% 14%
1,500 12%
Fintech start-ups have attracted
sizeable funding in the past 5 years
10%
1,000 8%
6%
4%
500 4%
1,460
2,000
1,500
1,340
630
2%
205
- 0%
2014 2015 2016 2017 2018 7M 2019
Source: Tracxn, JM Financial
This is our second report on the Fintech sector. We cover the digital payments industry in
detail in this report, which will be followed by reports on digital lending and wealth-tech
over the next few months. In our last report, we tackled the Digital Insurance sector.
JM Financial Institutional Securities Limited Page 6
Internet                                                                                                                                                                                     6 November 2019

Payments industry in India
Cash is still King…
Despite the government’s efforts to transform India into a cashless society, RBI data and our
understanding suggests that cash is still the dominant mode of transactions in the country.
India has one of the highest ratios for ‘currency in circulation to GDP’ and the ‘digital
payments per capita’ is among the lowest globally. While it is difficult to estimate the total
value of cash-based transactions in India, we believe the penetration of digital transactions is
increasing rapidly, although on a rather small base.

  Exhibit 13. Ratio of currency in circulation to GDP (%) - 2017                                             Exhibit 14. Avg. number of cashless payments per inhabitant (2017)
    12.0       11                                                                                                         500 497
                        10                                                                                     500                         473
    10.0                        10                                                                             450
                                          8                                                                    400
      8.0                                                                                                      350
                                                   7
                                                           6                                                   300
      6.0                                                                                                      250
                                                                    5
                                                                             5                                                                      176
                                                                                                               200
                                                                                       4                                                                    150
      4.0                                                                                         3
                                                                                                               150
                                                                                                                                                                      96
                                                                                                               100                                                            81
      2.0                                                                                                                                                                              37         34
                                                                                                                 50                                                                                    18
                                                                                                                   0
      0.0

  Source: Bank for International Settlements, RBI, JM Financial                                              Source: Bank for International Settlements, RBI, JM Financial
  *Note: For India, data is for FY19. This data excludes RTGS and CCIL transactions.                         *Note: For India, data is for FY19. This data excludes RTGS and CCIL transactions.

Exhibit 15. Currency in circulation in India – increasing after Demonetization
     25                                                                                                                       13%
                                         Currency in circulation (INR tn)                    as a % of GDP
                                                                                                              21.4
                                         12%
                                                                                                                              12%
     20                                                                                    18.3
                    12%
                                           16.6
                                                                                                                              11%
                    14.5
     15                                                           13.4                     11%                11%
                                                                                                                              10%

     10
                                                                                                                              9%
                                                                  9%
       5
                                                                                                                              8%

       0                                                                                                                      7%
                    FY15                  FY16                   FY17                      FY18              FY19
Source: RBI, JM Financial

…but digital payments are gaining traction
The number of ‘digital payments per capita’ in India is rising fast (although it is still low
compared with global averages). It increased from 4.1 in FY15 to 22.4 in FY19. The value of
digital payments as a proportion of GDP too increased sharply, indicating the robust and
rapid growth in digital transactions. It currently stands at 769% of GDP and is trending
upwards. Further, based on our research, we believe digital payments, led by UPI, cards and
IMPS, would penetrate faster than other pay modes such as ECS, NEFT and RTGS and could
also cannibalise the use cases of other pay modes such as prepaid instruments.

JM Financial Institutional Securities Limited                                                                                                                                                           Page 7
Internet                                                                                                                                                         6 November 2019

 Exhibit 16. Number of digital payments per capita per year (India)                                     Exhibit 17. Digital payments value as a % of GDP
 25                                                                                    22.42              800%
                                                                                                                                                                   769%

 20                                                                                                       750%                                           726%

 15                                                                13.15                                  700%
                                                  10.73
                                                                                                                                                  644%
 10                                                                                                       650%
                                   5.44
             4.06
   5                                                                                                      600%                             579%
                                                                                                                           561%

   0                                                                                                      550%
             FY15                  FY16               FY17           FY18              FY19                                 FY15           FY16   FY17   FY18       FY19
 Source: RBI, JM Financial                                                                              Source: RBI, JM Financial

What is driving digital penetration?
We believe the growing penetration of smartphones/Internet connectivity, aided further by
declining data costs, is resulting in a behavioural shift in the way people transact, especially in
the urban context and is thus driving the digital payments industry. The trust factor on digital
payments however still remains low in rural India and cash continues to be a major mode of
transaction. We believe this would pick up slowly in lower-tier cities and rural areas but will
penetrate fast in urban/tier-1/tier-2 cities.

 Exhibit 18. Growing internet penetration in India                                                      Exhibit 19. Number of smartphones per 100 people in India
                                   Internet Users (m)               Penetration (%)                       30

                                                                                             48                                                           26.2
   700                                                                                             50
                                                                                       46                 25
   600                                                                           43                45
                                                                            39
                                                                     38                                   20
   500
                                                                                                   40
   400                                                       34
                                          33    33     33                                                 15
                                                                                                   35
   300                             31
                             29
            27     28                                                                              30     10
   200

                                                                                                   25                               5.4
   100
                                                                                                            5
            343

                   350

                             367

                                   392

                                          422

                                                431

                                                       429

                                                             446

                                                                    494

                                                                           512

                                                                                 560

                                                                                       604

                                                                                             637

       0                                                                                           20
                                                                                                            0
                                                                                                                                    2014                  2018

 Source: TRAI, JM Financial                                                                             Source: McKinsey, JM Financial

JM Financial Institutional Securities Limited                                                                                                                              Page 8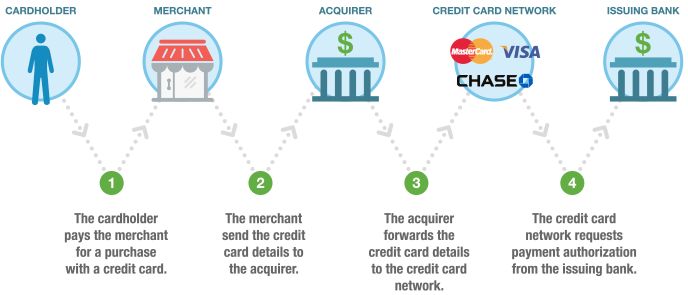
Internet                                                                                        6 November 2019

Landscaping the digital payments industry
In our view, India’s digital payments industry can be defined across two major channels: (1)
offline digital payments and (2) online digital payments. All non-cash/paper transactions in
the payments industry can be categorised into either of these channels. While the online
channel incorporates every transaction taking place through a website or an android/ios
application, the offline channel incorporates transactions at POS machines or via QR codes at
the merchant end.

The infrastructure that supports online transaction modes includes payment gateways (or
payment gateway aggregators) while the infrastructure that supports offline modes includes
physical POS machines and QR codes. For the various infrastructures combined, there are
common pay modes via which transactions may take place. These include credit and debit
cards, mobile wallets, IMPS/NEFT/RTGS, UPI, cash/pre-paid cards, Aadhar Enabled Payment
System (AEPS), etc. With improving technology and reach, various pay modes are being
enabled across infrastructure/channels. For example, UPI payment option, which used to be a
standalone mobile-only pay mode, is now also available through QR codes, POS machines
and payment gateways.

Our focus in this report lies largely on payment gateways, POS and QR codes in terms of
infrastructure and on UPI, cards and mobile wallets in terms of payment modes. For the
purpose of this report, we have not detailed traditional digital banking pay modes such as
ECS and direct transfers.

Exhibit 20. Digital payments set-up in India

Source: JM Financial

JM Financial Institutional Securities Limited                                                            Page 9
Internet 6 November 2019
Sizing the digital payments market
For sizing the digital payments market, we chose to stick to RBI’s definition of digital
payments which includes pay modes such as RTGS, credit/debit cards, NACH (National
Automated Clearing House), ECS, UPI, NEFT, IMPS and PPIs. From our understanding of the
market and discussions with several players operating in the space, we expect UPI to record
the highest growth in digital payments space in volume terms and outpace other
instruments. We think total volume growth in card payments would be driven by increasing
POS penetration, while the use of traditional digital pay modes (except IMPS) would increase
nominally. Interestingly, our discussions with digital payment companies indicate that UPI is
slated to impact growth of prepaid instruments (PPIs) meaningfully.
Our forecasts suggest that digital payments will be an INR 2,875tn (USD 41tn) market by
FY25E, posting a CAGR of 12% over FY19-25E. While RTGS will continue to account for the
largest proportion of digital payments, it would witness the lowest growth, impacting its
growth trajectory.
Exhibit 21. Digital payments market size (INR tn) Exhibit 22. Digital payments value market share (excluding RTGS)
3,000 2,875
NEFT UPI IMPS NACH** Credit Card @ POS Debit Card @ POS PPIs
2,583
100% 1% 0.4%
2,500 2,294 2%
2%
90% 5% 7%
2,035 6%
3% 9%
2,000 1,810 80%
1,618 70%
1,466 31%
1,500 60%
1,240
50%
990
1,000 797 40% 81%
30%
500 48%
20%
10%
0
0%
FY16 FY17 FY18 FY19 FY20F FY21F FY22F FY23F FY24F FY25F
FY19 FY25F
Source: RBI, JM Financial Estimates Source: RBI, JM Financial Estimates. Note: We have excluded RTGS from this exhibit as the payment is
likely used for big ticket transactions by businesses.
Exhibit 23. Size and likely growth trend in different pay-modes
9% NACH Bubble size indicates transaction value (in INR tn)
in FY25F
Average transaction size change (FY19-25F)
7%
UPI
IMPS
5%
3%
Credit Card @ POS
1% RTGS Debit Card @PoS
-1% 0% 10% 20% 30% 40% 50% 60% 70% 80%
PPIs Volume CAGR (FY19-25F)
-3%
NEFT
-5%
Source: JM Financial
Evidently, growth in the digital payments market is being driven by new-age payment
methods. With the government’s push and improving infrastructure, we believe this growth
will further pick up. Excluding traditional digital payment modes such as RTGS and NEFT, we
believe the digital payments market would post a 47% CAGR until FY25. While UPI-based
payments are likely to witness the most robust growth in this period, we expect PPIs to be
directly impacted and hence grow the slowest.
JM Financial Institutional Securities Limited Page 10Internet 6 November 2019
Exhibit 24. UPI: Payments and average payment size Exhibit 25. Credit Cards: Payments and average payment size
Transaction value (INR tn) Average payment size (INR) Transaction value (INR tn) Average payment size (INR)
350 2,500 20 4,500
317
20 4,000
300
17
2,000 3,500
239
250 14
15 3,000
1,500
200 11 2,500
166
9
10 2,000
150
1,000 8
105 1,500
6
100 5
57 5 3 1,000
500
50 2
27 500
1 9
0 0 0 0
FY18 FY19 FY20F FY21F FY22F FY23F FY24F FY25F FY16 FY17 FY18 FY19 FY20F FY21F FY22F FY23F FY24F FY25F
Source: JM Financial Source: JM Financial
Exhibit 26. Debit Cards: Payments and average payment size Exhibit 27. PPIs: Payments and average payment size
Transaction value (INR tn) Average payment size (INR) Transaction value (INR tn) Average payment size (INR)
1,600 4.5 4 700
20
20 4
1,400 4.0
17 4 600
3.5
1,200 3
15 500
15 3.0 3
12 1,000
2 400
2.5
10 2
800
10 2.0 300
8 600 1
6 1.5
200
5 400
5 1.0 1
3
0 100
2 200 0.5
0 0 0.0 0
FY16 FY17 FY18 FY19 FY20F FY21F FY22F FY23F FY24F FY25F FY16 FY17 FY18 FY19 FY20F FY21F FY22F FY23F FY24F FY25F
Source: JM Financial Source: JM Financial
Exhibit 28. IMPS: Payments and average payment size Exhibit 29. NACH*:Payments and average payment size
Transaction value (INR tn) Average payment size (INR) Transaction value (INR tn) Average payment size (INR)
97
100 80 72 8,000
90 12,000
80 70 7,000
80 58
10,000 60 6,000
70 64
8,000 50 45 5,000
60
48
50 40 35 4,000
6,000
40 36 27
30 3,000
30 25 4,000 20
16 20 15 2,000
20 11
9 2,000 7 8
10 4 10 1,000
2
0 0 0 0
FY16 FY17 FY18 FY19 FY20F FY21F FY22F FY23F FY24F FY25F FY16 FY17 FY18 FY19 FY20F FY21F FY22F FY23F FY24F FY25F
Source: JM Financial Source: JM Financial * includes ECS
JM Financial Institutional Securities Limited Page 11Internet 6 November 2019
Digital payment infrastructure
Exhibit 30. Segmenting the business-wise infrastructure support
We met Mr. Manish Patel, Founder
Mswipe, who shared his
understanding of the digital
payment infrastructure available for
various size and type of business
Source: MSwipe. JM Financial
Payment gateways provide a technology infrastructure through which online transactions
(either through cards, net banking or mobile wallets) made by customers on a merchant’s
platform are processed. Traditionally gateways were owned by banks, though off late
companies offering aggregation services (discussed in next paragraph) also operate their
own payment gateways.
Payment gateway aggregators tie-up with multiple payment gateways and pay modes
that enables them to operate like a one–stop solution for online merchants looking to
offer a wide range of payment options to their customers, without much setup
investment. The aggregators also increase the probability of a transaction succeeding as
they help the merchant immediately switch between two payment gateways during
downtimes. Merchants also benefit from the value of added services such as settlement
services, fraud detection, customer analytics, EMI/pay later option enablement, etc. that
these aggregators offer. Due to these inherent benefits, payment aggregators today have
become very popular among online businesses. Leading payment gateway aggregators in
India include CCAvenue, PayU, Billdesk, Paytm, Instamojo and Razorpay.
Exhibit 31. Payments processed by online gateways in India (in USD bn)
60
50
50
Digital payments processed
All numbers are in USD bn
40
through online gateways in India
could range at USD 70-80 bn
30 according to our estimates.
20
14
10
10 7
5 5
1
0
Billdesk* PayU Atom** CCAvenue PayMate Razorpay*** Instamojo
Source: Media Reports, Company Websites, Infibeam Presentation (1QFY20), JMFLe.
*Billdesk number likely includes offline bill payments processed through agents
** Atom has omni-channel presence and therefore both online and offline payments are likely included in its numbers
*** Razorpay numbers are on annualized basis
JM Financial Institutional Securities Limited Page 12Internet 6 November 2019
Offline payment solution providers: These companies provide PoS terminals and QR code
solutions to merchants to help them accept offline digital payments through a customer’s
card (debit/credit), mobile wallet or UPI account. Banks have traditionally been POS
providers to businesses, but companies such as Pine Labs and Mswipe have amplified the
adoption of POS machines and even players such as Paytm are now entering the space.
Additionally, QR code as a digital payment solution was introduced by Paytm in 2015 and
the concept has been replicated by most payment companies as a key payment mode.
How QR codes fuelled the momentum in cashless payments?
Improving smartphone and Internet penetration in the country, which has witnessed
tremendous growth in past 5 years, led to a unique payment option. In 2015, Paytm
introduced quick response (QR) codes, which are machine readable codes that facilitate
payments to specific merchants/entities upon scanning. Paytm hired 10,000 field agents and
started pushing QR codes as an offline payment option. Loaded with numerous use-cases,
QR codes immediately became popular, allowing a zero-cost option for the merchant along
with a hassle-free way to accept payments via smartphones. QR codes not only helped
deepen the reach of digital payments but also improved margins for small merchants.
Currently, various businesses (such as local kirana stores, auto-rickshaws, fast-food joints,
etc.) that traditionally did not accept digital payments have adopted QR codes as a payment
option. According to a media report, Paytm has over 13 million merchants on board now
and plans to add 12 million more by end of FY20.
JM Financial Institutional Securities Limited Page 13Internet 6 November 2019
Pay-modes which enable digital payments
Direct transfers: Launched in 1997, Electronic Fund Transfers (EFT) was the first one-to-
one funds transfer service offered by the RBI; it allowed individuals/institutions to transfer
funds from one bank account to another, irrespective of bank and branch. This service
was limited to only a few centres in the country and therefore was later replaced by RBI
with the more efficient service National Electronic Fund Transfer (NEFT) in 2005. Both
these services settle the transfers in predefined periodic batches. In 2004, the RBI
introduced the Real Time Gross Settlement (RTGS) service that settled transfers above INR
0.2mn in real time. But a common limitation to all these services is that they work on
specific working hours and days only. To enable transfer of funds even during non-
banking hours/days, the Immediate Payment Service (IMPS) was first introduced in Nov’10
by the NPCI. The service enabled immediate bank to bank transfer 24*7*365. But a point
to note is that the service can only be offered by RBI-licensed banks and prepaid payment
license holders. IMPS service is offered by 558 banks & PPIs, as of Sep’19.
Electronic clearing services (ECS): These are pre-authorised auto credit/debit transactions
that primarily enable one-to-many payments (e.g. dividend/salary payments by a company
or payment of subsidies by the government) and many-to-one payments (e.g. utility or life
insurance renewal premium payments). While RBI and NPCI currently operate their own
electronic clearing services, the latter’s service National Automated Clearing House
(NACH) is fast replacing the former’s ECS as it is faster and also more efficient. The payee
can give standing instructions for the transactions (which are similar to cheques) either
through a digital signature (based on eSign with Aadhaar), net banking, debit card or wet
signatures.
Cards: Despite the presence of credit and debit cards spanning over several decades, India
has one of the lowest penetrations of cards. Some of the reasons for this under
penetration are: 1) low PoS ownership among merchants due to hardware and
transaction costs, 2) low ATM penetration outside the urban areas, 3) associated costs of
owning a credit/debit card, 4) financial fraud, 5) tax evasive practices and 6) preference
for cash. Interestingly, debit cards issuance is significantly higher than that of credit cards
and card transactions (volumes) at ATMs far exceed those at PoS machines. The three
most prominent card networks that operate in India are 1) RuPay (owned by NPCI), 2)
Master Card and 3) Visa. Of late, we believe the shift in buying patterns from offline to
online is helping increase the popularity and penetration of cards.
Prepaid instruments: PPIs such as mobile wallets, prepaid cards and paper vouchers
facilitate the quick transfer of electronic funds between peers and/or for purchase of
goods/services. The most popular amongst the three, mobile wallets, was first introduced
in 2008 by Oxigen. Since then, RBI has issued licenses to a host of companies such as
specialised wallet operators, banks, NBFCs and ecommerce companies to operate their
own mobile wallets. However, due to immense competition, growing user preference for
UPI and concentrated funding support for a few, many wallet owners have either
surrendered their license to the RBI or have opted for the M&A route. Currently, Paytm,
Mobikwik, Freecharge, HDFC PayZapp, ICICI Pockets, and PhonePe, are some of the most
prominently used mobile wallets in the country.
UPI - fast payments: Just like IMPS, UPI enables immediate bank to bank transfer
24*7*365 and was introduced by NPCI in Aug’16. However, the pay mode is much
simpler and easy to use as it does not require too many payee details; offers additional
use cases such as ‘make collect requests’, ‘immediate merchant payments’ online as well
as offline and ‘utility and other bill payments’. Today, UPI is the most popular digital
payment services in India today, in volume terms. The service not only helps manage
several bank accounts through a simple mobile application but can also be offered
payment applications such as Google Pay, PhonePe, and Paytm, among others. The
service which is offered by 141 banks, as of Sep’19, crossed 1 billion monthly digital
payments in Oct’19.
JM Financial Institutional Securities Limited Page 14Internet 6 November 2019
Business economics for digital payments enablers
We spoke and met in person with several industry experts (payment aggregators, banks,
wallet companies, etc.) to understand the business economics for different types of digital
payments enablers. Based on these discussions, we understand that while P2P transactions
have grown substantially over the last few years (especially after the emergence of mobile
wallets and UPI), P2M payments remain the key driver for these companies to build a scalable
and sustainable business over the long run. This is primarily because P2M payments are
relatively less sensitive to transaction costs as compared to P2P payments. We thus restrict our
discussion to P2M transactions in this section.
A merchant incurs a wide range of fixed, variable and optional costs while accepting
payments in the digital form. While the fixed costs include a one-time set-up fee and
annual/monthly maintenance charges paid to the payment gateway or a POS supplier, the
variable cost, merchant discount rate (MDR), is deducted by the merchant’s bank (acquiring
bank) before settling the payment in the merchant account. The MDR is the most important
factor in the digital payments ecosystem and is shared between up to four major digital
payments enabling players (acquirer bank, issuer bank, payment gateway and the
scheme/network) depending on the pay-mode used by the merchant’s customer. The
optional costs depend on value-added services such as fraud detection, EMI, pay later,
website creation and maintenance, among others, availed by the merchant from the payment
gateway.
Exhibit 32. Fixed costs and binding commitments for merchants
Payment gateway PoS Solutions Quick Response Code (QR)
Setup fees INR 10,000 - 25,000 INR 5,000 - 15,000 Generally Nil
Annual maintenance charges INR 5,000 - 20,000 INR 3,000 - 5,000 Generally Nil
Minimum commitment Generally required Generally required Not required
Source: Company websites, Industry experts, JMFL
Exhibit 33. MDR pricing for merchants varies from one pay-mode to another
Per transaction charge for
Payment mode Comments, if any
merchants
Significantly higher charges for Amex
Credit cards ~2%
and international cards
Mobile wallets ~2%
Can also be a fixed amount per
Net banking ~2%
transaction
Debit cards/UPI: INR 2,000 per transaction 0.3% NPCI mandated, max. INR 100
Source: RBI, NPCI, Media reports, Company Websites, JMFL
Exhibit 34. An illustrative example of how payments costs impact merchant payments
Description All numbers are in INR
Purchase value of customer through credit card 1,000
Payment gateway charges (2% of transaction value) 20
Tax on payment gateway charges (18% GST) 3.6
Net payment received by merchant 976.4
Source: Company websites, Industry experts, JMFL
MDR pricing for merchants
For credit cards, the MDR is finalised by the acquiring bank/payment gateway after taking in
to account the interchange fees (issuer commissions) and scheme fees (VISA/Master/NPCI).
On the other hand, MDR is fixed by the RBI and NPCI for debit cards and UPI, respectively, in
JM Financial Institutional Securities Limited Page 15Internet 6 November 2019 order to encourage digital payment acceptance by merchants. In fact, in certain cases (transaction value is INR 2,000 0.60% 150 QR Any 0.50% 150 BHIM UPI Acquiring mode Transaction (INR) MDR Max. MDR per transaction (INR) QR/eCom Any 0.30% 100 QR < INR 100 0% Zero Source: NPCI, JMFL We believe the continuing rationalisation of MDR by RBI/NPCI should help digital adoption by new businesses, especially by those which are unorganized and hereto were completely out of the digital loop. JM Financial Institutional Securities Limited Page 16
Internet                                                                                                                                                                          6 November 2019

Future of digital payments: Key themes
     -      Evolving use-cases in digital payments
     -      Positioning of payment gateway aggregators
     -      PoS deployment – government’s digital agenda driving penetration…
     -      … and will result in cards driving offline digital transactions
     -      UPI to lead the growth in online digital payments market
     -      Will wallets be able to survive the onslaught of UPI?

Evolving use-cases in digital payments
In this section, we discuss the wide range of use cases that have already been aiding and/or
have the potential to aid growth in the digital payments industry going forward. We believe
the early adoption of P2M digital payments – especially for the online channel – was driven
by the travel industry, which simplified customers’ ticket booking experiences and accepted
payments through cards or net banking in the early years and later on through UPI and
mobile wallets. The next leg of adoption was led by e-commerce, movie ticketing and mobile
recharge/bill payment companies, which led to a substantial increase in online payment
volumes, especially in smaller cities and towns. The latest adoption is driven by online food
delivery and cab aggregators. Consequently, while digital payment volumes have continued
to soar, we believe a large number of use-cases are still nascent in terms of digital payments.
These use-cases include utility payments, financial products/investments (loans, insurance,
mutual funds, etc.), education related payments (course/exam fees), toll payments, B2B/G2B
money transfers and health/medical services payments.

Offline digital payments were primarily driven by large retail outlets, hotels and restaurants in
the initial years. Since then, the advent of mobile wallets and UPI has led to a significant
surge in payment acceptance across offline merchants especially the mid-level businesses
across industries in the urban areas. We believe the next leg of offline digital adoption will be
led by small ticket payments (INR 50 to INR 2,000) to small and micro merchants (such as
small grocery retailers, vegetable vendors, etc.) and professionals and service providers (such
as barbers, auto drivers, doctors, lawyers, etc.). This mammoth market has significant under-
penetration in digital adoption, even in large cities.

 Exhibit 40. Peer to Merchant (P2M) Online Transactions Share (FY19)                               Exhibit 41. Preferred payment modes: P2M Online Transactions
                                                                                                                                           Wallets     Others
                                                                                                                                            2%          1%
                    Others
                     25%
                                                                               Travel
                                                                               42%
                                                                                                            Net Banking
                                                                                                               24%                                                                Cards
                                                                                                                                                                                  56%

           E-commerce
               16%

                                                                                                                               UPI
                                                                                                                              17%
                                          Utilities
                                           17%
 Source: Razorpay, JMFL. Note: These numbers pertain only to online transactions taking place on   Source: Razorpay, JMFL. Note: These numbers pertain only to online transactions taking place on
 Razorpay’s platforms.                                                                             Razorpay’s platforms.

JM Financial Institutional Securities Limited                                                                                                                                                 Page 17
Internet 6 November 2019 Exhibit 42. Penetration of digital P2M payments across categories (High / Medium / Low) Source: JM Financial Note: We believe the next leg of growth will come from areas where penetration is medium-low Positioning of payment gateway aggregators Payment gateways are facilitators of multiple payment options and are responsible entities for dispute resolution between merchants and consumers. In a way, they act as trust partners for both parties and hence an essential intermediary in the value chain. Our discussions with payment gateway operators indicated that apart from the above-mentioned basic service, payment gateway aggregators are providing value-added services such as transaction management and reconciliation. Some aggregators provide detailed information of consumer behaviour and analytics, which can be developed into business insights for merchant partners. While some payment aggregators are sticking to basic unit economics, some are taking cash burn as a method to acquire more merchant partners. We believe payment gateway aggregators may see a temporary period of lower margins due to stiff competition and initial UPI benefits, but they will continue to form an integral part of the digital payments value chain, while facilitating smooth transactions across various payment modes and entities. A future payment gateway aggregator may provide a lot more value-added services to its merchant/bank partners. POS deployment – government’s digital agenda driving penetration Although RBI data indicates a significant increase in the adoption of debit/credit cards in the country over the last few years, it also points to a few slightly worrying statistics – their primary usage is for cash withdrawals at ATM machines. ATMs still continue to report a significant share of card use (62% and 74% in volume and value terms, respectively) versus PoS machines. Moreover, debit cards that account for 94% of total issued cards (as of Aug’20), are twice as likely to be used to withdraw cash from an ATM (11 times in FY19) versus a PoS transaction (just 5 times per card in FY19). While there might be a host of reasons for this type of behaviour – including low financial awareness, limited reach of financial institutions, data connectivity issues in hinterlands, habit of accepting cash, trust deficit in non-cash payment modes and tax avoidance – we believe one of the major factors that drives this is the lack of penetration of PoS machines at micro merchant locations, who account for around 90% of the retail sales in the country. As of FY19, only ~5mn PoS machines were deployed across the country (Exhibit 43) despite a total merchant base of around 40 million (media report). Our conversations with various PoS suppliers indicate the inherent costs (setup costs/rentals/MDR) associated with deploying a PoS device is the major deterrence for merchants not accepting card payments. Another likely deterrence is the unlawful passing of a portion/ entire MDR charge by merchants to their customers in case they choose to pay by cards. JM Financial Institutional Securities Limited Page 18
Internet                                                                                                                         6 November 2019

 Exhibit 43. Deployment of PoS terminals in India: Total ~5mn (FY19)       Exhibit 44. PoS deployments by banks in India (mn)
                                                                              5.0
                                                                                                                                      4.4
                 Private                                                      4.5
               companies
                  29%                                                         4.0                                          3.7

                                                                              3.5
                                                                                                                 3.1
                                                                              3.0
                                                                                                        2.5
                                                         Private banks
                                                              48%             2.5

                                                                              2.0
       Foreign banks
                                                                                                1.4
            1%                                                                1.5        1.1
                                                                              1.0

                                                                              0.5
                    Public Sector
                       banks                                                  0.0
                       22%                                                              FY15   FY16    FY17      FY18     FY19      Aug'19

 Source: Media Reports, JMFL                                               Source: RBI, JMFL

As part of its digital initiative, the central government – through Meity – has set an ambitious
target for banks to digitally enable digital payments either through PoS, QR or wallets
(~8.5mn merchant locations in FY20 alone). Simultaneously, the government has made it
mandatory for businesses with a turnover above INR 500mn to offer digital modes of
payment to their customers. The transaction costs arising from all such transactions are likely
to be borne by the banks (media report). This has led to a significant improvement in PoS
deployment trends of banks, with 0.7mn PoS machines deployed in the first five months of
FY20, versus 0.6mn deployed in the entire FY19. Though the numbers look encouraging, we
believe there still exists widespread scope for PoS deployments in the country, especially rural
areas and underdeveloped regions like north-east. However, we do note that the business
models of payment gateway companies might be affected in case they are not adequately
reimbursed for the loss of MDR revenue.

POS penetration to aid higher card transactions
While – in terms of number – active debit cards in India far exceed credit cards (by 16x as of
Aug’19, see exhibit 45), the total number of debit card transactions at POS accounts for
merely 2.5x of credit card transactions. Several payment companies we spoke with attributed
this to a significant proportion of debit cards being issued in tier-2/3/4 cities (as part of the
government’s digital push), where only a limited number of merchants currently accept cards.
Consequently, debit cards until recently were more likely to be used for cash withdrawals
from ATMs rather than at POS terminals. We believe lowering of the MDR ceiling for debit
card transactions by RBI and NPCI (for Rupay), especially for small-ticket purchases (
Internet 6 November 2019
Exhibit 45. As of Aug’19, debit cards accounted for 94% of the Exhibit 46. ATMs continue to report a higher share of card use in
total issued cards in the country India versus POS machines…
90.0% 87.7% 86.3% Volume Share Value Share
Credit Cards (mn) Debit Cards (mn)
85.0% 83.1%
1,000 925 80.5%
861 852 80.0% 78.1%
900
772 76.0%
800 73.5%
662 75.0%
700 71.1%
600 553
70.0%
500 64.5%
400 65.0%
61.5%
300
60.0%
200
100 21 25 30 37 47 52
55.0%
0
FY15 FY16 FY17 FY18 FY19 Aug'19 50.0%
FY15 FY16 FY17 FY18 FY19
Source: RBI, JM Financial
Source: RBI, JMFL
Exhibit 47. …mainly because debit cards are twice as likely to be Exhibit 48. Non-Rupay debit and credit cards attract MDR in the
used at ATMs compared with a POS machine range of 0.9-2%, significantly higher than that for Rupay cards
Credit - PoS Debit - ATM Debit - PoS 0.6%
0.6%
36 37 37 0.6%
40
32 0.6%
35
29 0.6%
30
0.5%
25
0.5%
0.5%
20 0.5%
13 12
15 11 10 11 0.5%
10 0.5%
3 4 5
5 1 2 0.4%
Rupay (PoS/Ecom) debit card Rupay (QR) debit card
0
FY15 FY16 FY17 FY18 FY19 Transaction: > INR 2,000 Any Transaction
Source: RBI, JMFL Source: NPCI, Media reports, JMFL
RuPay cards driving penetration and use, especially in lower-tier cities - ‘RuPay’ which derives
its name from ‘Rupee’ and ‘Payments’ is a comparatively low-cost rupee-based payment
network introduced by the NPCI in Mar’12 as an alternative to global giants Master and Visa.
Backed by the government’s digital push that includes the financial inclusion programme
launched in 2014 and several promotional campaigns, RuPay cards (debit/card) have seen a
significant rise in use across India. Today, RuPay cards are widely accepted across the country
with around 1,100 international, regional and local banks issuing them; they hold ~60%
share of the total 972 million cards issued in India as of Mar’19 (please refer to Exhibit 49).
This is primarily due to their inherent attributes such as low transaction costs (since the
settlement happens in India itself) and interoperability between various payment channels
and products. Moreover, RuPay cards are increasingly gaining popularity in Tier 2/3 towns
and cities in India (media report). Internationally too, these cards are accepted by merchants
accepting Discover, Diners Card, JCB and UnionPay due to their partnership arrangements
with the network.
Accordingly, RuPay card use at PoS in India posted a CAGR of 83% and 100% in value and
volume terms, respectively, over the last two years, far exceeding industry growth rates of
35% and 18%. It now commands a share of 19.6% and 11.7% in value and volume terms,
respectively. On the other hand, global card network leaders Mastercard and Visa are likely
losing market share in India and facing data localisation issues (media report).
JM Financial Institutional Securities Limited Page 20Internet 6 November 2019
Exhibit 49. As of Mar’19, RuPay accounted for ~60% of the total Exhibit 50. Its share in digital transactions (both value and volume)
issued cards in India continues to rise YoY despite being a late entrant
19.6%
RuPay Others 20.0%
Volume - Share Value - Share
18.2%
18.0%
16.0%
14.1%
14.0%
40% 11.7%
12.0%
9.8%
10.0%
8.1%
8.0% 7.1%
60% 6.0% 5.3%
4.0%
1.8%
2.0% 0.4% 0.4% 1.3%
0.0%
FY15 FY16 FY17 FY18 FY19 5MFY20
Source: Media Reports, JM Financial. Note 1: As of Mar’19, a total of 586 million Rupay cards were Source: JM Financial
issued as per RBI.
UPI to lead growth in online digital payments market
UPI now a market leader in volume terms - Since its launch in 2016, UPI has been one of the
biggest contributors to digital transactions in the country. The payment mode - which crossed
1 billion monthly transactions in Oct’19 (media report) – now accounts for the highest
volume share (32% in 5MFY20) among digital payment methods (in data reported by the
RBI/NPCI). Some contributing factors to the success of UPI have been Demonetization,
mobile-first approach, instant bank-bank fund transfers, subsidy on transaction costs,
growing penetration of mobile phones as well as Internet connectivity and early adoption by
a host of fintech start-ups (Google Pay, PhonePe, Paytm, etc.).
The phenomenal increase in UPI volumes can also be attributed to a significant increase in
P2M use cases such as bill payments, subscriptions, micro-payments (such as kirana shops)
and B2B payments, with the help of the low-cost QR technology.
Other factors that we believe are contributing to this growth are an increase in the number
of banks offering UPI, the improving success rate of attempted transactions and the growing
popularity of UPI payments in Tier 2/3 cities.
Exhibit 51. In volume terms, UPI now accounts for 32% of total Exhibit 52. … of small ticket P2P payments, Razorpay data indicates
digital transactions in the country. While this may be due high… UPI is now also a preferred mode for P2M payments
UPI Cards @ POS PPIs NACH NEFT IMPS RTGS (Customer)
Cards UPI Others
1.1% 0.8% 0.6% 0.5%
100%
5.2% 6.9% 7.5% 7.4% 100%
90% 13%
9.9% 8.5% 90% 24%
16.6% 13.2%
80% 31%
11.9% 80%
13.0% 2%
70% 17.1% 70%
21.2%
16.3% 45%
60% 19.7% 60% 14%
50% 23.5% 50%
20.1% 23.5%
40% 40%
26.4% 74%
30% 30%
55%
20% 32.3% 20% 43%
35.7% 32.0%
10% 22.9% 10%
0.2% 6.2%
0% 0%
FY17 FY18 FY19 5MFY20 Jan'18 Dec'18 Sep'19
Source: RBI, NPCI, JM Financial Source: Razorpay, JMFL. Note: These numbers pertain only to online transactions taking place on
Razorpay’s platforms
JM Financial Institutional Securities Limited Page 21Internet 6 November 2019
Exhibit 53. Improving success rate of UPI Payments Exhibit 54. Continuous rise in the number of banks live on UPI
150 141
Success rate Declined - tech. issues
Declined - human errors Declined - tech./human issue
100% 130
10% 10% 114
90% 18%
2%
80% 3.5% 110
70%
90
60%
50%
87% 90% 70
40% 78% 55
30% 50
20%
10% 30 21
0%
Apr'18 Mar'19 10
UPI Cards Aug'16 Aug'17 Aug'18 Aug'19
Source: Media Report, JM Financial Source: NPCI, JM Financial
Exhibit 55. UPI payments penetrating in tier-2/3 cities as well
Tier 1 Tier 2/3
1%
100%
13%
90%
80% 36%
70%
60%
50% 99%
87%
40%
30% 64%
20%
10%
0%
Jan'18 Dec'18 Sep'19
Source: Razorpay, JMFL. Note: These numbers pertain only to online transactions taking place on Razorpay’s platforms
UPI adoption initially led by P2P payments, more recently by P2M payments - UPI was
previously promoted as primarily an instant bank transfer mechanism by NPCI, banks and app
owners; it was mobile-based, convenient, more secure and faster than traditional payment
modes (cash as well as digital modes such NEFT/IMPS). This particular use case became
extremely popular among early adopters of UPI, especially for P2P payments, after the
announcement of Demonetization in Nov’16, waiver of transfer charges by the government
on payments worth less than INR 1,000 and the substantial incentives (rewards/cash backs)
offered by third-party app owners such as Google Pay (Tez).
On the other hand, the adoption of P2M payments was slower owing to lack of
infrastructure penetration (such as QR codes), merchant reluctance due to fear of fraud, lack
of knowledge and incentives, the habit of accepting cash and the belief that cash in hand is
more fungible. To overcome some of these challenges, the government incentivised UPI
acceptance by merchants by waving MDR costs for transactions up to INR 2,000 starting
Jan’18 for two years (these costs were then to be reimbursed by the government to banks
and other players). Fintech companies too seem to have realised the immense revenue
potential in P2M payments mechanisms offered, especially the opportunity to earn
commissions through partner banks and leverage the merchant payment collections data to
cross-sell and up-sell their/partner company’s products and services. Accordingly, they now
seem to aggressively acquire small and micro merchants on their own platforms.
Consequently, there has been a significant increase in the number of merchants accepting
payments through UPI, especially through the QR code mechanism.
JM Financial Institutional Securities Limited Page 22Internet 6 November 2019
Exhibit 56. Offline merchants on-boarded by UPI players - latest Exhibit 57. UPI-based P2M payments - market share (May’19)
14 13 Offline merchants (million)
12
Others Paytm
10 42% 58%
8 7.2
6
4
2 1.45
0.4 0.2
0
Paytm PhonePe BharatPe Mswipe Google Pay
Source: Media Reports, JMFL. Source: Media Report, JM Financial. Note: Competitors of Paytm dispute these numbers.
Note 1: Merchants are not necessarily exclusive.
Note 2: Our interaction with industry players indicate around 50% of the total reported merchants are
generally inactive.
UPI P2M payments - A more value-based proposition for fintech companies - As discussed in
the previous section, the initial wave of UPI adoption was led by P2P transfers, but the recent
surge is driven by a substantial jump in online as well as offline P2M use cases. UPI facilitators
(fintech apps) – which were earlier focused on increasing their subscriber base and collecting
their transaction data through promotional campaigns – have now started aggressively
investing in developing new use cases such as bill payments, subscriptions, micro-payments
(such as kirana shops) and B2B payments, with the help of the low-cost QR technology. A
further push has come from the RBI’s Oct’18 directive on interoperability across prepaid
instruments; this has eased the offline payments process at merchant locations.
Moreover, fintech companies are now also experimenting with UPI-based value-added
products for merchants. BharatPe – a recent entrant in the UPI payments space – offers small-
ticket and/or small-duration loans to micro merchants by gauging their repayment ability
based on transaction data collected by its QR codes. It is also now creating other merchant-
specific use cases such as business insurance. We believe the value proposition created by
such services is important for these merchants, who generally have limited access to
traditional financial services to expand/secure their business, even if they are operationally
stable.
NPCI considering capping the market share of apps and banks within the UPI ecosystem
At the time of UPI’s inception in 2016, there were only around 15 apps that offered its
payment interface. Today, there are more than 100 apps (owned by third-party fintech
companies/ banks) that have enabled the UPI payment interface. While individual market
share details are not reported officially, a media report indicates that large-pocketed players
such as Google Pay, PhonePe and Paytm together account for 89-90% of total UPI
transactions in both volume and value terms. We believe this is because third-party app
owners have been continuously running promotional campaigns, have an advanced user
interface and offer a wide range of use cases (such as mobile/utility payments).
Along similar lines, while there were 141 banks live on the UPI network as of Aug’19, only a
few a banks such as Yes Bank, Paytm Payments Bank, SBI Bank, ICICI Bank, HDFC Bank and
Axis Bank process a major chunk of the payments (media report). One of the primary reasons
for this concentration is that the leading third-party payment apps work with only a few
banking partners (1-4 each).
To avoid the UPI payments ecosystem being dominated by a few app owners and banks, the
NPCI is considering capping the maximum share that each player can hold to 33%. However,
we note that the exact details on the implementation of such a cap have not been finalised
(media report).
JM Financial Institutional Securities Limited Page 23Internet 6 November 2019
Will wallets be able to survive the UPI onslaught?
After Paytm tied up with Uber, the use-case of mobile wallets as a payments mechanism
started becoming accepted/popular across the country. This success – however small – led to
an industry-wide belief that the wallet-based payments business had wide scope to grow,
with numerous opportunities across other industries such as utility/mobile bill payments,
ticket bookings, e-commerce, financial services, etc. Sensing a lucrative business opportunity,
several wallets started business over the next few years. The popularity of wallet-based
payments grew further due to an exponential growth in the number of smartphone/Internet
users over the next few years as well as the cash crunch during Demonetization.
The launch and growing acceptance of UPI has changed the payments business drastically
over the last 2-3 years. UPI allows real-time payments with inter-operability across multiple
bank accounts and without the need to share/enter bank account details. It also overcomes
one of the biggest drawbacks of mobile wallets which is, no interest is earned by account
owner on the stored value of money. Wallet companies also charge a transaction fee in case
the owner of the wallet transfers money from wallet to bank account, which makes wallet
money less fungible. On the other hand, in UPI transactions, the transaction amount is
directly transferred from one bank to another, meaning the value transferred continues to
earn interest either for the transferor/transferee. Moreover, cash in bank is more fungible
than mobile wallets that even today have limited use cases. These attributes make convincing
people, especially small merchants, to accept payments through UPI easier. Consequently,
while UPI has already crossed 1 billion monthly transactions (media report), wallet
transactions are still stagnating (at ~400 million as per the RBI data reported over the past 6
months). That said, even today, several people are not comfortable linking their bank
accounts with UPI and continue to prefer wallets for convenience, according to Vijay Shekhar
Sharma (Paytm founder). While we believe UPI will continue to cannibalise mobile wallet
transactions, it remains to be seen how large wallet companies – especially Paytm – adopt to
this change.
Exhibit 58. Monthly UPI transactions now significantly exceed … Exhibit 59. …. mobile wallets both in volume as well as value terms
UPI transactions (million) Wallet transactions (million) UPI transactions (INR bn) Wallet transactions (INR bn)
1000
1,500
900
800 1,300
700 1,100
600 900
500 700
400 500
300 300
200 100
Jul-18
Aug-18
Sep-18
Apr-19
Jul-19
Jan-19
Aug-19
Dec-18
May-19
Jun-18
Jun-19
Nov-18
Oct-18
Feb-19
Mar-19
Jul-18
Aug-18
Sep-18
Apr-19
Jul-19
Aug-19
Jan-19
Dec-18
May-19
Jun-18
Jun-19
Nov-18
Oct-18
Feb-19
Mar-19
Source: RBI, NPCI, JMFL Source: RBI, NPCI, JMFL
Exhibit 60. Popularity of UPI over wallets continues to increase for... Exhibit 61. …P2M payments as well as P2P payments
FY18 FY19 17.0% FY18 FY19
18.0% 25%
22.0%
16.0%
14.0% 20%
12.0%
15%
10.0%
8.0% 6.3% 10%
6.0% 6%
4.0% 4.0%
1.9% 5%
1.6% 1.5%
2.0%
0.0% 0%
Wallets UPI Wallets UPI
Source: Razorpay, JMFL. Note: These numbers pertain only to online transactions taking place on Source: Razorpay, JMFL. Note: These numbers pertain only to online transactions taking place on
Razorpay’s platforms. Razorpay’s platforms.
JM Financial Institutional Securities Limited Page 24You can also read