Digital Pathology During the COVID-19 Outbreak in Italy: Survey Study
←
→
Page content transcription
If your browser does not render page correctly, please read the page content below
JOURNAL OF MEDICAL INTERNET RESEARCH                                                                                                  Giaretto et al

     Original Paper

     Digital Pathology During the COVID-19 Outbreak in Italy: Survey
     Study

     Simone Giaretto1*, MD; Salvatore Lorenzo Renne1,2*, MD; Daoud Rahal2, MD; Paola Bossi2, MD; Piergiuseppe
     Colombo2, MD; Paola Spaggiari2, MD; Sofia Manara2, MD; Mauro Sollai2, MD; Barbara Fiamengo2, MD; Tatiana
     Brambilla2, MD; Bethania Fernandes2, MD; Stefania Rao2, MD; Abubaker Elamin1, MD; Marina Valeri1,2, MD;
     Camilla De Carlo1,2; Vincenzo Belsito1,2, MD; Cesare Lancellotti1,2, MD; Miriam Cieri2, MD; Angelo Cagini2, MD;
     Luigi Terracciano1,2, MD; Massimo Roncalli1,2, MD, PhD; Luca Di Tommaso1,2, MD
     1
      Department of Biomedical Sciences, Humanitas University, Pieve Emanuele (MI), Italy
     2
      Department of Pathology, Humanitas Clinical and Research Center – IRCCS, Rozzano (MI), Italy
     *
      these authors contributed equally

     Corresponding Author:
     Salvatore Lorenzo Renne, MD
     Department of Pathology
     Humanitas Clinical and Research Center – IRCCS
     via Manzoni 56
     Rozzano (MI), 20089
     Italy
     Phone: 39 0282244787
     Email: salvatore.renne@hunimed.eu

     Abstract
     Background: Transition to digital pathology usually takes months or years to be completed. We were familiarizing ourselves
     with digital pathology solutions at the time when the COVID-19 outbreak forced us to embark on an abrupt transition to digital
     pathology.
     Objective: The aim of this study was to quantitatively describe how the abrupt transition to digital pathology might affect the
     quality of diagnoses, model possible causes by probabilistic modeling, and qualitatively gauge the perception of this abrupt
     transition.
     Methods: A total of 17 pathologists and residents participated in this study; these participants reviewed 25 additional test cases
     from the archives and completed a final psychologic survey. For each case, participants performed several different diagnostic
     tasks, and their results were recorded and compared with the original diagnoses performed using the gold standard method (ie,
     conventional microscopy). We performed Bayesian data analysis with probabilistic modeling.
     Results: The overall analysis, comprising 1345 different items, resulted in a 9% (117/1345) error rate in using digital slides.
     The task of differentiating a neoplastic process from a nonneoplastic one accounted for an error rate of 10.7% (42/392), whereas
     the distinction of a malignant process from a benign one accounted for an error rate of 4.2% (11/258). Apart from residents, senior
     pathologists generated most discrepancies (7.9%, 13/164). Our model showed that these differences among career levels persisted
     even after adjusting for other factors.
     Conclusions: Our findings are in line with previous findings, emphasizing that the duration of transition (ie, lengthy or abrupt)
     might not influence the diagnostic performance. Moreover, our findings highlight that senior pathologists may be limited by a
     digital gap, which may negatively affect their performance with digital pathology. These results can guide the process of digital
     transition in the field of pathology.

     (J Med Internet Res 2021;23(2):e24266) doi: 10.2196/24266

     KEYWORDS
     COVID19; digital pathology; Bayesian data analysis; probabilistic modeling

     https://www.jmir.org/2021/2/e24266                                                              J Med Internet Res 2021 | vol. 23 | iss. 2 | e24266 | p. 1
                                                                                                                   (page number not for citation purposes)
XSL• FO
RenderX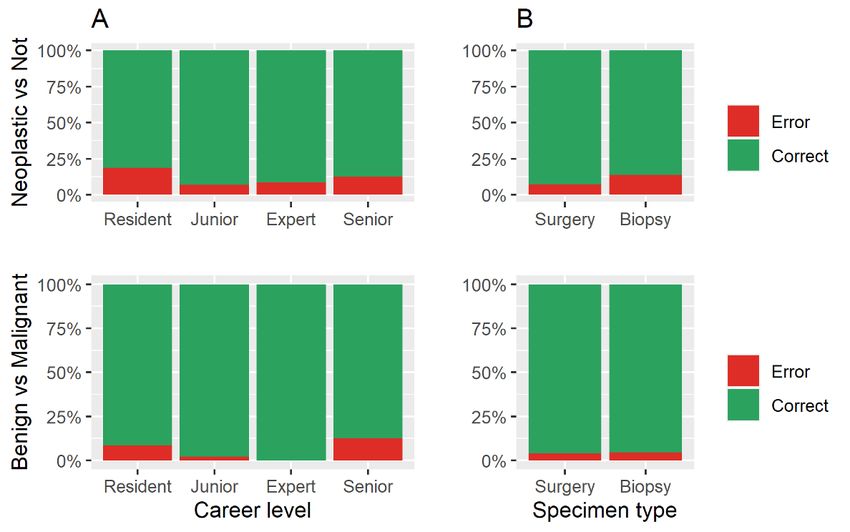
JOURNAL OF MEDICAL INTERNET RESEARCH                                                                                                 Giaretto et al

                                                                           questions were examined (ie, 85 questions per participant) in
     Introduction                                                          the study.
     Digital pathology (DP) intends to use computer workstations           Study Design
     and digital whole slide imaging to diagnose a pathological
                                                                           In addition to their own diagnostic tasks, which were not
     process [1-4]. A complete transition from classical to digital
                                                                           considered in this study, the pathologists and residents received
     pathology is usually a “soft” procedure, taking months or even
                                                                           (1) a set of digital cases within the area of general surgical
     years to be completed [4-9]. We planned a digitalization of our
                                                                           pathology, (2) specific questions to be addressed while
     department, and we were testing several technical aspects related
                                                                           reviewing the cases, and (3) a survey about their digital
     to digital transition. By February 2020, most of our staff
                                                                           experience.
     pathologists and residents had used digital whole slide imaging
     for educational or scientific purposes, but the situation radically   Sets of Digital Cases
     changed in March 2020. With the COVID-19 pandemic and the             We set up 5 sets of digital cases representing 3 different
     subsequent guidelines adopted by the Italian national                 specialties (breast: n=2; urology: n=1; and gastrointestinal: n=2)
     government and the medical direction of our hospital, we were         and assigned them to each study participant. Each test comprised
     forced to reduce the presence of staff in the laboratory. Taking      5 cases, represented by one or more slides of a single case that
     advantage of the ongoing digitalization, we decided to adopt          was previously diagnosed using conventional microscopy by
     DP to sustain smart work.                                             the referral pathologist at our institution. The information
     Most of the reported discordances between diagnoses in DP             reported about the original diagnosis was considered as the gold
     and those by the gold standard (ie, evaluation of a glass slide       standard. To cover a spectrum of conditions overlapping the
     under a microscope) are less than 10% [10], and none of these         routine situation, we considered biopsy and surgical specimens
     reports were made under an abrupt transition in diagnostic            (specimen type). Cases were digitalized using the Aperio AT2
     approach. These discrepancies could be attributed to several          scanner (Leica Biosystems) and visualized using the WebViewer
     factors that could be pathologist dependent (eg, career level or      APERIO ImageScope (version 12.1). The slides used for the
     individual performance) or pathologist independent (eg,               tests were from 8 nontumoral and 17 tumoral cases. Of the
     specimen type or the task to be undertaken during the diagnostic      tumoral cases, 7 tumors were benign and 10 were malignant;
     procedure). Discerning the relative effect of these features (that    all malignant tumors were infiltrative and equally distributed
     could be really small)—even in a carefully designed                   between grade 2 and grade 3; 14 cases were biopsy and 11 were
     experimental setting—might be challenging. Probabilistic              surgical.
     modeling (and Bayesian data analysis, in general) allows the
                                                                           Study Questionnaire
     detection of small effects [11-13]. Moreover, the employment
     of multilevel hierarchical modeling permits the transfer of shared    Participants answered (all or some) of the following questions
     information among data clusters, resulting in balanced                (ie, categories of diagnostic task), for each case: (1) Is it
     regularization; thus, it reduces overfitting and improves the         neoplastic or negative for neoplasia? (2) Is it a malignant (in
     out-of-sample predictive performance [11,14-18].                      situ or infiltrative) or a benign neoplasia? (3) What is the
                                                                           histopathological diagnosis? (4) What is the histotype of the
     In this study, we aimed to (1) quantitatively describe how abrupt     lesion? (5) What is the grade of the lesion? Questions 1 and 3
     transition to DP might affect the quality of diagnosis, (2) model     were answered for all cases, question 2 was answered only for
     the possible causes via probabilistic modeling, and (3)               neoplastic lesions, and questions 4 and 5 were answered for
     qualitatively gauge the perception of this abrupt transition.         malignant neoplasms.

     Methods                                                               Statistical Analysis
                                                                           To model data clusters, we used a varying effects, multilevel
     A detailed description of the study methods is described in           (hierarchical) model [14-16]. The rate of wrong answers (Wi)
     Multimedia Appendix 1 [15,16,19-24].                                  was modeled as a Bernoulli distribution:
     Ethics Approval                                                            Wi ∼ Binomial ( 1, pi )
     No ethics approval was required for this study. The study
                                                                           For each pathologist (PID), their career level (LEVEL), the
     participants (ie, pathologists and residents) agreed to—and
                                                                           specific diagnostic question (CATEGORY), the specimen type
     coauthored—the study.
                                                                           (SPECIMEN), and the subspecialty of the case (SPECIALTY),
     Study Participants                                                    we used the logit link function and modeled the varying
                                                                           intercepts as follows:
     This study involved 17 participants who were divided into the
     following 4 groups or career levels, based on their pathology
     experience: (1) senior (pathologists with >20 years of
     experience, n=2), (2) expert (pathologists with 10-20 years of
     experience, n=5), (3) junior (pathologists with
JOURNAL OF MEDICAL INTERNET RESEARCH                                                                                             Giaretto et al

           βj ∼ Normal ( 0 , σβ ), for j = 1..4                        for all the pathologists, covering 3 fields: (1) attitude towards
           γj ∼ Normal ( 0 , σγ ), for j = 1..5                        DP, (2) confidence in using DP solutions, and (3) satisfaction
                                                                       with DP. The survey was sent at the end of the digital
           δj ∼ Normal ( 0 , σδ ), for j = 1..2                        experience. Pathologists were requested to answer the questions
           εj ∼ Normal ( 0 , σε ), for j = 1..3                        using a Likert scale, with scores ranging from 1 (strongly
                                                                       disagree) to 5 (strongly agree). The results were reported as the
           σβ ∼ Exponential ( 1 )
                                                                       proportion of pathologists who assigned each single value of
           σγ ∼ Exponential ( 1 )                                      the Likert scale.
           σδ ∼ Exponential ( 1 )
                                                                       Results
           σε ∼ Exponential ( 1 )
     The hyperpriors for the hyperparameters average pathologist       Quantitative Description
             and σα were set as follows:                               The pathologists answered 1345 of the total 1445 questions
                                                                       (100 missing answers in total), of which 1228 (91.30%)
              ∼ Normal ( 0, 1.5 )                                      corresponded to the original diagnoses and were considered
                                                                       correct. Table 1 depicts the errors among each group of the 5
           σα ∼ Exponential ( 1 )                                      different categories recorded, and Figure 1 highlights the median
                                                                       (IQR) values of those categories. Considerable variation was
     The SD value for        was set at 1.5 since it produces a flat
                                                                       observed among the performances of each pathologist, ranging
     (weakly regularizing) prior after logit transformation [16,18];
                                                                       from an error rate of 0.01 (1/67, Pathologist #4) to 0.32 (26/81,
     moreover, we used an exponential distribution to model SD,
                                                                       Pathologist #13), with a collective median error of 0.07 (IQR
     because this assumes the least, for maximum entropy reasons
                                                                       0.04-0.11). This performance variation was tapered once the
     [16,25-28], given the fact that σ is a nonnegative continuous
                                                                       same data were considered after filtering among the different
     parameter. To assess the validity of priors, we run prior
                                                                       career levels, yielding the same median of 0.07, but a narrower
     predictive simulation of the model [16,29,30] (see Table S1 in
                                                                       IQR of 0.07-0.10. Moreover, some diagnostic tasks were more
     Multimedia Appendix 1, and Multimedia Appendices 2 and 3).
                                                                       error prone than others; for instance, histotyping of the lesions
     To limit divergent transitions, we reparametrized the models
                                                                       had a very low rate of errors 0.01 (2/160), whereas grading was
     with a noncentered equivalent form [31,32]. Models were fit
                                                                       a more error-prone task with an error rate of 0.18 (27/147). The
     using Stan (a probabilistic programming language) and R
                                                                       specimen type also resulted in different error rates, with surgical
     [33,34]. Full anonymized data and custom code can be found
                                                                       specimens easier to diagnose, with an error rate of 0.06 (40/716),
     in the public repository SmartCovid hosted on Github [35].
                                                                       than biopsy specimens, with a 2-fold error rate at 0.12 (77/629).
     Study Survey
     The survey was inspired by previous published works [36-38].
     Briefly, the survey included 17 questions in a randomized order

     https://www.jmir.org/2021/2/e24266                                                         J Med Internet Res 2021 | vol. 23 | iss. 2 | e24266 | p. 3
                                                                                                              (page number not for citation purposes)
XSL• FO
RenderX
JOURNAL OF MEDICAL INTERNET RESEARCH Giaretto et al
Table 1. Proportion of errors among different groups.
Group Number of tasks performed Number of errors Error rate
Pathologist ID
P1 84 5 0.06
P2 78 4 0.05
P3 82 7 0.09
P4 67 1 0.01
P5 82 7 0.09
P6 82 6 0.07
P7 83 2 0.02
P8 84 3 0.04
P9 82 5 0.06
P10 83 3 0.04
P11 82 9 0.11
P12 83 3 0.04
P13 81 26 0.32
P14 64 9 0.14
P15 84 12 0.14
P16 79 9 0.11
P17 65 6 0.09
Career level
Resident 310 47 0.15
Junior 460 30 0.07
Expert 411 27 0.07
Senior 164 13 0.08
Category of the diagnostic task
Neoplasia? 392 42 0.11
Malignant/benign? 258 11 0.04
Histopathological diagnosis? 388 35 0.09
Histotype? 160 2 0.01
Grade? 147 27 0.18
Specimen type
Surgery 716 40 0.06
Biopsy 629 77 0.12
Case subspecialty
Breast 550 64 0.12
Gastrointestinal 497 40 0.08
Urology 298 13 0.04
Total 1345 117 0.09
https://www.jmir.org/2021/2/e24266 J Med Internet Res 2021 | vol. 23 | iss. 2 | e24266 | p. 4
(page number not for citation purposes)
XSL• FO
RenderXJOURNAL OF MEDICAL INTERNET RESEARCH Giaretto et al
Figure 1. Error rates among different categories. This dot-bar plot depicts the median (IQR) values of error rates among different categories. The error
rates showed the widest IQR among individual pathologists (PID), whereas the least IQR was noted for the career level and the specimen type (biopsy
vs surgical).
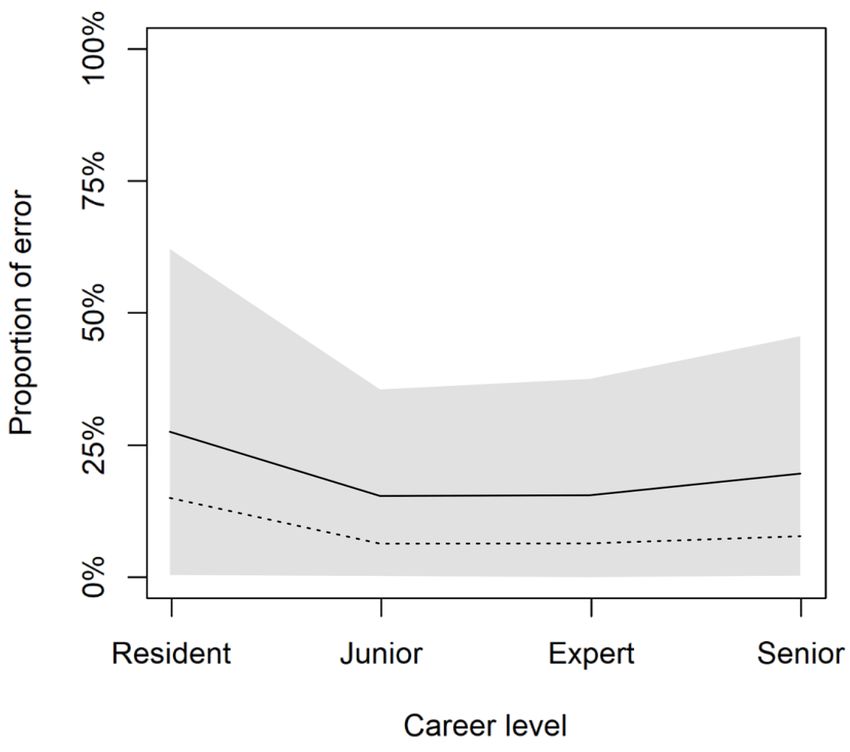
Differences in error rates for two important might be more challenging on a biopsy specimen, the distinction
tasks—differentiation between neoplastic and nonneoplastic between a benign and malignant neoplasm was done with the
processes and that between benign and malignant neoplastic same error rate regardless of the specimen type (Figure 2B).
processes—were observed among pathologists at different career Differences in the prevalence of errors among individual
levels and for different specimen types. The same error profile pathologists and those at different career levels, as well as across
was observed across career levels, although the former task had diagnostic tasks, specimen type, and case subspecialty, are
a higher error rate (Figure 2A). However, even though the further highlighted in Multimedia Appendices 4 and 5.
differentiation of a neoplastic process from a nonneoplastic one
https://www.jmir.org/2021/2/e24266 J Med Internet Res 2021 | vol. 23 | iss. 2 | e24266 | p. 5
(page number not for citation purposes)
XSL• FO
RenderXJOURNAL OF MEDICAL INTERNET RESEARCH Giaretto et al
Figure 2. Raw proportion of errors across (A) career levels and (B) specimen types in performing two important tasks: differentiation between neoplastic
and nonneoplastic processes and between malignant and benign tumors.
Appendix 1). The pathologists’ individual performances and
Prediction of Average Pathologist Performance their career levels were the variables that showed less variance
Diagnostics of the model’s fit are shown in Multimedia in predicting the error rate, whereas the specimen type, case
Appendices 6, 7, and 8. The analysis reported a good overall subspecialty, and the particular type of task collectively showed
performance: the average pathologist showed a negative more variance (Multimedia Appendix 9). Hence, we simulated
mean coefficient of -1.8 with most of the posterior probability the performance of an average pathologist at different career
mass below 0 (given the model structure, positive values reflect levels; this prediction shows better performance among
the probability of making errors; Table S2 in Multimedia pathologists at intermediate career levels of career (Figure 3).
https://www.jmir.org/2021/2/e24266 J Med Internet Res 2021 | vol. 23 | iss. 2 | e24266 | p. 6
(page number not for citation purposes)
XSL• FO
RenderXJOURNAL OF MEDICAL INTERNET RESEARCH Giaretto et al
Figure 3. Prediction of average pathologist performance. Pathologists of intermediate levels of career perform better on average. The graph depicts
the posterior predictive distributions for the multilevel model. Solid lines represent posterior mean values; shaded regions represent 89% high-posterior
density interval; and dashed lines represent raw data.
(56/102, 54.9%). A detailed analysis of these parameters showed
Survey Results that the residents reported the highest value for confidence,
Most pathologists reported a very good score (ie, 4 or 5 junior pathologists reported the highest values for attitude and
indicating they “moderately agree” and “strongly agree,” satisfaction, whereas expert and senior pathologists reported
respectively) for their attitude toward DP (44/68, 64%), relatively lower levels of confidence in and satisfaction with
confidence in DP (75/119, 63%), and satisfaction with DP DP (Figure 4).
https://www.jmir.org/2021/2/e24266 J Med Internet Res 2021 | vol. 23 | iss. 2 | e24266 | p. 7
(page number not for citation purposes)
XSL• FO
RenderXJOURNAL OF MEDICAL INTERNET RESEARCH Giaretto et al
Figure 4. Overview of the psychological aspect of the study. This series of graphs summarize the results of the survey conducted among pathologists
at different career levels (residents, junior, expert, and senior) to evaluate their attitudes toward, confidence in, and satisfaction with digital pathology
solutions.
recorded was consistent with previous reports—a result that
Discussion further supports the transition to DP.
Principal Findings In our study, a high proportion of errors was generated in small
Our study showed an overall discordant rate of 9% among biopsy specimen type (12.2%) and diagnostic tasks involving
diagnoses performed using digital slides and those performed tumor grading (23%). These results are consistent with those
using the gold standard (ie, conventional microscopy). However, of the review by Williams et al [40]. The latter showed that 21%
when we considered the different diagnostic tasks, this rate of all errors concerned grading or histotyping of malignant
dropped to less than 5% in the category “benign versus lesions, whereas 10% of the errors could be ascribed to the
malignant tumor”, which is probably the most clinically inability to find the target.
impacting category among the other diagnostic tasks. A Moreover, recent studies have consistently reported high,
systematic review of 38 pertinent studies published before 2015 intermediate, and low discordant rates for bladder, breast, and
reported a 7.6% overall discordance rate between digital and gastrointestinal tract specimens, respectively [41,42]—a finding
glass slide diagnoses. Among these studies, 17 studies reported suggesting intrinsic difficulties of specific areas. In contrast,
a discordant rate higher than 5%, and 8 reported a discordant we observed 4%, 8%, and 12% of discrepancies for urology,
rate higher than 15% [39]. A later reanalysis of the same series gastrointestinal tract, and breast specimens. This result could
fixed the overall discordance rate to 4% and major discrepancies be attributed to a nonrandom selection of the cases and might
to 1% [40]. A more recent review, covering studies published represent a study limitation, biasing the value of the coefficients
until 2018, reported a disagreement ranging from 1.7% to 13% of specific parameters of the case subspecialty, similar to those
[10]. Two multicentric, randomized, non-inferiority studies of diagnostic tasks and the specimen type. However, these
reported major discordant rates of 4.9% [41] and 3.6% [42] characteristics were excluded in the posterior predictive
between diagnoses done by digital and glass slides. Furthermore, simulation, which was intended to represent how the different
a study from a single, large academic center reported an overall career levels might impact the pathologists’ performance, after
diagnostic equivalency of 99.3% [43]. The same group was also adjusting for all other factors.
the first to report about the use of DP during COVID-19 with
an overall concordance of 98.8% [44]. Thus, despite our As compared by the study by Hanna et al [44], our readiness to
challenging approach to DP, the diagnostic performance we undertake digital diagnostic tasks was far from being mature in
March 2020, and this study was specifically designed to identify
https://www.jmir.org/2021/2/e24266 J Med Internet Res 2021 | vol. 23 | iss. 2 | e24266 | p. 8
(page number not for citation purposes)
XSL• FO
RenderXJOURNAL OF MEDICAL INTERNET RESEARCH Giaretto et al
and illustrate the effects of such a sudden adoption of was malignant, they demonstrated the best performance with
DP—something that had never been investigated before. Our regard to tumor grading. By contrast, residents made several
results suggest that this abrupt transition might not influence errors, likely due to their limited working experience. Lastly,
the adoption of and performance with DP. However, different even if expert pathologists showed a good diagnostic
factors seem to be involved. In particular, data concerning major performance, they had the lowest level of satisfaction in DP.
discrepancies between diagnoses using DP and gold standard This result suggests that DP can be adopted rapidly for practical
methods disclosed an interesting feature. Both in the distinction purposes. However, it also highlights a critical point of the
of neoplastic versus non-neoplastic lesions and of benign versus process that needs to be addressed, possibly with adequate
malignant tumors, the worst results obtained were among training or user-friendly equipment, and warrants further
residents and senior pathologists–2 contrasting categories in investigations.
terms of pathologists’ working experience. Therefore, these
survey results might suggest an explanation to this paradoxical
Conclusions
result: senior pathologists felt ready to diagnose a pathological Our study describes how the abrupt transition to DP affected
process using a digital approach (ie, positive attitude) but were the quality of diagnoses and qualitatively gauged the
less prepared to use digital devices (ie, low confidence). psychological aspects of this abrupt transition. Moreover, our
Residents, in turn, had a high predisposition to using a digital study model highlighted the potential causes for these challenges
device (ie, high confidence) but also had some concerns about and might inform what could be expected in other laboratories.
diagnosis of a pathological process (ie, poor attitude). The In conclusion, the exceptional conditions dictated by the
hypothesis that senior pathologists were limited by a digital gap COVID-19 pandemic highlighted that DP could be adopted
was supported by another finding: once they decided a lesion safely for diagnostic purposes by any skilled pathologist, even
abruptly.
Conflicts of Interest
None declared.
Multimedia Appendix 1
Supplementary materials and methods.
[DOCX File , 47 KB-Multimedia Appendix 1]
Multimedia Appendix 2
Coefficients of model parameters from the prior predictive simulation.
[PNG File , 116 KB-Multimedia Appendix 2]
Multimedia Appendix 3
Simulation from the prior. This figure shows the meaning of the priors (ie, what the model thinks before it sees the data).
[PNG File , 88 KB-Multimedia Appendix 3]
Multimedia Appendix 4
Proportion of errors among individual pathologists. Upper left panel shows the overall error rates. Upper right panel shows the
error rates among different diagnostic tasks. Lower left panel shows the error rate among different specimen types. Lower right
panel highlights the different error rates among different case subspecialties. GI: gastrointestinal, Uro: urology.
[PNG File , 143 KB-Multimedia Appendix 4]
Multimedia Appendix 5
Proportion of errors among different career levels. Upper left panel shows the overall error rates. Upper right panel shows the
error rates among the different diagnostic tasks. Lower left panel shows the error rate among different specimen types. Lower
right panel highlights the different error rates among different case subspecialties. GI: gastrointestinal, Uro: urology.
[PNG File , 128 KB-Multimedia Appendix 5]
Multimedia Appendix 6
Traceplot of the model fit - part A.
[PNG File , 276 KB-Multimedia Appendix 6]
https://www.jmir.org/2021/2/e24266 J Med Internet Res 2021 | vol. 23 | iss. 2 | e24266 | p. 9
(page number not for citation purposes)
XSL• FO
RenderXJOURNAL OF MEDICAL INTERNET RESEARCH Giaretto et al
Multimedia Appendix 7
Traceplot of the model fit - part B.
[PNG File , 267 KB-Multimedia Appendix 7]
Multimedia Appendix 8
Traceplot of the model fit - part C.
[PNG File , 111 KB-Multimedia Appendix 8]
Multimedia Appendix 9
Model coefficients. Graphical representation of the coefficients for the model parameters conditional on the data. The lowest box
depicts the coefficients for the hyper-parameter α¯ (alpha_bar) and the variances – the σ (sigma_a, b, [...] e) – of the categories
of clusters modeled. All other boxes depict the distributions of the mean value for each element of the category considered. From
top to bottom: the first box depicts the parameters of the pathologists’ performance; the second, the parameters regarding the
career level; the third, the diagnostic category analyzed; the fourth, the specimen type; and the fifth, the case subspecialty.
Interpretation of the model at the parameter level is not possible because they combine in a very complicated way: prediction (ie,
see how the model behave on the outcome scale, Figure 4 in the manuscript) is the only practical way to understand what the
model “thinks”.
[PNG File , 116 KB-Multimedia Appendix 9]
References
1. Pantanowitz L, Sharma A, Carter A, Kurc T, Sussman A, Saltz J. Twenty years of digital pathology: an overview of the
road travelled, what is on the horizon, and the emergence of vendor-neutral archives. J Pathol Inform 2018;9:40 [FREE
Full text] [doi: 10.4103/jpi.jpi_69_18] [Medline: 30607307]
2. Griffin J, Treanor D. Digital pathology in clinical use: where are we now and what is holding us back? Histopathology
2017 Jan;70(1):134-145. [doi: 10.1111/his.12993] [Medline: 27960232]
3. Zarella MD, Bowman D, Aeffner F, Farahani N, Xthona A, Absar SF, et al. A practical guide to whole slide imaging: a
white paper from the digital pathology association. Arch Pathol Lab Med 2019 Feb;143(2):222-234. [doi:
10.5858/arpa.2018-0343-ra]
4. Hartman D, Pantanowitz L, McHugh J, Piccoli A, OLeary M, Lauro G. Enterprise implementation of digital pathology:
feasibility, challenges, and opportunities. J Digit Imaging 2017 Oct;30(5):555-560 [FREE Full text] [doi:
10.1007/s10278-017-9946-9] [Medline: 28116576]
5. Williams BJ, Treanor D. Practical guide to training and validation for primary diagnosis with digital pathology. J Clin
Pathol 2020 Jul;73(7):418-422. [doi: 10.1136/jclinpath-2019-206319] [Medline: 31784420]
6. Stathonikos N, Nguyen TQ, Spoto CP, Verdaasdonk MAM, van Diest PJ. Being fully digital: perspective of a Dutch
academic pathology laboratory. Histopathology 2019 Nov;75(5):621-635 [FREE Full text] [doi: 10.1111/his.13953]
[Medline: 31301690]
7. Fraggetta F, Garozzo S, Zannoni G, Pantanowitz L, Rossi E. Routine digital pathology workflow: the Catania experience.
J Pathol Inform 2017;8:51 [FREE Full text] [doi: 10.4103/jpi.jpi_58_17] [Medline: 29416914]
8. Retamero JA, Aneiros-Fernandez J, del Moral RG. Complete digital pathology for routine histopathology diagnosis in a
multicenter hospital network. Arch Pathol Lab Med 2020 Feb;144(2):221-228. [doi: 10.5858/arpa.2018-0541-oa]
9. Thorstenson S, Molin J, Lundström C. Implementation of large-scale routine diagnostics using whole slide imaging in
Sweden: Digital pathology experiences 2006-2013. J Pathol Inform 2014;5(1):14 [FREE Full text] [doi:
10.4103/2153-3539.129452] [Medline: 24843825]
10. Araújo ALD, Arboleda LPA, Palmier NR, Fonsêca JM, de Pauli Paglioni M, Gomes-Silva W, et al. The performance of
digital microscopy for primary diagnosis in human pathology: a systematic review. Virchows Arch 2019 Mar;474(3):269-287.
[doi: 10.1007/s00428-018-02519-z] [Medline: 30685784]
11. Gelman A, Carlin J. Beyond power calculations: assessing type S (sign) and type M (magnitude) errors. Perspect Psychol
Sci 2014 Nov;9(6):641-651. [doi: 10.1177/1745691614551642] [Medline: 26186114]
12. Gelman A. The failure of null hypothesis significance testing when studying incremental changes, and what to do about it.
Pers Soc Psychol Bull 2018 Jan;44(1):16-23. [doi: 10.1177/0146167217729162] [Medline: 28914154]
13. Gelman A. The problems with p-values are not just with p-values. Am Stat (Supplemental material to the ASA statement
on p-values and statistical significance) 2016 Jun:129-133 [FREE Full text]
14. Gelman A, Hill J. Data Analysis Using Regression and Multilevel/Hierarchical Models (Analytical Methods for Social
Research). Cambridge: Cambridge University Press; 2006.
15. Gelman J, Carlin B, Stern HS, Dunson DB, Vehtari A, Rubin DB. Bayesian data analysis. New York: CRC Press; 2013.
16. McElreath R. Statistical Rethinking: A Bayesian course with examples in R and Stan. Boca Raton: CRC Press; 2020.
https://www.jmir.org/2021/2/e24266 J Med Internet Res 2021 | vol. 23 | iss. 2 | e24266 | p. 10
(page number not for citation purposes)
XSL• FO
RenderXJOURNAL OF MEDICAL INTERNET RESEARCH Giaretto et al
17. Gelman A, Weakliem D. Of Beauty, Sex and Power - Too little attention has been paid to the statistical challenges in
estimating small effects. American Scientist 2009;97(4):310. [doi: 10.1511/2009.79.310]
18. Renne SL, Valeri M, Tosoni A, Bertolotti A, Rossi R, Renne G, et al. Myoid gonadal tumor. Case series, systematic review,
and Bayesian analysis. Virchows Arch 2020 Nov. [doi: 10.1007/s00428-020-02957-8] [Medline: 33140129]
19. Metropolis N, Rosenbluth AW, Rosenbluth MN, Teller AH, Teller E. Equation of state calculations by fast computing
machines. J Chem Phys 1953 Jun;21(6):1087-1092. [doi: 10.1063/1.1699114]
20. Hoffman MD, Gelman A. The no-U-turn sampler: Adaptively setting path lengths in Hamiltonian Monte Carlo. J Mach
Learn Res 2014 Apr;15:1593-1623 [FREE Full text]
21. Gelman A. Analysis of variance: why it is more important than ever. Ann Stat 2005;33(1):1-31 [FREE Full text]
22. Watanabe S. Asymptotic equivalence of Bayes cross validation and widely applicable information criterion in singular
learning theory. J Mach Learn Res 2010;11:3571-3594 [FREE Full text]
23. Vehtari A, Gelman A, Gabry J. Practical Bayesian model evaluation using leave-one-out cross-validation and WAIC. Stat
Comput 2016 Aug 30;27(5):1413-1432. [doi: 10.1007/s11222-016-9696-4]
24. Gelman A, Hwang J, Vehtari A. Understanding predictive information criteria for Bayesian models. Stat Comput 2013
Aug 20;24(6):997-1016. [doi: 10.1007/s11222-013-9416-2]
25. Williams PM. Bayesian conditionalisation and the principle of minimum information. Br J Philos Sci 1980 Jun
01;31(2):131-144. [doi: 10.1093/bjps/31.2.131]
26. Caticha A, Giffin A. Updating probabilities. AIP Conference Proceedings 2006;872(1):31-42. [doi: 10.1063/1.2423258]
27. Giffin A. Maximum entropy: the universal method for inference. arXiv Preprint posted online January 20, 2009. [FREE
Full text]
28. Jaynes T. The relation of Bayesian and maximum entropy method. In: Erickson GJ, Smith CR, editors. Maximum-Entropy
and Bayesian Methods in Science and Engineering. Fundamental Theories of Physics (An International Book Series on
The Fundamental Theories of Physics: Their Clarification, Development and Application). Dordrecht: Springer; 1988:29.
29. Gabry J, Simpson D, Vehtari A, Betancourt M, Gelman A. Visualization in Bayesian workflow. J R Stat Soc Ser A 2019
Jan 15;182(2):389-402. [doi: 10.1111/rssa.12378]
30. Gelman A, Vehtari A, Simpson D, Margossian CC, Carpenter B, Yao Y, et al. Bayesian Workflow. arXiv Preprint posted
online November 3, 2020. [FREE Full text]
31. Papaspiliopoulos O, Roberts GO, Sköld M. A general framework for the parametrization of hierarchical models. Statist
Sci 2007 Feb;22(1):59-73. [doi: 10.1214/088342307000000014]
32. 22.7 Reparameterization. Stan Development Team Stan User's Guide Version 2. URL: https://mc-stan.org/docs/2_25/
stan-users-guide/reparameterization-section.html [accessed 2020-12-09]
33. Carpenter B, Gelman A, Hoffman MD, Lee D, Goodrich B, Betancourt M, et al. Stan: a probabilistic programming language.
J Stat Soft 2017;76(1):1-32. [doi: 10.18637/jss.v076.i01]
34. The R Project for Statistical Computing. The R Foundation. 2019. URL: https://www.r-project.org/ [accessed 2021-01-28]
35. SmartCovid: Datasets and code for the study. GitHub. URL: https://github.com/slrenne/SmartCovid [accessed 2021-01-29]
36. Randell R, Ruddle RA, Treanor D. Barriers and facilitators to the introduction of digital pathology for diagnostic work.
Stud Health Technol Inform 2015;216:443-447. [Medline: 26262089]
37. Pavone F. Guida rapida per operatori in campo contro il COVID-19: Autovalutazione dello stress e Gestione del disagio
emotivo. 2020 Mar 29. URL: https://associazioneitalianacasemanager.it/wp-content/uploads/2020/04/
COVID_19_e_stress_professionale_3_1-FP-ASST.pdf [accessed 2020-12-09]
38. Retamero JA, Aneiros-Fernandez J, Del Moral RG. Microscope? No, thanks: user experience with complete digital pathology
for routine diagnosis. Arch Pathol Lab Med 2020 Jun;144(6):672-673 [FREE Full text] [doi: 10.5858/arpa.2019-0355-LE]
[Medline: 32459536]
39. Goacher E, Randell R, Williams B, Treanor D. The diagnostic concordance of whole slide imaging and light microscopy:
a systematic review. Arch Pathol Lab Med 2017 Jan;141(1):151-161 [FREE Full text] [doi: 10.5858/arpa.2016-0025-RA]
[Medline: 27399211]
40. Williams BJ, DaCosta P, Goacher E, Treanor D. A systematic analysis of discordant diagnoses in digital pathology compared
with light microscopy. Arch Pathol Lab Med 2017 Dec;141(12):1712-1718 [FREE Full text] [doi:
10.5858/arpa.2016-0494-OA] [Medline: 28467215]
41. Mukhopadhyay S, Feldman MD, Abels E, Ashfaq R, Beltaifa S, Cacciabeve NG, et al. Whole slide imaging versus
microscopy for primary diagnosis in surgical pathology. Am J Surg Pathol 2017:1. [doi: 10.1097/pas.0000000000000948]
42. Borowsky AD, Glassy EF, Wallace WD, Kallichanda NS, Behling CA, Miller DV, et al. Digital whole slide imaging
compared with light microscopy for primary diagnosis in surgical pathology. Arch Pathol Lab Med 2020 Oct
01;144(10):1245-1253 [FREE Full text] [doi: 10.5858/arpa.2019-0569-OA] [Medline: 32057275]
43. Hanna MG, Reuter VE, Hameed MR, Tan LK, Chiang S, Sigel C, et al. Whole slide imaging equivalency and efficiency
study: experience at a large academic center. Mod Pathol 2019 Jul;32(7):916-928. [doi: 10.1038/s41379-019-0205-0]
[Medline: 30778169]
https://www.jmir.org/2021/2/e24266 J Med Internet Res 2021 | vol. 23 | iss. 2 | e24266 | p. 11
(page number not for citation purposes)
XSL• FO
RenderXJOURNAL OF MEDICAL INTERNET RESEARCH Giaretto et al
44. Hanna MG, Reuter VE, Ardon O, Kim D, Sirintrapun SJ, Schüffler PJ, et al. Validation of a digital pathology system
including remote review during the COVID-19 pandemic. Mod Pathol 2020 Nov;33(11):2115-2127 [FREE Full text] [doi:
10.1038/s41379-020-0601-5] [Medline: 32572154]
Abbreviations
DP: digital pathology
Edited by G Eysenbach; submitted 11.09.20; peer-reviewed by R Poluru, B Kaas-Hansen; comments to author 01.12.20; revised
version received 09.12.20; accepted 14.12.20; published 22.02.21
Please cite as:
Giaretto S, Renne SL, Rahal D, Bossi P, Colombo P, Spaggiari P, Manara S, Sollai M, Fiamengo B, Brambilla T, Fernandes B, Rao
S, Elamin A, Valeri M, De Carlo C, Belsito V, Lancellotti C, Cieri M, Cagini A, Terracciano L, Roncalli M, Di Tommaso L
Digital Pathology During the COVID-19 Outbreak in Italy: Survey Study
J Med Internet Res 2021;23(2):e24266
URL: https://www.jmir.org/2021/2/e24266
doi: 10.2196/24266
PMID: 33503002
©Simone Giaretto, Salvatore Lorenzo Renne, Daoud Rahal, Paola Bossi, Piergiuseppe Colombo, Paola Spaggiari, Sofia Manara,
Mauro Sollai, Barbara Fiamengo, Tatiana Brambilla, Bethania Fernandes, Stefania Rao, Abubaker Elamin, Marina Valeri, Camilla
De Carlo, Vincenzo Belsito, Cesare Lancellotti, Miriam Cieri, Angelo Cagini, Luigi Terracciano, Massimo Roncalli, Luca Di
Tommaso. Originally published in the Journal of Medical Internet Research (http://www.jmir.org), 22.02.2021. This is an
open-access article distributed under the terms of the Creative Commons Attribution License
(https://creativecommons.org/licenses/by/4.0/), which permits unrestricted use, distribution, and reproduction in any medium,
provided the original work, first published in the Journal of Medical Internet Research, is properly cited. The complete bibliographic
information, a link to the original publication on http://www.jmir.org/, as well as this copyright and license information must be
included.
https://www.jmir.org/2021/2/e24266 J Med Internet Res 2021 | vol. 23 | iss. 2 | e24266 | p. 12
(page number not for citation purposes)
XSL• FO
RenderXYou can also read