Diagnostic Radiography Workforce UK Census 2018 - First edition May 2019 ISBN: 978-1-909802-41-4
←
→
Page content transcription
If your browser does not render page correctly, please read the page content below
Diagnostic
Radiography Workforce
UK Census 2018

First edition
May 2019
ISBN: 978-1-909802-41-4

Quartz House
207 Providence Square
Mill Street
London SE1 2EW

020 7740 7200
info@sor.org
                          www.sor.org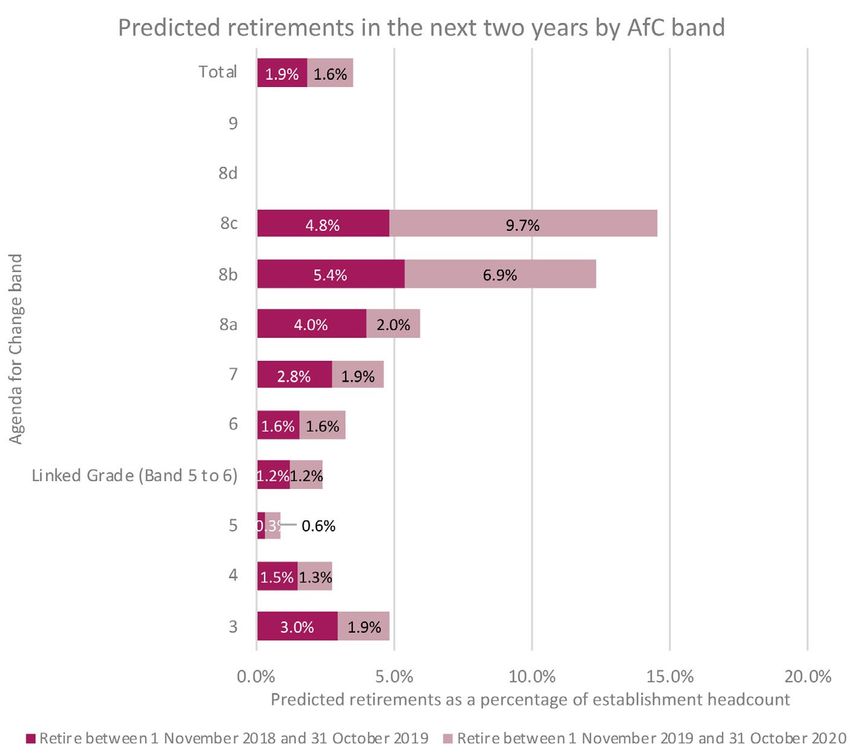
Contents
1. Foreword                                       3
2. Executive summary                              4
3. Introduction                                   5
4. Methodology                                    5
5. Profile of workforce size                      6
6. Shape of workforce by Agenda for Change band   6
7. Vacancy rate                                   7
  7.1 Current vacancy rate                        7
  7.2 Current vacancy rate by country             8
  7.3 Three-month vacancy rate                    9
8. Long-term absence rate                         10
9. Predicted retirements                          11
10. Registration status of clinical staff         11
11. Geographical origin of radiographers          12
12. Reasons for leaving                           12
13. Non-clinical duties                           13
14. Postgraduate training                         14
15. Advanced and consultant practice              14
16. Agency staff                                  15
17. General comments                              16
18. References                                    17
19. Downloads                                     17
1. Foreword
Each year the Society and College of Radiographers undertakes a UK-wide
diagnostic radiography workforce census to gain intelligence about the clinical
imaging radiography workforce.

The Society and College 2018 census continues to show some high vacancy
rates across the UK, particularly in England where the vacancy rates from
those trusts responding is 10%.

These vacancy figures are reported at a time when there is an increasing
demand for imaging services. Clinical imaging is integral to almost all pathways
of care; as both part of informing the diagnosis and in monitoring outcomes
to treatment. Timely imaging and reporting is, therefore, essential in delivering
efficient patient pathways, and supporting the goal of improving outcomes for
patients. Sufficient workforce is required to support this goal.

In the NHS long term plan1 published in January 2019 it was noted that
capacity in diagnostic services has not kept pace with the growth in demand.
We have fewer MRI and CT scanners per capita than most OECD countries,
yet, the number of patients referred for diagnostic tests has risen by over 25%
over the last five years. So delivering an effective, high-quality service requires
investment in new equipment and staff, underpinned by a new model of
diagnostic provision.

 As demand continues to rise and complexity of imaging increases, more
diagnostic radiographers will be required to image patients and in addition,
more are required at advanced practitioner level to contribute to the
interpretation / reporting of imaging studies that are part of the diagnostic
pathway of care. The cancer workforce plan2 recognises the contribution of
diagnostic radiographers as a key workforce and published its ambition to
provide 300 additional reporting radiographers, funding has already been
provided for 150 of these.

We urge service leaders to work with key stakeholders to develop clear plans
to support the growth of the workforce to meet the population’s needs at the
local level; this should include optimising skills mix with both implementation
of assistant practitioner support workforce and investment in advanced and
consultant practice to support service innovation and utilising technologies
in order to maximise capacity and capability. The recently announced
apprenticeship standard for diagnostic Radiographers3 and the mammography
associate standard4 opens up alternative routes into supporting growth in the
workforce.

We would like to thank our service managers for submitting figures for the
2018 diagnostic workforce census. We will share this report widely with key
stakeholders across the UK.

President, Mrs Sue Webb.

                                         3
2. Executive summary
In November 2018, the College of Radiographers (CoR) carried out a census
of the diagnostic radiography workforce in the UK. The objectives were to
establish the size, structure, nature and vacancy rate of the workforce in
order to inform workforce planning. Eighty-nine providers of medical imaging
responded to an online questionnaire. This document presents an analysis
of the census results and compares them to similar censuses carried out in
September 2014, May 2016 and November 20174,5,6. The following bullet
points highlight the main findings:
• The average number of diagnostic radiography establishment staff by
     whole time equivalent (WTE) per respondent is 104.9.
• The average current vacancy rate across all respondents is 9.0% at the
     census date of 1 November 2018. This compares to an average vacancy
     rate of 7.8% in the September 2014 census, 13.1% in May 2016 and
     9.1% in November 2017. These differences in vacancy rates may be due in
     part to the different times of year at which the censuses were carried out.
• The average current vacancy rate varies by UK country: England 10%,
     Northern Ireland 4%, Scotland 6% and Wales 3%.
• The average three-month vacancy rate across all respondents is 5.6%.
• The average percentage of the respondents’ establishment headcount
     absent long term is 3.6% (comprising 0.3% on a career break, 1.3%
     absent due to long-term sickness and 1.9% on parental leave).
• 3.5% of respondents’ diagnostic radiographic workers are due to retire in
     the next two years.
• An average of 2.0 clinical staff at band 5 (or equivalent) or above
     (headcount) per respondent are not registered with the Health and Care
     Professions Council (HCPC).
• 89% of radiographers (by headcount) at the responding providers are from
     the UK.
• The main reasons respondents give for radiographers leaving their posts
     are promotion in other centre, retirement and personal reasons.
• On average, each respondent has 6.4 members of staff (WTE) in
     postgraduate training in MRI, CT, ultrasound, mammography, nuclear
     medicine and/or reporting.
• On average, each respondent has 15.9 diagnostic radiographers,
     sonographers and/or nuclear technologists (headcount) carrying out
     advanced practice and 0.9 carrying out consultant-level practice.
• 81% of respondents use either diagnostic radiography or sonography
     agency staff (or both).

                                       4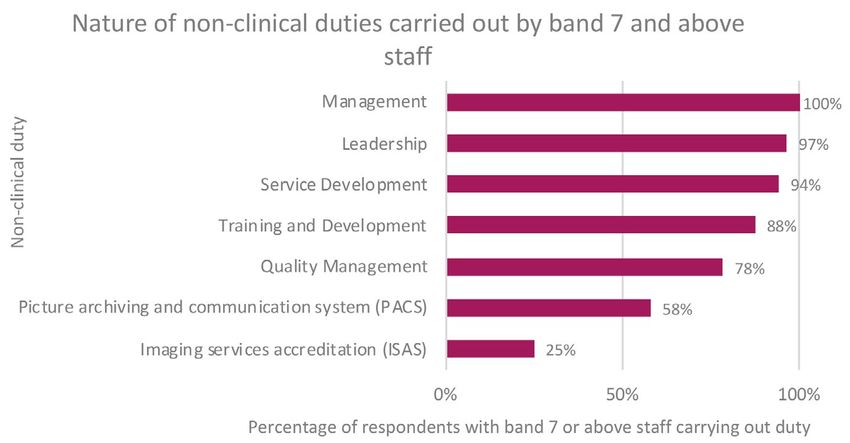
3. Introduction
This report presents an analysis of an online census of the diagnostic
radiography workforce in the UK run by the CoR in November 2018. It follows
on from similar censuses in September 20145, May 20166 and November
20177. The census was targeted at providers of medical imaging in England,
the Channel Islands, the Isle of Man, Northern Ireland, Scotland and Wales,
in the NHS and other healthcare sectors. Respondents were asked about
the type and scale of diagnostic radiography services they provide and the
size and nature of their diagnostic radiography workforce. The results of this
census will inform the work of professional bodies, workforce planners and
commissioners/providers of radiography education.

4. Methodology
The 2018 workforce census captures data about the diagnostic radiography
workforce in the UK at a census date of 1 November 2018. Radiology services
managers (or equivalents) were asked to answer the census on behalf of all
diagnostic radiography (medical imaging) services in their hospital/workplace.
They were asked to include all diagnostic radiographers, sonographers, nuclear
medicine technologists, PET-CT technologists, assistant practitioners and
trainee assistant practitioners (together referred to as the ‘diagnostic radiography
workforce’ in this report), but not to include radiographic assistants (helpers/
healthcare support workers), clerical workers, clinical scientists, radiotherapy staff
or third-party managed services where the staff are employed by the third party.

Respondents were asked:
• Their contact details and details of the workplaces and medical imaging
   modalities on behalf of which they were responding
• Establishment figures by Agenda for Change (AfC) band – WTE and
   headcount
• Vacancy figures by AfC band – current and three-month
• Long-term absence figures by AfC band – career break, long-term
   sickness and parental leave
• Numbers expected to retire in the coming year and in the subsequent year
• Numbers of staff not registered with the HCPC
• Geographical origin of radiographers (UK, EU or non-EU)
• Reasons for radiographers leaving their posts
• Time spent on non-clinical duties
• Numbers in postgraduate training
• Numbers in advanced and consultant practice
• Use of agency staff

Both NHS and non-NHS providers were asked to supply their workforce data
by AfC band. Non-NHS providers, who may not use the AfC system, were
asked to refer to the NHS AfC pay bands before responding. Thus, all data
could be collected and analysed by AfC band.

Data collection was carried out in November 2018, December 2018 and
January 2019. We received 89 responses from medical imaging services. This
compares to 74 responses to the previous census in November 2017.

Not every respondent answered every question. The ‘n’ number below each
figure in this report indicates the number of respondents for that question.
Links to the full set of questions for the 2018 census and a spreadsheet of the
background data are provided in the downloads section.

                                          5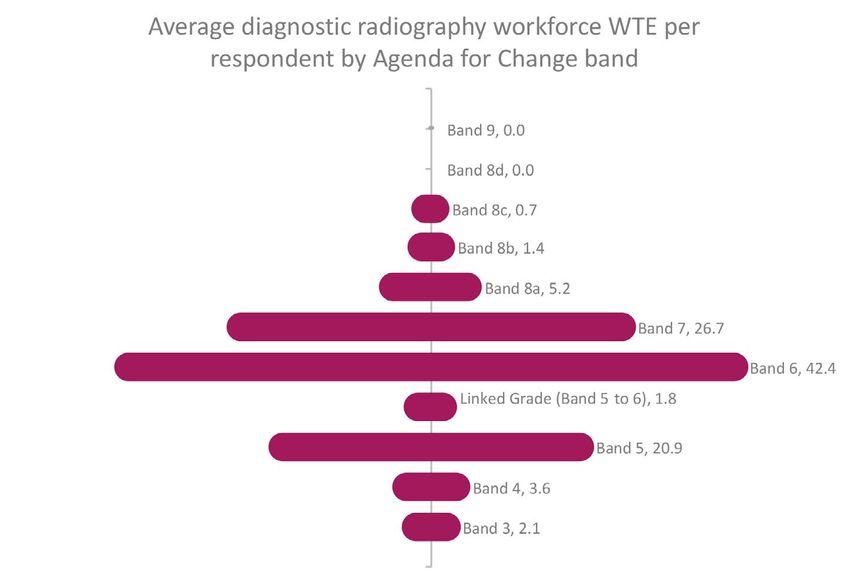
5. Profile of workforce size
The respondents are fairly evenly distributed in terms of the size of their
diagnostic radiography workforce (WTE). The single non-NHS respondent has
a diagnostic radiography workforce of over 200 WTE.

Figure 1 Diagnostic radiography workforce WTE size distribution of respondents (n=89)

6. Shape of workforce by Agenda for Change band
The average number of diagnostic radiography establishment staff by WTE per
respondent is 104.9. The diagram in figure 2 illustrates the average number of
WTE staff by AfC band.

Figure 2 Average diagnostic radiography workforce WTE by AfC band (n=89)

                                               6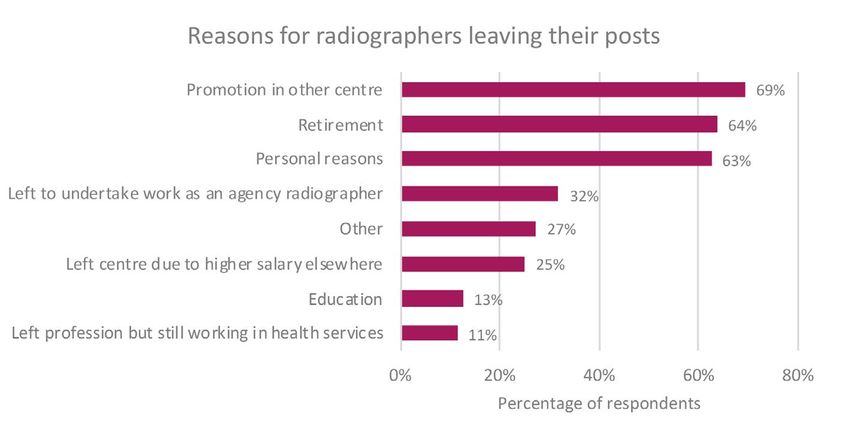
7. Vacancy rate

7.1 Current vacancy rate
Of the 89 respondents to this question, 82 (92%) report vacant radiographic
workforce posts.

The average current vacancy rate across all respondents is 9.0% at the census
date of 1 November 2018. (The current vacancy rate is defined as the total
number of WTE vacancies as a percentage of the WTE establishment number
of staff.)

This compares to an average vacancy rate of 7.8% in the September 2014
census, 13.1% in May 2016 and 9.1% in November 2017. These differences
in vacancy rate may be due in part to the different times of year at which the
censuses were carried out. For example, the May 2016 census was before the
largest annual intake of recently qualified radiographers, which is around June/
July each year.

Figure 3 illustrates that the highest vacancy rate is at AfC band 9. This 50%
vacancy rate is from a single respondent who reported 4.0 establishment posts
WTE at band 9, of which 2.0 are vacant. No other respondents reported any
band 9 establishment posts or vacancies.

Figure 3 Current vacancy rate by AfC band (n=89)

                                              7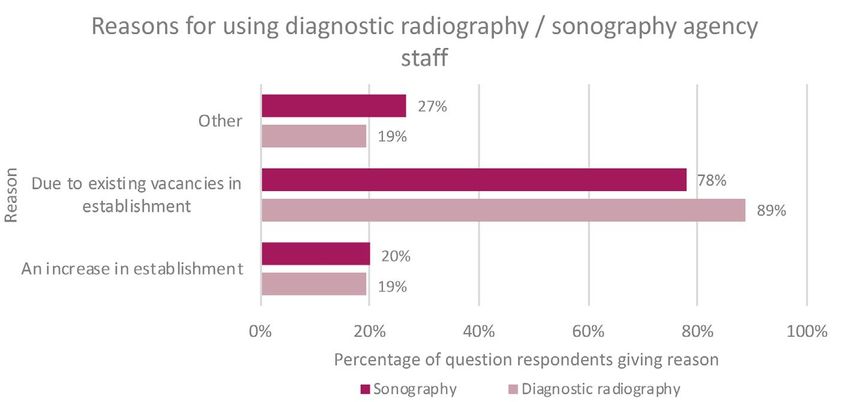
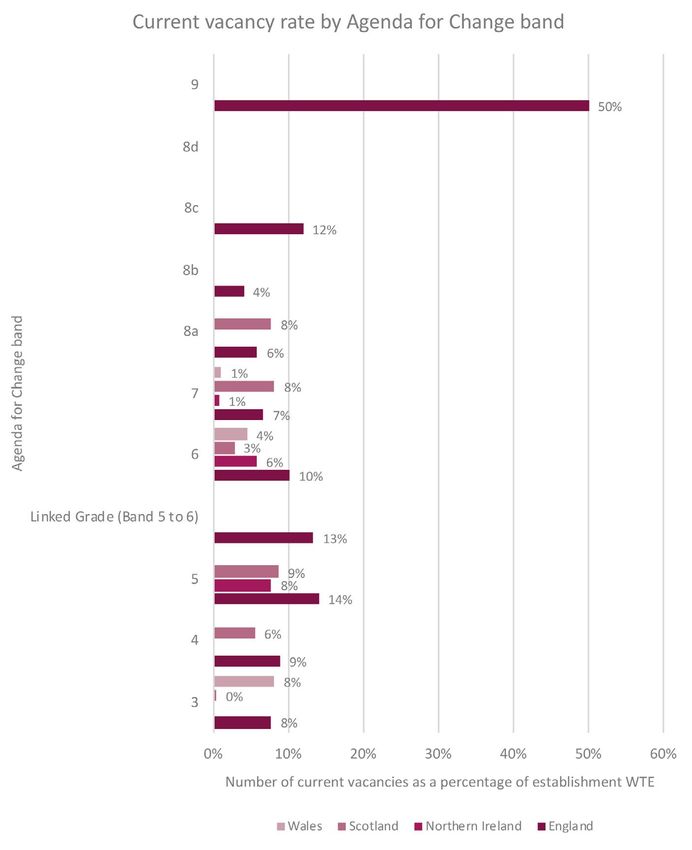
7.2 Current vacancy rate by country
The average current vacancy rate varies by UK country: England 10%,
Northern Ireland 4%, Scotland 6% and Wales 3%. Figure 4 breaks down these
figures by AfC band.

Figure 4 Current vacancy rate by AfC band and UK country (n=89)

                                             8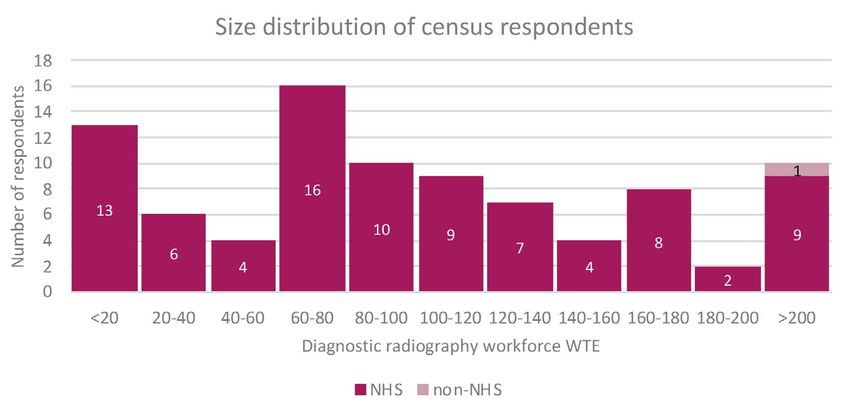
7.3 Three-month vacancy rate
Of the 89 respondents to this question, 74 (83%) report vacancies that have
existed for three months or longer. The average three-month vacancy rate
across all respondents is 5.6%.

As with figures 3 and 4, figure 5 contains the 50% vacancy rate reported at
band 9. This is due to a single respondent who reported 4.0 establishment
posts WTE at band 9, of which 2.0 are vacant. No other respondents reported
any band 9 establishment posts or vacancies.

Figure 5 Three-month vacancy rate by AfC band (n=89)

                                             9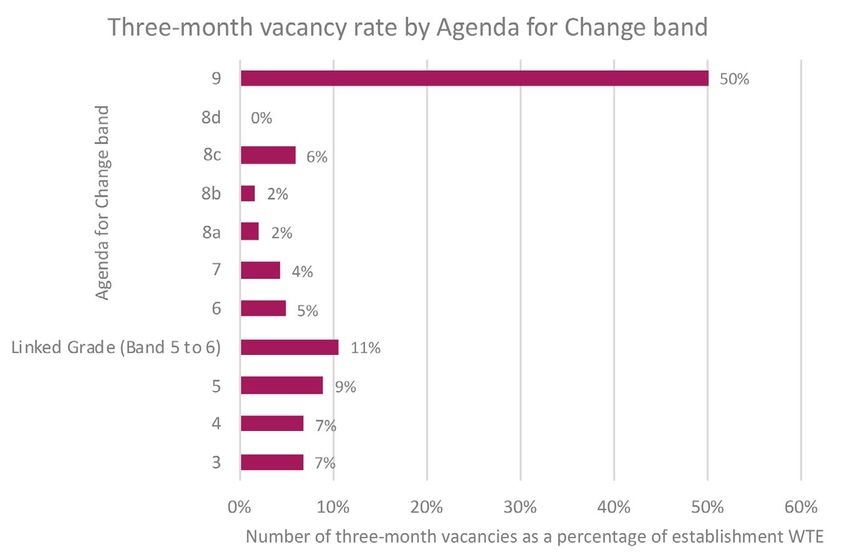
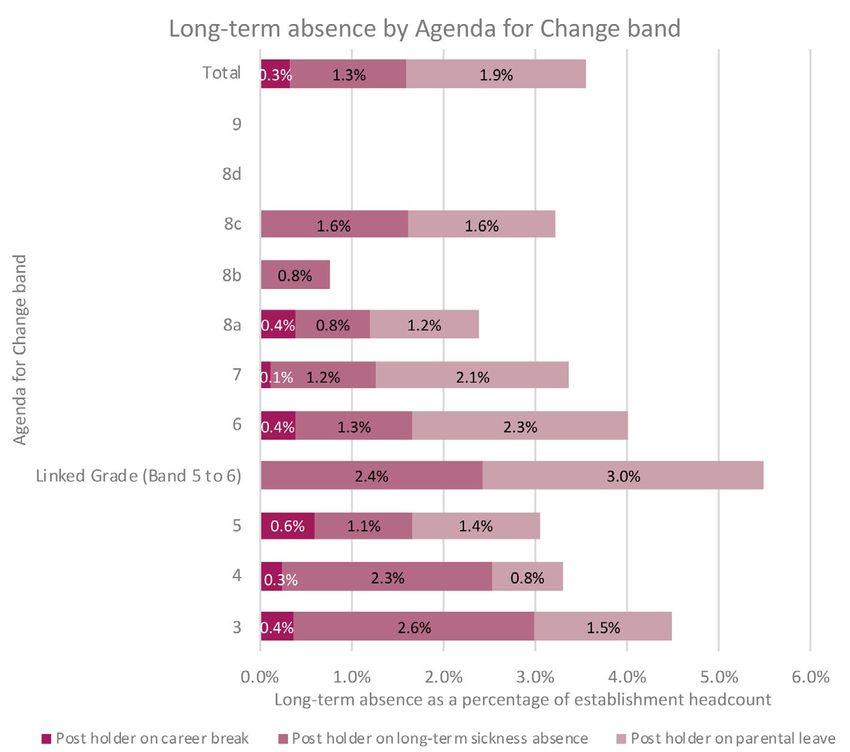
8. Long-term absence rate
The average percentage of the respondents’ diagnostic radiographic
establishment headcount on long-term absence is 3.6% as of the census date
1 November 2018 (comprising 0.3% on a career break, 1.3% on long-term
sickness absence and 1.9% on parental leave). This compares to an average
percentage on long-term absence of 3.8% in the September 2014 census,
4.5% in May 2016 and 3.4% in November 2017.

Figure 6 Long-term absence rate by AfC band (n=88)

                                            10
9. Predicted retirements
Respondents were asked to give the number of radiographic workforce
posts in which the post holder is due to retire in the coming year (between 1
November 2018 and 31 October 2019) and the subsequent year (between
1 November 2019 and 31 October 2020). In total, 3.5% of respondents’
radiographic workers are due to retire in the next two years.
Figure 7 Predicted retirements in the next two years (n=88)
10. Registration status of clinical staff
Of the 87 respondents to the question regarding registration status, 34 (39%)
have clinical staff of band 5 (or equivalent) and above who are not registered
with the HCPC. An average of 2.0 clinical staff at band 5 (or equivalent) and
above (headcount) per respondent are not registered with the HCPC.
1111. Geographical origin of radiographers
By headcount, 89% of radiographers at the responding providers are from the
UK. This is a reported increase in overseas staff compared with 2017 figures:
EU staff 3%, Outside UK/EU/EEA 1%.
Figure 8 Geographical origin of radiographers (n=48)
12. Reasons for leaving
The main reasons respondents give for radiographers leaving their posts are
promotion in other centre, retirement and personal reasons.
Figure 9 Reasons for radiographers leaving their posts (n=89)
Other reasons for leaving given in the free text by two or more respondents are:
• Overseas travel (4 respondents)
• Shorter commute (3 respondents)
• Relocation (3 respondents)
• None have left (2 respondents)
• Shift system (2 respondents)
• Left profession (2 respondents)
• High cost of living (2 respondents)
1213. Non-clinical duties
Respondents were asked to estimate the percentage of time staff of AfC band
7 (or equivalent) and above spend on non-clinical duties in an average working
week and give the nature of these duties. In general, with the exception of
band 9, the higher the AfC band, the more time is spent on non-clinical duties.
Figure 10 Estimated percentage of time spent on non-clinical duties (n=89)
Figure 11 Nature of non-clinical duties carried out by band 7 and above staff (n=88)
1314. Postgraduate training
Respondents were asked the number of staff (WTE) currently in postgraduate
training in MRI, CT, ultrasound, mammography, nuclear medicine or reporting.
On average, each respondent has 6.4 members of staff (WTE) in postgraduate
training in these modalities. Of the 89 respondents, 22 (25%) also have staff in
postgraduate training in one or more other modalities.
Figure 12 Percentage of staff (WTE) in postgraduate training (n=89)
15. Advanced and consultant practice
On average, each respondent has 15.9 diagnostic radiographers,
sonographers and/or nuclear technologists (headcount) carrying out advanced
practice and 0.9 carrying out consultant-level practice.
Figure 13 Number of diagnostic radiographers, sonographers and nuclear medicine technologists
in advanced and consultant-level practice as a percentage of establishment headcount (n=88)
1416. Agency staff
Of the 89 respondents to the questionnaire section about agency staff, 72
(81%) use either diagnostic radiography or sonography agency staff (or
both) as of the census date; 62 of the 89 respondents (70%) use diagnostic
radiography agency staff and 45 (51%) use sonography agency staff.
Figure 14 illustrates that the main reason for using agency staff is existing
vacancies.
Figure 14 Reasons for using agency staff (n=72)
Other reasons for using diagnostic radiography agency staff given in the free
text by two or more respondents are:
• Covering parental leave (7 respondents)
• Increased demand (4 respondents)
• Covering sickness absence (2 respondents)
• Other reasons for using sonography agency staff given in the free text by
two or more respondents include:
• Specialist skill mix provision (6 respondents)
• Covering parental leave (5 respondents)
• Increased demand (3 respondents)
• Covering in-house sonographers in training (2 respondents)
Figure 15 shows that more agency staff employed by the respondents are
trained in the UK than elsewhere.
Figure 15 Number (headcount) of agency staff used trained in the UK and elsewhere (n=72)
1517. General comments
At the end of the questionnaire, respondents were asked if they had any
general comments relating to their submission. Themes mentioned by two
or more respondents are given below, with the number of respondents in
brackets after the theme, followed by an illustrative comment:
• Workforce data submitted does not include all the diagnostic radiography
modalities available at the provider (4 respondents) “Nuclear Medicine and
Breast Screening not included. These are run separately from the main
Imaging Department.”
• Workforce data submitted is not exact (4 respondents) “Our workforce is
rapidly changing currently so the figures provided are to the best of my
knowledge at this date.”
• Workforce data submitted includes health professionals registered with
agencies other than the HCPC (3 respondents) “I have put that we have a
sonographer without HCPC registration, however they are NMC [Nursing &
Midwifery Council] registered.”
• Shift system implications (3 respondents) “The switch to a shift system
has made it difficult to retain staff and also to train staff appropriately.
Also it would be useful to know who is shift and who isn't when trying to
benchmark with other similar sized trusts.”
• Retention issues (2 respondents) “R and R [recruitment and retention]
has been difficult due to the move to a new hospital 10 miles away from
current site.”
1618. References
1. Department of Health (2019). The NHS Long Term Plan Available at:
https://www.longtermplan.nhs.uk [Accessed May 15, 2019].
2. Health Education England (2017). Cancer Workforce plan Phase 1:
Delivering the cancer strategy to 2021 Available at: https://www.hee.
nhs.uk/sites/default/files/documents/Cancer Workforce Plan phase 1 -
Delivering the cancer strategy to 2021.pdf [Accessed May 15, 2019].
3. Institute for Apprenticeships (2018). Diagnostic radiographer
(degree) Available at: https://haso.skillsforhealth.org.uk/wp-content/
uploads/2018/12/2018.12.10-L6-Diagnostic-Radiographer-Standard-
ST0619-IfA-version.pdf [Accessed May 15, 2019].
4. Skills for Health (2018). Apprenticeship standard for mammography
associate at level 4 Available at: https://haso.skillsforhealth.org.uk/wp-
content/uploads/2017/04/MA-Apprenticeship-Standard-Submission-
FINAL-Feb-2018.pdf [Accessed May 15, 2019].
5. College of Radiographers (2014). Diagnostic Radiography UK Workforce
Report 2014 Available at: https://www.sor.org/learning/document-library/
diagnostic-radiography-uk-workforce-report-2014 [Accessed Feb. 15,
2019].
6. College of Radiographers (2016). Diagnostic Radiography UK Workforce
Report 2016 Available at: https://www.sor.org/learning/document-library/
diagnostic-radiography-uk-workforce-report-2016 [Accessed Feb. 15,
2019].
7. Society and College of Radiographers (2018). Diagnostic Radiography UK
Workforce Report 2017 Available at: https://www.sor.org/sites/default/
files/document-versions/scor_census_of_uk_diagnostic_radiographic_
workforce_2017_report_-_final_version.pdf [Accessed Feb. 15, 2019].
19. Downloads
Accessible from https://www.sor.org/learning/document-library?title=
Diagnostic+Radiography+Workforce
• CoR diagnostic radiography workforce UK census 2018 questionnaire
(PDF)
• CoR diagnostic radiography workforce UK census 2018 spreadsheet
(Excel)
17© The Society and College of Radiographers 2019. Material may only be reproduced from this publication with clear acknowledgement that it is the original source.
You can also read