Diagnoses of HIV Infections Among Adults and Adolescents in New Mexico
←
→
Page content transcription
If your browser does not render page correctly, please read the page content below
Diagnoses of HIV Infections
Among Adults and Adolescents in New Mexico
     Annual Report of Cases Through 2019

    HIV Surveillance and Epidemiology Program
        New Mexico Department of Health

                    Tracie C. Collins, MD
                     Cabinet Secretary

                  Christine Ross, MD, MPH
                    State Epidemiologist

                    Chad Smelser, MD
                 Deputy State Epidemiologist

         https://nmhealth.org/about/erd/ideb/haep/
              Final Report Date June 30, 2021
HIV Surveillance and Epidemiology Program (HIVSEP)

            Infectious Disease Epidemiology Bureau                  Mika Gehre, PhD, MPH
              Epidemiology and Response Division                    HIV Surveillance Coordinator
               New Mexico Department of Health                      Mika.Gehre@state.nm.us
                1190 Saint Francis Drive, N1350                     (505) 476-1643
                    Santa Fe, NM 87502-6110
                     Phone: (505) 476-3515                          Samuel Scherber, MPH
                       Fax: (505) 476-3544                          HIV Epidemiologist
                                                                    Samuel.Scherber@state.nm.us
                                                                    (505) 476-3509

                                                                    Tierney Murphy, MD, MPH
                                                                    Director, HIVSEP
                                                                    Tierney.Murphy@state.nm.us
                                                                    (505) 827-0077

The HIV Epidemiology and Surveillance Program would like to thank the many dedicated individuals who
contribute to HIV surveillance in New Mexico. Clinical providers, laboratories, and other health professionals
collect and report data upon which this report is based. HIVSEP also thanks its partners within the New Mexico
Department of Health, including the Public Health Division’s HIV Prevention, HIV Services, and Sexually
Transmitted Disease (STD) Programs. This publication was supported by a Cooperative Agreement for HIV
prevention and surveillance under grant # 5 NU62PS924535 from the Centers for Disease Control and Prevention
(CDC), Division of HIV/AIDS Prevention (DHAP). Its contents are solely the responsibility of the authors and do not
necessarily represent the official views of the CDC.
.
To report HIV or AIDS in New Mexico:
New Mexico Department of Health
1190 Saint Francis Drive, N1350
Santa Fe, NM 87502-6110
Attention: HIV Surveillance Coordinator
Phone: (505) 476-3515
Secure fax: (505) 476-3544CONTENTS
Contents .................................................................................................................................................................4
INTRODUCTION ............................................................................................................................................. 5
ORGANIZATION OF THE REPORT .......................................................................................................................5
OVERVIEW NEW MEXICO 2018 ....................................................................................................................... 6
Section 1: New Diagnoses of HIV Infection Stage 1 through Stage 3 ....................................................................6
NEWLY DIAGNOSED STAGE 1 AND STAGE 2 HIV INFECTIONS ...........................................................................6
NEWLY DIAGNOSED STAGE 3 HIV INFECTIONS (i.e., AIDS) ............................................................................. 13
Section 2: Persons Living with Diagnosed HIV Infection or with HIV Infection Ever Classified as Stage 3 (i.e.,
AIDS) .................................................................................................................................................................... 18
Section 3: New Diagnoses of HIV Infection and Persons Living with Diagnosed HIV Infection by NM Public
Health Region ...................................................................................................................................................... 20
Section 4: Deaths and Survival After a Diagnosis of HIV Infection or Stage 3 HIV Infection (i.e., AIDS) ............ 27
STRENGTHS AND LIMITATIONS ..................................................................................................................... 29
DATA SOURCES ............................................................................................................................................... 30
TECHNICAL NOTES .......................................................................................................................................... 31
ACRONYMS ..................................................................................................................................................... 33
DEFINITIONS ................................................................................................................................................... 33
NMDOH RESOURCES....................................................................................................................................... 34
COMMUNITY PARTNERS ................................................................................................................................. 35
4|PageINTRODUCTION
The New Mexico Department of Health (NMDOH) Human Immunodeficiency Virus (HIV) Epidemiology and
Surveillance Program (HIVSEP) collects, analyzes, and disseminates surveillance data on HIV infections in New
Mexico. This annual surveillance report summarizes information about HIV infections diagnosed in New Mexico
by the end of calendar 2019 and analyzed after the end of calendar year 2020. This information is used by
NMDOH’s public health partners including health departments, nonprofit organizations, academic institutions,
health care providers and the public to help optimize prevention efforts, plan services, allocate resources, develop
policy, and monitor trends in HIV infection.
The Annual Report of Cases Through 2019 includes data for adult and adolescent (aged 13 years or
older) New Mexicans who were newly diagnosed with an HIV infection and who were living with HIV through the
end of 2019. To ensure that the 2019 data are complete and accurate, HIVSEP conducts data collection and
follow-up activities for 12 months following the end of 2019 before analyses are performed. Case ascertainment
was based on the 2014 revised HIV case definition for adults and adolescents age ≥ 13 years,1 which updated the
laboratory criteria for a confirmed case due the development of new testing algorithms.
ORGANIZATION OF THE REPORT
The HIV surveillance report is organized into five sections:
1. New Diagnoses of HIV Infection Stage 1 through Stage 3 (i.e., Acquired Immunodeficiency Syndrome or
AIDS)
2. Persons Living with Diagnosed HIV Infection or with Infection Ever Classified as Stage 3 (i.e., AIDS)
3. New Diagnoses of HIV Infection and Persons Living with Diagnosed HIV by New Mexico Public Health
Region
4. Deaths and Survival after a Diagnosis of HIV Infection or Stage 3 HIV Infection (i.e., AIDS)
5. Methods and Limitations
HIVSEP staff are available to assist with interpretation of these data and to provide additional analyses.
Surveillance data will continue to guide HIV prevention strategies and resource allocation for care services in
New Mexico. For questions or comments, please call the HIV Case Reporting Hotline at (505) 476-3515.
1Selik
RM, Mokotff ED, Branson B, Owen SM, Whitmore S, Hall HI. Revised surveillance case definition for HIV infection – United States,
2014. MMWR 2014;63(RR-03):1-10.
5|PageOVERVIEW NEW MEXICO 2019
SECTION 1: NEW DIAGNOSES OF HIV INFECTION STAGE 1 THROUGH STAGE 3
NEWLY DIAGNOSED STAGE 1 AND STAGE 2 HIV INFECTIONS
During 2019, 148 adult and adolescent (ages 13 years and older) New Mexico residents were newly
diagnosed with HIV infection (Table 1.1). This represents a 16.5% increase from the number of persons diagnosed
in 2018. Over the last ten years the number of new HIV infections per year has been relatively stable with no
consistent upward or downward trend. The 2019 rate of new diagnoses of HIV infection was 8.4 per 100,000
individuals 13 years and older in New Mexico. This is about two-thirds of the 2019 rate in the United States ( 13.2
per 100,000).2 New Mexico is considered a low-moderate HIV morbidity state.
Males constituted the overwhelming majority (85.1%) of people with new diagnoses of HIV infection, with
a rate of 14.5 per 100,000. The male rate of newly diagnosed infections was more than six times higher than the
female rate of 2.3 per 100,000. However, the proportion of newly diagnosed HIV infections among females
increased yearly over the last four years from 6.6% of total infections in 2015 to 14.2% in 2019 . Compared to last
year there was a decrease in newly infections among transgender women from 8 to 1, which is comparable to
prior years. Gender identity is not consistently collected or reported on either laboratory reports or HIV case
report forms, so HIV infections among persons who self-identify as transgender or gender non-conforming are
likely underestimated.
Hispanic New Mexicans composed 52.0% of new HIV infections, followed by White individuals (22.3%)
and American Indian/Alaska Natives (AIAN) (16.9%) (Table 1.1). However, African Americans had the highest rate
of new diagnoses (23.2 per 100,000), followed by AIANs (16.2 per 100,000) and Hispanic people (9.3 per 100,000).
African Americans and AIANs had rates that were 4.9 and 3.4 times higher, respectively, compared to White
individuals (4.7 per 100,000). From 2018 to 2019, the rate of new HIV infections increased among White
individuals by 46.9% from 3.2 per 100,000 to 4.7 per 100,000, whereas rates in African Americans (+ 10.0%) and
Hispanics (+ 12.0%) comparatively showed only slight increases. The rate for AIANs remained the same as in 2018
(Figure 1.2).
2Centers for Disease Control and Prevention. HIV Surveillance Report, 2019 ; vol. 32. http://www.cdc.gov/hiv/library/reports/hiv-
surveillance.html. Published May 2021. Accessed June 27, , 2021.
6|PageThe age distribution of new HIV infections in 2019 was similar to 2018 (Table 1.1). Rates of new HIV
infection increased across all age groups. As in the prior four years, persons 25-34 years of age had the highest
proportion (40.5%) and rate (21.1 per 100,000) of new HIV infections in 2019. The rate in this age group increased
by 17.9 % in the past year, from 17.9 to 21.1 per 100,000 (Figure 1.3). As New Mexico is a low-moderate morbidity
state for HIV, small changes in numbers (e.g., 21 to 26 in the 13-24 years age group) may be due to the normal
fluctuation of new diagnoses over time and may not represent a statistically significant change in the age-specific
rate.
NMDOH follows definitions from the Centers for Disease Control and Prevention (CDC) in categorizing
persons living with HIV by risk factor. However, the HIVSEP updated variables and data definitions in 2020 to
correctly reflect risk factors for transgender individuals and individuals that were exposed through heterosexual
contacts without the presence of other reported risk factors. Gay/bisexual men and other men who have sex with
men (MSM) are historically the most affected group with HIV infection in the United States, as well as in New
Mexico. Approximately 70% of new HIV diagnoses in the U.S. in 2019 were attributed to male-to-male sexual
contact (MMSC) (including 4% MMSC and injection drug use [IDU]), compared to 72.2% % of new diagnoses in NM
in 2019.3 In New Mexico, MSM represented the route of transmission in 61.1% of new infections in males (Figure
1.4). From 2018 to 2019, there was a 75.0% increase in the number of men with newly diagnosed HIV infections
that had a defined risk of MSM who inject drugs; and a 28.6% increase in the number of new HIV diagnoses among
males due to heterosexual contact. Due to the way that risk categories are defined by CDC, most females living
with HIV were categorized as unknown or unreported risk category (NIR or NRR), which accounted for more than
three-quarters of all females with new HIV infections in prior reports. This number decreased to three in 2019 due
to the HIVSEP revised definitions of transmission risk categories. The majority (61.9 %) of females now have
heterosexual contact with men as their transmission mode (Figure 1.5) (See Technical Note about transmission
categories.) More information on the risk behaviors of male partners is needed to correctly categorize
transmission of HIV infection among heterosexual females. Improving the classification and the completeness of
risk factor information collected for all new HIV infections will help to better target prevention activities and
connect individuals to care.
7|Page8|Page
Figure 1.1 Rate of New Diagnoses of HIV Infection Among Adults & Adolescents
                           per 100,000 Population by Year of Diagnosis & Sex, New Mexico, 2010—2019

                                                  Male                   Female                    TOTAL
                   20.0

                   15.0
Rate per 100,000

                   10.0

                           5.0

                           0.0
                                 2010     2011    2012     2013       2014      2015       2016    2017      2018      2019
                                                                     Year of Diagnosis

                           Figure 1.2 Rate of New Diagnoses of HIV Infection Among Adults & Adolescents per 100,000
                           Population by Year of Diagnosis & Race/Ethnicity, New Mexico, 2010—2019

                                    African Am.       AI/AN          Asian/PI          Hispanic      White            Multi-race

                           30
        Rate per 100,000

                           20

                           10

                             0
                                 2010     2011     2012       2013     2014      2015       2016    2017       2018       2019
                                                                       Year of Diagnosis

                                                                                                                         9|Page
Figure 1.3 Rate of New Diagnoses of HIV Infection Among Adults & Adolescents per 100,000
Population by Year of Diagnosis & Age (Years) at Diagnosis, New Mexico, 2010—2019
13-24 25-34 35-44 45-54 55+
25.0
20.0
Rate per 100,000
15.0
10.0
5.0
0.0
2010 2011 2012 2013 2014 2015 2016 2017 2018 2019
Year of Diagnosis
Figure 1.4 Percent of New Diagnoses of HIV Infection Among Adult & Adolescent Males* by Year
of Diagnosis & Transmission Category, New Mexico, 2010—2019
MSM IDU MSM/IDU Sex with Women Sex with Women, HR NIR or NRR
100%
90%
80%
70%
60%
Percent
50%
40%
30%
20%
10%
0%
2010 2011 2012 2013 2014 2015 2016 2017 2018 2019
Year of Diagnosis
10 | P a g eFigure 1.5. Percent of New Diagnoses of HIV Infection Among Adult & Adolescent Females* by Year of
Diagnosis & Transmission Category, New Mexico, 2010—2019
IDU Sex with Men Sex with Men, HR Perinatal NIR or NRR
100%
90%
80%
70%
60%
Percent
50%
40%
30%
20%
10%
0%
2010 2011 2012 2013 2014 2015 2016 2017 2018 2019
Year of Diagnosis
HR (High risk), IDU (Injection drug user), NIR or NRR (No identified risk or no reported risk)
*Does not include transgender persons
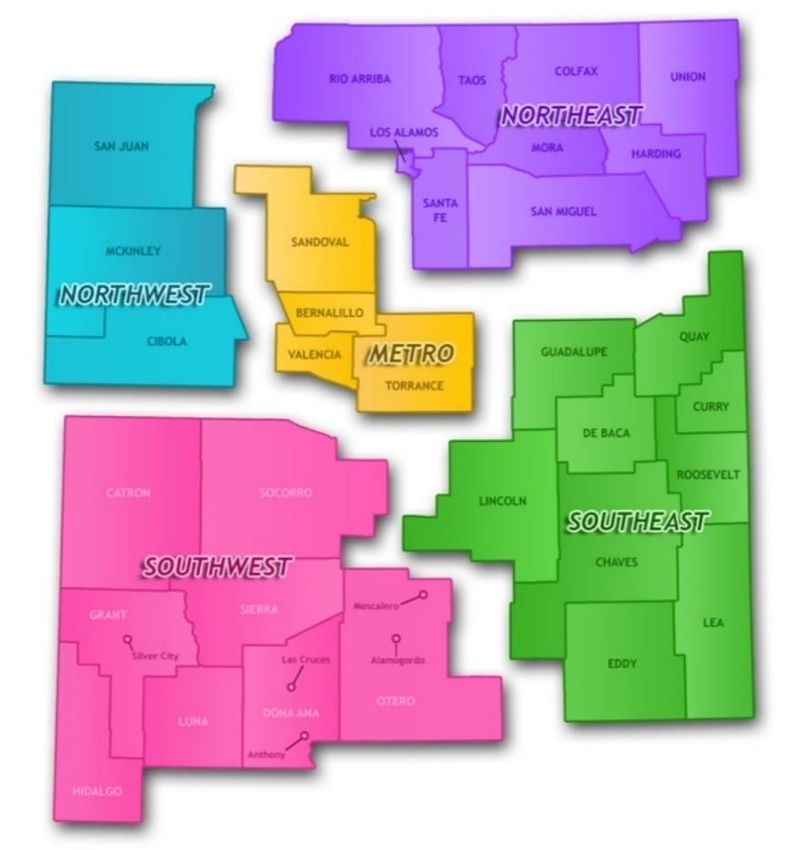
NMDOH has categorized the state into five regional areas for public health as a tool for planning and
resource allocation. Since 2014, the Northwest Region had the highest rate of new HIV infections, peaking in 2018
with 15.3 per 100,000. In 2019 this rate decreased by 20.9% to 12.1 per 100,000 (Figure 1.6). In contrast, rates of
new HIV infection increased in the other four public health regions between 2018 and 2019. The largest increase
was observed in the Southwest Region, where the proportion of HIV new infections went from 14.2% to 18.2%,
an almost 50% change in rate from 5.8 to 8.7 per 100,000. The highly populated Metro Region had the largest
number (n=70) of new HIV diagnoses in 2019, with a rate of new infections that went from 7.2 per 100,000 in
2018 to 9.0 per 100,000 in 2019. Rates in the Southeast Region increased by 28.3 % compared to 2018.
11 | P a g eFigure 1.6 New Diagnoses of HIV Infection Among Adults & Adolescents by Year of Diagnosis & Region,
New Mexico, 2010—2019
Northwest Northeast Metro Southeast Southwest
15.0
Rate per 100,000
10.0
5.0
0.0
2010 2011 2012 2013 2014 2015 2016 2017 2018 2019
Year of Diagnosis
12 | P a g eNEWLY DIAGNOSED STAGE 3 HIV INFECTIONS (i.e., AIDS)
During 2019, 36 individuals were newly classified as having a Stage 3 HIV Infection (i.e., AIDS) (Table 1.2).
This continued the general downward trend among males over the past 10 years (Figure 1.7). After a continuous
slight increase of new Stage 3 diagnoses in females over three years, from 0.5 per 100,000 in 2016 to 0.9 in 2018,
the rate decreased in 2019 to 0.6 per 100,000. No transgender women or transgender men were classified as
Stage 3 in 2019. Rates of new Stage 3 infections decreased among all racial/ethnic groups from 2018 to 2019,
except among Whites, with a rate increase of 27.3%. However, changes in rates of new Stage 3 infections may not
be significant due to the small number of cases (i.e., ≤20) diagnosed each year. Although the largest proportion of
new Stage 3 infections were among Hispanics (50.0%), African Americans had the highest new Stage 3 HIV rate in
2019 (5.1 per 100,000) (Figure 1.8).
Figure 1.7 Rate of New Stage 3 HIV Infection (i.e., AIDS) Among Adults & Adolescents per 100,000
Population by Year of Diagnosis & Sex, New Mexico, 2010—2019
Male Female
15.0
Rate per 100,000
10.0
5.0
0.0
2010 2011 2012 2013 2014 2015 2016 2017 2018 2019
Year of Diagnosis
From 2018 to 2019, there was a 62.5% reduction in the number of new Stage 3 infections among persons
25 to 34 years of age from 16 to 6; and a 33.3% increase in adults aged 35 to 44 years from 9 to 12 (Table 1.2). In
2019, the highest rate of new Stage 3 infections was in adults 35-44 years, with an annual increase from 3.6 to 4.7
per 100,000, whereas rates in persons 13-24 years and 45 years and older remained about the same (Figure 1.9).
13 | P a g eOverall, there was a decrease of new Stage 3 rates in all public health regions of New Mexico, excluding
the Northeast Region that had an increase of 34.8% from 2.3 to 3.1 per 100,000 from 2018 to 2019 (Figure 1.12).
The proportion of persons who developed Stage 3 HIV infection or AIDS within 12 months after a diagnosis
of HIV decreased from 25.2% to 14.9% between 2018 and 2019 (data not shown).
Figure 1.8 Rate of New Stage 3 HIV Infection (i.e., AIDS) Among Adults & Adolescents per 100,000
Population by Year of Diagnosis & Race/Ethnicity, New Mexico, 2010—2019
African Am. AI/AN Asian/PI Hispanic White Multi-race
25.0
20.0
Rate per 100,000
15.0
10.0
5.0
0.0
2010 2011 2012 2013 2014 2015 2016 2017 2018 2019
Year of Diagnosis
14 | P a g e15 | P a g e
Figure 1.9 Rate of New Stage 3 HIV Infection (i.e., AIDS) Among Adults & Adolescents per 100,000
Population by Year of Diagnosis & Age at Diagnosis, New Mexico, 2010—2019
                                            13-24           25-34        35-44          45-54        55+

                14.0

                12.0

                10.0
 Rate per 100,000

                    8.0

                    6.0

                    4.0

                    2.0

                    0.0
                           2010     2011        2012       2013     2014      2015      2016      2017     2018      2019
                                                                    Year of Diagnosis

                    Figure 1.10 Percent of New Stage 3 HIV Infection (i.e., AIDS) Among Adult & Adolescent Males per
                    100,000 Population by Year of Diagnosis & Transmission Category, New Mexico, 2010—2019

                           MSM     IDU      MSM/IDU        Sex with Women    Sex with Women, HR      Perinatal    NIR or NRR
                    100%
                    90%
                    80%
                    70%
                    60%
Percent

                    50%
                    40%
                    30%
                    20%
                    10%
                     0%
                            2010         2011       2012     2013    2014      2015    2016        2017      2018      2019
                                                                     Year of Diagnosis

                                                                                                                    16 | P a g e
Figure 1.11 Percent of New Stage 3 HIV Infection (i.e., AIDS) Among Adult & Adolescent Females per
100,000 Population by Year of Diagnosis & Transmission Category, New Mexico, 2010—2019
IDU Sex with Men Perinatal NIR or NRR Sex with Men, HR
100%
90%
80%
70%
60%
Percent
50%
40%
30%
20%
10%
0%
2010 2011 2012 2013 2014 2015 2016 2017 2018 2019
Year of Diagnosis
Figure 1.12 Rate of New Stage 3 HIV Infection (i.e., AIDS) Among Adults & Adolescents per 100,000
Population by Year of Diagnosis & Region, New Mexico, 2010—2019
Northwest Northeast Metro Southeast Southwest
10.0
8.0
Rate per 100,000
6.0
4.0
2.0
0.0
2010 2011 2012 2013 2014 2015 2016 2017 2018 2019
Year of Diagnosis
17 | P a g eSECTION 2: DIAGNOSED HIV INFECTION OR WITH HIV INFECTION EVER CLASSIFIED AS STAGE 3 (I.E.,
AIDS)
By the end of 2019, a total of 3,954 persons were living with HIV infection (Stages 1 through 3) in New
Mexico. More than half or 52.9% of these New Mexicans were diagnosed with Stage 3 HIV infection in their
lifetime. Males comprised 86.7% of the population living with HIV infection, followed by females (12.1% ),
transgender women (1.2% %) and transgender men (0.1%) (Table 2). The highest prevalence rate was in African
Americans (658.8 per 100,000) followed by AIANs (224.3 per 100,000) and Hispanics (219.7 per 100,000). Looking
at all stages of HIV infection in each racial/ethnic group, there was a higher proportion of HIV Stage 1 and 2
infections compared to Stage 3 infection in every group except for White and Multi-race New Mexicans who had
a higher proportion of Stage 3 infections. The highest number of individuals living with HIV infection (Stages 1
through 3) were in the 55+ age group (n=1,477), followed by the 45—54 (n=997), 35—44 (n=769), 25—34 (n=604),
and 13—24 (n=107), reflecting the fact that individuals aged with the disease due to new medications and
treatment options. The majority of persons living with HIV infection (50.5%) resided in the Metro Region, followed
by the Northeast Region (17.3%) and the Southwest Regions (15.7%).
As there are still difficulties in collecting adequate information about gender identity, the number of
transgender individuals living with HIV was likely underreported in New Mexico. Of the 49 transgender persons
living with HIV in New Mexico, 93.9% identified as Male to Female (MTF) and 6.1% identified as Female to Male
(FTM). The largest percentage of cases were in the 25 - 34 years age group (33%) followed by 35-44 (27%) and 45-
54 (20%) years (Figure 2.1). Hispanic persons were the most prevalent racial/ethnic group (51%) among the HIV-
positive transgender community. Most transgender persons living with HIV resided in the Metro Region (43%),
followed by the Northwest (27%) and Southwest (18%) Regions. This Annual Report of Cases Through 2019
updated and revised the risk definition for transgender women that have sex with men from MSM to “sex with
men,” more appropriately defining this risk factor. As transgender people are disproportionately affected by HIV,
with an HIV prevalence of 9.2% compared to 0.5% in the overall United States adult population, it is important to
collect complete information on sex and gender identity so that data can be used to design, target, and evaluate
HIV prevention programs.3
3https://www.cdc.gov/hiv/pdf/policies/cdc-hiv-transgender-brief.pdf.
18 | P a g e19 | P a g e
Figure 2.1. Transgender Individuals Living with HIV at Any Stage in New Mexico in 2019 by A) Age
Group, B) Race/Ethnicity, and C) New Mexico Public Health Region

A) Age Group                                             B) Race/Ethnicity
      13-24    25-34     35-44    45-54      55+                 African Am    AI/AN   Hispanic   White    Multi-race

                                                                                       2%

                 14%     6%                                                    18%          10%
                                       33%                                                            18%
     20%

                   27%                                                          51%

 C) NM Public Health Region

                           Northwest      Northeast      Metro    Southeast     Southwest

                                                   18%           27%
                                 6%

                                                                          6%

                                                   43%

SECTION 3: NEW DIAGNOSES OF HIV INFECTION AND PERSONS LIVING WITH DIAGNOSED HIV
INFECTION BY NM PUBLIC HEALTH REGION

        The largest number of persons living with HIV infection in 2019 resided in the Metro Region (n=1,998);
however, the region with the highest prevalence rate of HIV was the Northeast (267.8 per 100,000) (Table 2).

        Compared to other regions, the Northeast Region, which includes large cities like Santa Fe, had the largest
proportion of HIV positive individuals who were White (47.4%) (Table 3.2). Most persons living with HIV in the
Northeast Region were 55+ years old (50.7%), making this region of the state by far the “oldest” when it comes to
HIV infected individuals, followed by the Metro Region (37.9%). The Northeast Region had an exceptionally high

                                                                                                      20 | P a g e
rate of African Americans (919.2 per 100,000) living with HIV, followed by the Metro Region (811.4 per 100,000).
(Table 3.3).
Approximately 60% of the New Mexico AIAN population resides in the Northwest Region on tribal lands
of the Navajo Nation, Zuni Pueblo, and the Jicarilla Apache Tribe. The Northwest Region had the highest number
(n=209 ) and proportion (52.1%) of HIV infections among AIAN in the state (Table 3.1). However, the highest rate
of prevalent HIV infections among AIAN individuals was in the Metro Region (259.7 per 100,000) (Table 3.3),
followed by the Northwest Region (228.0 per 100,000). The highest rate of diagnosed HIV infection among females
was in the Northwest Region (73.4 per 100,000), followed by the Southwest (62.9 per 100,000) (Table 3.5) and
Northeast (52.9 per 100,000) Regions.
Although transmission risk in New Mexico was mostly MSM for males and heterosexual contact with men
for females, injection drug use was a common factor for transmission, especially in the Southwest (8.6% ) and
Northwest (8.4% ) Regions among males; and in the Metro (25.9%) and Southwest (23.2%) Regions in females.
21 | P a g e22 | P a g e
23 | P a g e
24 | P a g e
25 | P a g e
26 | P a g e
SECTION 4: DEATHS AND SURVIVAL AFTER A DIAGNOSIS OF HIV INFECTION OR STAGE 3 HIV
INFECTION (I.E., AIDS)

                      The number of deaths among persons living with HIV or Stage 3 HIV Infection in New Mexico has been
relatively stable over the past 10 years (Figure 4.1). The total numbers of deaths among both HIV Stage 1 and 2
and Stage 3 classified individuals increased over the last 3 years from 64 in 2017 to 97 in 2019. The number of
deaths among persons with Stage 3 infections also increased over this time period, with 26 deaths in 2019. Deaths
among persons who have HIV, but not a Stage 3 diagnosis were higher than in the previous 2 years, but consistent
with the annual number of deaths seen in the last 10 years.

                      During the 2010—2014 period (i.e., the most recent period with 1, 3 and 5 years of complete survival
data), survival after diagnosis with Stage 3 HIV infection has remained high after 5 years (85.9%). The 5-year
survival rate for women (79.0%) was lower than men (86.7%) (Table 4). Both 3-year and 5-year survival rates
decreased with age, with persons 55 years and older having the lowest 5-year survival rate (72.0%). American
Indian/Alaska Native persons with Stage 3 infection had the lowest survival rate with more than 1 in 4 people
dying within 60 months and 1 in 9 within the first year. Asian and Pacific Islander had the best odds of survival
after 5 years (100%) followed by Multiracial individuals (94.7%), Whites (90.9%), and Hispanics (86.5%). Individuals
with no reported or identified risk (76.9%) had the lowest chance of survival after 5 years followed by HIV positive
men that had sex with women (77.8%) .

 Figure 4.1 Deaths of Persons with Diagnosed HIV Infection or Stage 3 (i.e., AIDS), by Year of Death,
 New Mexico, 2011—2019

                                   HIV diagnosis (Never Stage-3)       Stage-3 diagnosis     TOTAL deaths
                     120

                     100
  Number of deaths

                     80

                     60

                     40

                     20

                      0
                            2011        2012       2013        2014       2015        2016   2017      2018   2019
                                                                      Year of Death

                                                                                                              27 | P a g e
28 | P a g e
STRENGTHS AND LIMITATIONS

           HIV surveillance reports are not representative of all persons infected with HIV because not all infected
persons have been tested and reported to NMDOH. According to the CDC, it is estimated that about 14.2% (or 1
in 7) of HIV infections are not detected yet and individuals may live for years with an untreated HIV infection.4 It
is also possible that some individuals tested and diagnosed with HIV have not been reported to the NMDOH. The
data presented in this report provide a minimum estimate of New Mexico residents known to be infected with
HIV.

           Due to the ongoing nature of HIV data collection, readers may notice differences between the statistics
reported across annual reports. These differences result from a variety of factors including: the national interstate
de-duplication process (i.e., Routine Interstate De-Duplication Report, a.k.a, ‘RIDR’), Enhanced HIV/AIDS Reporting
System (eHARS) database conversions and updates, data quality checks, and occasional redefinition of terms. As
it is difficult for NMDOH to monitor migration of individuals into and out of New Mexico, the most recent known
address may not reflect current residence.

           Another consideration involves incidence estimation. To monitor the cases, it is ideal to estimate ‘true
incidence’ using the date of infection. There exist specific laboratory methods that can estimate the date of
infection; however, these methods are not available in New Mexico. Therefore, because the actual date of
infection for an individual is not known, this report emphasizes new diagnoses of HIV rather than incidence of HIV
infection.

           Data on transgender individuals is particularly subject to limitations. Information on transgender
individuals is dependent on reporting health care providers indicating them as such in case report forms sent to
the NMDOH HIVSEP; however, given issues of stigma and lack of awareness among health care providers, it is
likely that the data reported here are an underestimate of the burden in the state.

           The NMDOH HIVSEP actively obtains data (e.g., Vital Records of NM, Social Security, and National Death
Reports) annually to determine the number of deaths among HIV-infected individuals in addition to what was
directly reported to the surveillance program. This typically includes all individuals living in New Mexico as well
as deaths that occurred out of state.

4Centersfor Disease Control and Prevention. Estimated HIV incidence and prevalence in the United States, 2010–2016; Table 7, page 47.
HIV Surveillance Supplemental Report 2019;24(No. 1).

                                                                                                                       29 | P a g e
Individuals who have tested out of state and are not currently seeking care in New Mexico may not be
included in this report because reporting issues between different states. Despite these limitations, HIV
surveillance data in most of the states are more than 85% complete.5 For this reason, epidemiologic surveillance
data are one of the major sources to inform both HIV prevention and HIV care planning.
Lastly, in some instances, analyses in this report were conducted using a small number of events (e.g., the
number of diagnoses of HIV infection within a certain age group). A small number of events can lead to concerns
about statistical reliability and validity. Over time, small numbers may fluctuate due to random variation, rather
than true changes in the epidemic. Readers are cautioned against drawing formal conclusions from data included
in this report that may be subject to reliability and validity concerns. Please contact HIVSEP with any questions or
concerns you may have about any of the estimates published in this report.
DATA SOURCES
HIV CASE SURVEILLANCE DATA
All persons with HIV Stage 1/2 or Stage 3 HIV infection (i.e., AIDS) who are diagnosed or treated in New
Mexico are required be reported to the HIV Epidemiology and Surveillance Program at the NMDOH based on the
New Mexico Administrative Code (Section 7.4.3). All laboratory-confirmed positive HIV antibody tests, tests for
HIV RNA or HIV DNA (i.e., viral loads), tests to detect HIV proteins, any positive HIV culture, or any other tests or
conditions indicative of HIV infection or Stage 3 HIV infection, including opportunistic infections, are reportable
to NMDOH. Stage 3 HIV infection has been a statutorily reportable condition in the state of New Mexico since
1988 and HIV since 1998. As of February 29th, 2014, all CD4 lymphocyte counts and percentages became
reportable too.
Standardized case report forms are used to collect sociodemographic information, transmission risk
categories, laboratory and clinical information, perinatal exposure, vital status, and referrals for treatment or
services. To allow for reporting delays, 2019 data are considered complete at the end of December 2020.
POPULATION DATA
The New Mexico population data were obtained from the DOH New Mexico Indicator-Based Information
System (NM IBIS) (https://ibis.health.state.nm.us/query/builder/pop/PopCnty/Count.html) query module and
represent revised estimates from the University of New Mexico, Geospatial and Population Studies (GPS;
5HallHI, Song R, Gerstle JE III, Lee LM (on behalf of the HIV/AIDS Reporting System Evaluation Group) (2006) Assessing the completeness
of reporting of human immunodeficiency virus diagnoses in 2002–2003: capture-recapture methods. Am J Epidemiol. 164:391–397.
30 | P a g ehttp://www.unm.edu/~bber). GPS conducts economic and demographic research and analyses related to New
Mexico and provides population estimates for the state based on the 2011 U.S. Census Tracts. Intercensal
population estimates were re-calculated after the release of the 2011 census, so they will not match earlier 2000
postcensal estimates from GPS. Race/ethnicity categorizations were determined by the NMDOH.
TECHNICAL NOTES
NEW DIAGNOSES OF HIV INFECTION
These data include newly diagnosed HIV infections during a specific calendar year. This may include
individuals that meet the CDC surveillance definition for Stage-3 (AIDS) at the time of their initial diagnosis of HIV
(i.e., concurrent diagnosis). The number of new HIV diagnoses only reflects HIV infections of persons that reside
in New Mexico during the in the year of interest. Individuals moving to New Mexico and that have been diagnosed
with HIV infection and reported in another state or country are excluded. Age-group assignment is based on the
person’s age at the time of diagnosis.
PERSONS LIVING WITH DIAGNOSED HIV INFECTION
Our prevalence data includes all New Mexicans living with HIV infection, including those with a Stage 3
(AIDS) classification, as of December 31st, 2019. To be included in the dataset, a person must reside in New Mexico
as of December 31, 2019. Using code from CDC, a point in time address as of the end of 2019 was used to
determine New Mexico residence. Age-group assignment was based on the person’s age as of December 31, 2019.
Persons are presumed alive until their death is notified to NMDOH or indicated in other yearly population reports
including the NMDOH Bureau of Vital Records and Health Statistics annual mortality data.
RACE AND ETHNICITY
NMDOH collects race and ethnicity data according to the U.S. Department of Health and Human Services
Office of Management and Budget (OMB) standards.6 These standards provide five categories in regard to race:
American Indian or Alaska Native, Asian, Black or African American, Native Hawaiian or other Pacific Islander, and
White. The OMB standards also provide two categories for ethnicity (independent of race): Hispanic or Latino,
and Not Hispanic or Latino. In this report the size of race and ethnicity groups were calculated according to the
NMDOH guidelines. These guidelines combine race and ethnicity into a single construct for data presentation.
Persons of Hispanic or Latino ethnicity were classified as Hispanic without consideration of reported race. Persons
not of Hispanic or Latino ethnicity were classified according to race. NMDOH recognizes that these categories are
6Federal Register (October 30, 1997) Revisions to the Standards for the Classification of Federal Data on Race and Ethnicity (Notice of
Decision) 26:210, 58782.
31 | P a g esocial-political constructs and do not interpret them as being biologic or anthropologic in nature; rather, the
categories provide a common language for uniformity and comparability in the collection and use of data.
TRANSMISSION CATEGORIES
NMDOH summarizes a person’s possible HIV risk factors using a hierarchical order of possible risks for
transmission. Persons whose transmission category is classified as MSM (male-to-male sexual contact) include
men who report sexual contact with other men and men who report sexual contact with both men and women.
Persons whose transmission category is classified as high risk heterosexual (HRH) contact include individuals who
report heterosexual contact with a person known to have, or to be at high risk for, HIV infection (e.g., heterosexual
sexual contact with bi-sexual males, injection drug users, persons with hemophilia, HIV-infected transfusion
recipient, or other HIV-infected persons with unknown risk). Persons whose transmission category is classified as
IDU are persons who report injecting illicit or nonprescription drugs. Except for men who report sexual contact
with other men and injection drug use, persons with more than one reported risk factor are classified according
to the category listed first in the hierarchy. Men who report sexual contact with other men and injection drug use
comprise a separate transmission risk category, MSM/IDU. Persons with no reported exposure to HIV through any
of the categories in the hierarchy are classified as “no risk factor identified or reported” (NIR or NRR).
Changes to the reporting of transmission risk categories in the Annual Report of Cases Through 2019
include the following:
1) Persons who reported heterosexual contact with another person not known to have, or be at high risk
for, HIV infection and who had no other identified risk exposures are classified as “sex with men” and “sex with
women” instead of as “no risk factor identified or reported” or “NIR or NRR”; 2) transgender women who reported
sex with men and no other transmission risk factor are now classified in the risk category of “sex with men” instead
of MSM; and ; and 3) transgender men who reported sex with women and no other transmission factors would
fall into the risk category “sex with women.”
RATES
Rates per 100,000 population were calculated using population denominators provided by the Geospatial
and Population Studies (GPS), located at the University of New Mexico. Rates were calculated by dividing the total
number of the events of interest (e.g., new diagnoses of HIV infection) during a certain time period of interest
(e.g., a calendar year) by the number of individuals in a certain population within the selected time period and
multiplying by 100,000.
32 | P a g eCORRECTIONAL FACILITIES AND OTHER INSTITUTIONS
Persons imprisoned in a federal, state or county correctional or detention facility, including U.S.
Immigration and Customs Enforcement (ICE) facilities, or who were housed in a residential facility (e.g., drug
treatment facility), were included in the data presented unless otherwise noted.
ACRONYMS
AA African American
AI/AN American Indian/Alaskan Native
AIDS Acquired Immunodeficiency Syndrome
Asian/PI Asian or Pacific Islander
CDC Centers for Disease Control and Prevention
DPT NMDOH Disease Prevention Team
eHARS Enhanced HIV/AIDS Reporting System
GPS Geospatial and Population Studies
HARS HIV/AIDS Reporting System
HIV Human Immunodeficiency Virus
HIVSEP NMDOH HIV Surveillance and Epidemiology Program
HRH High risk heterosexual
IDU Injection Drug User
MSM Men who have sex with men
MSM/IDU Male injection drug users who have sex with men
NIR/NRR No identified risk/No reported risk
NM New Mexico
NMDOH New Mexico Department of Health
SEP NMDOH HIV Surveillance and Epidemiology Program
STI Sexually Transmitted Infection
DEFINITIONS
eHARS (ENHANCED HIV/AIDS REPORTING SYSTEM): A database that uses web-based technology for expanded,
document-based collection of HIV-related surveillance data.
HR (HIGH RISK CONTACT): Persons who have any history of heterosexual contact with a partner having any history
of injection drug use; a bi-sexual male (applies to females only); a person having any history of
hemophilia/coagulation disorder; a person having any history of receiving a blood transfusion; a person having
any history of receiving an organ transplant; or a person known to have HIV infection. Alternatively, persons with
a history of heterosexual contact and no other risk for HIV infection.
HIV (HUMAN IMMUNODEFICIENCY VIRUS): Diagnosis of HIV infection is defined by either laboratory or clinical
evidence, with the former preferred. Laboratory criteria requires a multitest algorithm consisting of 1) a positive
(reactive) result from an initial HIV antibody or combination antigen/antibody test, and 2) an accompanying or
subsequent positive result from a supplemental HIV test different from the initial test. Clinical criteria for a
33 | P a g econfirmed case are met by the combination of 1) a note in the medical record by a physician or other qualified
medical care provider that states the patient has HIV infection, and 2) the laboratory criteria for HIV infection
were met after physician’s note was written and/or presumptive evidence of HIV infection (e.g., receipt of HIV
antiretroviral therapy or prophylaxis for an opportunistic infection), an otherwise unexplained CD4+ T-lymphocyte
count, or an otherwise unexplained diagnosis of an opportunistic illness.
IDU (INJECTION DRUG USER): Persons who have any history of receiving an injection, either self-administered or
given by another person, of a drug that was not prescribed by a physician for this person. This includes illicit drugs
as well as prescription drugs (e.g., estrogen, testosterone, anabolic steroids, or human growth hormone) that
were not prescribed for this person.
MSM (MEN WHO HAVE SEX WITH MEN): Men who have a history of sexual contact with men or with both men
and women.
NIR OR NRR (NO IDENTIFIED OR REPORTED RISK): Persons who have no identified history of risk of exposure to
HIV, as defined by the CDC. Persons reported with no identified risk can be under investigation, have incomplete
histories because they have died, have refused to divulge their history, or have been lost to follow up.
OTHER (OTHER RISK): Persons who have a history of hemophilia or coagulation disorder, receipt of blood
transfusion, blood components or tissue, or persons who have any of the adolescent/adult risk factors for HIV
infection which occurred before age 13 years or who were born to a mother with HIV infection.
STAGE 3 HIV INFECTION (i.e., AIDS): Diagnosis of stage 3 HIV infection (i.e., AIDS) is defined as a confirmed case
that meets the criteria for diagnosis of HIV infection with 1) a CD4+ T-lymphocyte count < 200 or a CD4+ T-
lymphocyte percentage < 14% of total lymphocytes (if the CD4 count is missing or unknown); or 2) the diagnosis
of a stage 3-defining opportunistic illness.
NMDOH RESOURCES
HIV SURVEILLANCE & EPIDEMIOLOGY PROGRAM
Conducts state-wide surveillance and analysis of HIV.
(505) 476-3515
http://nmhealth.org/about/erd/ideb/haep/
HIV PREVENTION PROGRAM
Supports community planning and HIV prevention and HIV testing activities across the state, including training,
capacity building, funding, and oversight.
(505) 476-3612
http://nmhealth.org/about/phd/idb/happ/
HIV SERVICES PROGRAM
Supports a statewide array of providers in the Health Management Alliance (HMA) network that provide case
management, medical care and support services for people with HIV/AIDS.
(505) 476-3628
34 | P a g eNEW MEXICO HIV, STD AND HEPATITIS RESOURCE GUIDE
www.nmhivguide.org
COMMUNITY PARTNERS
NEW MEXICO HIV PREVENTION COMMUNITY PLANNING AND ACTION GROUP (CPAG)
This group is co-chaired by representatives from NMDOH, the community, and persons living with HIV. The
CPAG collaborates with NMDOH to develop a statewide Comprehensive HIV Prevention Plan
www.nmcpag.org/
HIV SERVICE PROVIDERS (HSP)
HSPs are non-profit organizations that offer comprehensive services including medical and case management,
support, and prevention for HIV
UNIVERSITY OF NEW MEXICO HEALTH SCIENCES CENTER (UNM-HSC), TRUMAN HEALTH SERVICES
Based in Albuquerque and serves the metro area and northwestern New Mexico in collaboration with New
Mexico AIDS Services
(505) 272-1312
http://www.unmtruman.com/
FIRST NATIONS COMMUNITY HEALTH SOURCE
Based in Albuquerque, Gallup and Farmington and serves the American Indian/Alaska Native community
(505) 262-2481
www.fnch.org
SOUTHWEST CARE CENTER (SWCC)
Based in Santa Fe, Albuquerque and Farmington and serves northeastern and central New Mexico
(888) 320-8200
www.southwestcare.org
ALIANZA OF NEW MEXICO
Based in Roswell and Las Cruces and serves southern New Mexico
(575) 623-1995
http://www.alianzaofnewmexico.org/
COMMUNITY COLLABORATIVE CARE (CCC)
Based in Las Cruces and serves southwestern New Mexico
(575) 528-5001
http://nmhealth.org/about/phd/region/sw/cccp/
35 | P a g eThis page intentionally blank.
36 | P a g eYou can also read