Development of a mechanistic dengue simulation model for Guangzhou
←
→
Page content transcription
If your browser does not render page correctly, please read the page content below
Epidemiology and Infection                            Development of a mechanistic dengue
           cambridge.org/hyg
                                                                 simulation model for Guangzhou
                                                                 G. Mincham1, K. L. Baldock1, H. Rozilawati2 and C. R. Williams3
                                                                 1
                                                                  School of Health Sciences, University of South Australia, Adelaide, SA 5001, Australia; 2Medical Entomology Unit,
           Original Paper                                        Infectious Diseases Research Centre, Institute for Medical Research, Ministry of Health Malaysia, 50588 Kuala
           Cite this article: Mincham G, Baldock KL,             Lumpur, Malaysia and 3School of Pharmacy and Medical Sciences, University of South Australia, Adelaide, SA 5001,
           Rozilawati H, Williams CR (2019). Development         Australia
           of a mechanistic dengue simulation model for
           Guangzhou. Epidemiology and Infection 147,                Abstract
           e125, 1–7. https://doi.org/10.1017/
           S095026881900030X                                         Dengue infection in China has increased dramatically in recent years. Guangdong province
                                                                     (main city Guangzhou) accounted for more than 94% of all dengue cases in the 2014 out-
           Received: 20 September 2018
                                                                     break. Currently, there is no existing effective vaccine and most efforts of control are focused
           Revised: 21 December 2018
           Accepted: 29 January 2019                                 on the vector itself. This study aimed to evaluate different dengue management strategies in a
                                                                     region where this disease is emerging. This work was done by establishing a dengue simula-
           Key words:                                                tion model for Guangzhou to enable the testing of control strategies aimed at vector control
           Aedes albopictus; dengue fever; intervention              and vaccination. For that purpose, the computer-based dengue simulation model (DENSiM)
           strategies; simulation modelling
                                                                     together with the Container-Inhabiting Mosquito Simulation Model (CIMSiM) has been used
           Author for correspondence:                                to create a working dengue simulation model for the city of Guangzhou. In order to achieve
           G. Mincham, E-mail: gina.mincham@unisa.                   the best model fit against historical surveillance data, virus introduction scenarios were run
           edu.au                                                    and then matched against the actual dengue surveillance data. The simulation model was
                                                                     able to predict retrospective outbreaks with a sensitivity of 0.18 and a specificity of 0.98.
                                                                     This new parameterisation can now be used to evaluate the potential impact of different con-
                                                                     trol strategies on dengue transmission in Guangzhou. The knowledge generated from this
                                                                     research would provide useful information for authorities regarding the historic patterns of
                                                                     dengue outbreaks, as well as the effectiveness of different disease management strategies.

                                                                 Introduction
                                                                 Dengue is the most prevalent arboviral infection among humans globally [1]. In China, dengue
                                                                 cases have been recorded each year for the past 25 years [2]. Although dengue in China is con-
                                                                 sidered to be non-endemic, a total of 55 114 dengue cases were reported between 2005 and
                                                                 2014 of which over 85% occurred in 2014 alone. The focus of this study was on
                                                                 Guangzhou (Guangdong Province) in south-east China, as 94% of the recorded dengue
                                                                 cases in 2014 were observed there [2]. Cheng et al. highlight the earlier timing of local dengue
                                                                 transmission to be one of the main determinants of the outbreak size in 2014, in particular the
                                                                 increased number of imported cases in May and June of that year. Excess rainfall in 2014 was
                                                                 also reported to have contributed to the outbreak size [3].
                                                                     The mosquito Aedes albopictus, one of the main vectors of dengue, is responsible for most
                                                                 of the dengue transmission in China, including in Guangzhou [4, 5]. Changes in climatic fac-
                                                                 tors can alter the abundance and habitat distribution of different dengue vectors including Ae.
                                                                 albopictus. A study by Kearney et al. [6] showed how different weather patterns such as warm-
                                                                 ing (increasing temperatures from 0.8 to 1.5 °C) can potentially affect water availability and
                                                                 adult and larval cold tolerance limits of dengue vector mosquitoes, which in turn has an
                                                                 impact on the species abundance and habitat availability as well as the overall mosquito sur-
                                                                 vival. The change in climatic factors is relevant to China because over the past five decades this
                                                                 country has recorded an increase in average temperatures of 1.2 °C [7]. This is estimated to
                                                                 increase even further by 1–5 °C by 2100 and increased precipitation is predicted for the south-
                                                                 ern parts of China [7].
                                                                     The incidence of dengue in Guangzhou has the potential to be influenced by changes in
                                                                 weather patterns; it is therefore important to understand the relationship between climatic fac-
           © The Author(s) 2019. This is an Open Access          tors, Ae. albopictus abundance and the occurrence of dengue outbreaks. Understanding these
           article, distributed under the terms of the
                                                                 patterns in Guangzhou will help to better develop effective public health strategies to combat
           Creative Commons Attribution licence (http://
           creativecommons.org/licenses/by/4.0/), which          the potential increases in dengue outbreaks.
           permits unrestricted re-use, distribution, and            Changes in climate and other environmental factors are important for Ae. albopictus and
           reproduction in any medium, provided the              therefore the occurrence of dengue outbreaks. Dengue simulation models can help examine
           original work is properly cited.                      the climatic factors that might be important for predicting dengue outbreaks. One particular
                                                                 dengue simulation model that is comprised of two integrated models representing human
                                                                 (DENSiM) and mosquito (CIMSiM) population parameters has been used and validated in
                                                                 Australia, Malaysia [8] and Latin America [9, 10]. Dengue simulation models such as
                                                                 DENSiM allow modelling of current and historic patterns of recorded dengue cases in relation

Downloaded from https://www.cambridge.org/core. IP address: 46.4.80.155, on 16 Feb 2022 at 13:34:18, subject to the Cambridge Core terms of use, available at https://www.cambridge.org/core/terms.
https://doi.org/10.1017/S095026881900030X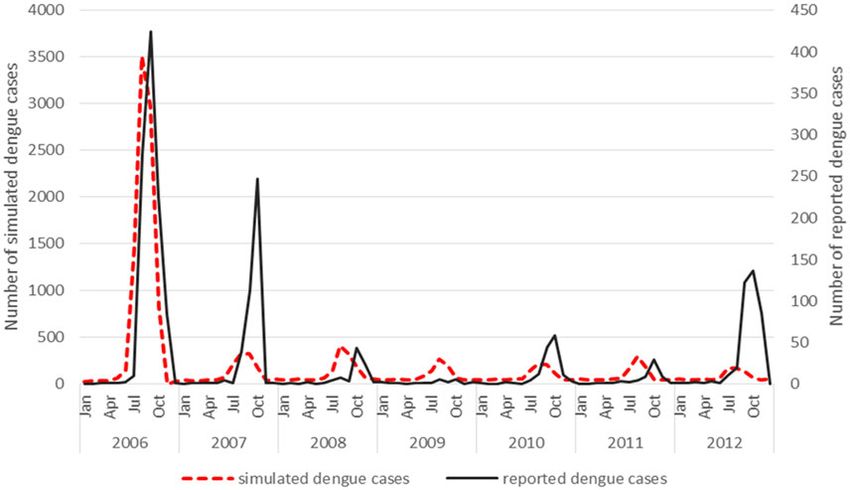
2                                                                                                                                                        G. Mincham et al.

          to mosquito population dynamics. DENSiM is coupled to an                                   Table 1. Temperature thresholds of Aedes aegypti compared with Aedes
          underlying Container-Inhabiting Mosquito Simulation model                                  albopictus, as used in DENSiM modelling [17]
          (CIMSiM) [11]. CIMSiM simulates container-breeding mosquito                                                                                      Ae.                 Ae.
          populations and DENSiM takes those mosquito populations cre-                                                                                   aegypti            albopictus
          ated in CIMSiM, and overlays them on a specific human popula-
          tion with known age structure, seroprevalence and size. The risk                             Low-temperature development                      16 °C             11 °C
                                                                                                       threshold
          of dengue transmission can then be simulated by introducing
          dengue viruses (one or multiple serotypes) into DENSiM. These                                High-temperature development                     39 °C             37 °C
          particular models have been used to model dengue transmission                                threshold
          in relation to climate change, and other models have been used                               Low lethal temperature threshold                 12 °C             10 °C
          for similar purposes (e.g. to understand the relationship between
                                                                                                       High lethal temperature threshold                43 °C             40 °C
          surface water and dengue outbreak occurrences [12], and to iden-
          tify the relationship between Aedes mosquitoes, dengue transmis-
          sion and climatic factors [13]). Although statistical modelling
          approaches have been applied previously to investigate the rela-                               To re-parameterise DENSiM for Guangzhou, the produced Ae.
          tionships between environmental variables and dengue transmis-                             albopictus population outputs from CIMSiM were overlayed on to
          sion (e.g. 14, 15), to date, such mechanistic simulation models                            the estimated human population simulated for Guangzhou in
          have not been used in China. In this study, we aimed to                                    DENSiM, to enable dengue virus transmission to be estimated.
          re-parameterise and validate the CIMSiM/DENSiM dengue simu-                                A small representative human population of 10 000 was used
          lation models for a large city in China (Guangzhou), where Ae.                             for the simulations, as this study was seeking to model a represen-
          albopictus is the primary dengue vector. We then intend in sub-                            tation of a group of people who might reasonably exist together in
          sequent work to use this model to test the potential impact of cli-                        a discrete community (e.g. in a suburb or district).
          mate change and different control strategies on dengue                                         Age-specific birth and death rates for China were obtained
          transmission.                                                                              from the United States Census Bureau [18]. All four possible den-
                                                                                                     gue serotypes were included in the simulation model. The pre-
                                                                                                     existing herd immunity for the population in this model was set
          Methods                                                                                    at 0.0542 referring to previously reported seroprevalance values
                                                                                                     [19].
          Parameterisation of CIMSiM and DENSiM for Guangzhou
          First, CIMSiM [11] was used to simulate mosquito population
                                                                                                     Model simulations
          dynamics in Guangzhou, dependent upon inputs including local
          meteorological data, mosquito food availability, availability of                           China has a comprehensive disease surveillance system that is
          various breeding sites (containers) and human demographic                                  incorporated into the network of Centres for Disease Control
          data [11].                                                                                 and Prevention (CDC). This includes both provincial and
              CIMSiM has previously been run using field-validated para-                             national level surveillance. The majority of the hospitals are dir-
          meters for the dengue vector Aedes aegypti [16]. Ae. albopictus                            ectly linked to the CDC infectious disease reporting system
          coexist with Ae. aegypti, but occupy a slightly different ecological                       [20]. The surveillance system in China for infectious disease
          niche and are adapted differently to climatic conditions. Ae. albo-                        such as dengue is mainly hospital-based, and together with the
          pictus is considered the main vector of dengue in Guangzhou [4];                           diagnostic laboratories, these form the first reporting line in dis-
          therefore, we recalibrated the CIMSiM model using field data for                           ease outbreaks [21].
          Ae. albopictus for this study.                                                                 In previous years, infectious disease monitoring and surveil-
              Ae. albopictus population data were collected in Malaysia by                           lance for diseases such as dengue were underfunded and limited
          the Institute for Medical Research, Kuala Lumpur in 2011 and                               resources were available, specifically in more rural and remote
          were provided for use in validating the simulation models for                              areas. More recently, the laboratory diagnostic methods have
          Guangzhou (RH unpubl. data). Ae. albopictus are more tolerant                              been improved. The ‘Chinese Field Epidemiology Training
          to cooler temperatures compared with Ae. aegypti [17]; thus,                               Program’ was established in 2001 which was a training pro-
          the larval and pupal cold and heat tolerance limits were adjusted                          gramme to increase the number of trained health professionals
          in CIMSiM (Table 1). Meteorological data were obtained from the                            to strengthen the surveillance programme, but by 2014, only
          World Weather Local Weather Forecast Asia (http://en.tutiempo.                             194 health care professionals graduated from this programme
          net/) (2015) for the years 2005–2012. These consisted of daily                             [20]. There is still no equal access to all of the data reported across
          maximum, minimum and average temperatures, daily rainfall                                  the different regional and provincial areas of China, and under-
          and daily humidity values for Guangzhou.                                                   reporting of cases remains a big problem in China, especially in
              Food delivery rates to mosquito larvae in CIMSiM were itera-                           the more remote regions. Due to possible under-reporting or
          tively adjusted using the ‘food fitter’ function so that mosquito                          detection of particular serotypes responsible for an outbreak,
          production (as pupae per container type) matched that of field                             the accuracy of serotypes circulating may be impacted.
          data used for calibration. The three main containers that were                                 Therefore when modelling dengue transmission, different
          used in the model were buckets, pot plant bases and tyres.                                 iterations of serotype introductions were simulated. DENSiM per-
          Whilst the three container types do not replicate all conceivable                          mits up to four different serotypes to be modelled concurrently,
          larval production sites in Guangzhou, they represent a range of                            and given the history of serotype variation in Guangzhou [22],
          possible container diversity available as well as it shows a range                         we initially produced serotype introduction regime that would
          of filling and emptying rates which adequately represent the                               mimic known serotype detections [22]. In addition, we developed
          diversity of the larval environment in the study area.                                     other serotype introduction scenarios to determine which one

Downloaded from https://www.cambridge.org/core. IP address: 46.4.80.155, on 16 Feb 2022 at 13:34:18, subject to the Cambridge Core terms of use, available at https://www.cambridge.org/core/terms.
https://doi.org/10.1017/S095026881900030X
Epidemiology and Infection 3
Table 2. Four different virus introduction scenarios used in the DENSiM model for the period 2005–12
Scenario 1 Scenario 2 Scenario 3 Scenario 4
Serotypes DENV1, DENV2, DENV3, DENV4 DENV1, DENV2, DENV3, DENV1, DENV2, DENV3, DENV4 DENV1
introduced DENV4
First year of DENV1: 2006 DENV1: 2006 DENV1: 2006 DENV1: 2006
introduction DENV2: 2009 DENV2: 2007 DENV2: 2007
DENV3: 2009 DENV3: 2008 DENV3: 2008
DENV4: 2010 DENV4: 2009 DENV4: 2009
Duration of 10 viraemic persons per week DENV1: January 2006– 10 viraemic persons a week 10 viraemic persons a week
introduction from mid-January onwards for October 2007 (10 from mid-January onwards for from mid-January onwards
each introduction year viraemic persons a each introduction year for the study period
week)
DENV2: January 2007–
October 2008 (10
viraemic persons a
week)
DENV3: January 2008–
October 2009 (10
viraemic persons a
week)
DENV4: January 2009–
October 2010 (10
viraemic persons a
week)
DENSiM: dengue simulation model; DENV: dengue virus; the introduction time and duration in the model was based on previous studies conducted on serotype circulation during dengue
outbreak periods [22].
may provide the best fit to historical dengue incidence and out- was settled upon (Table 2). Ten replications were run for each
break data. scenario and the mean number of simulated dengue cases per
Four different simulation scenarios were run (Table 2). month was calculated.
Scenario 1 involved serotypes to be introduced in different years
as not all four serotypes are responsible for the dengue outbreaks
Model outputs
each year. Based on previously reported serotype data [22] from
2003 until 2012, only the serotype reported for each year was Dengue cases
introduced in the model at the time when it occurred. DENV1 The primary output from the model simulations was the number
was introduced in 2006 in the model, DENV4 in 2010 and of prevalent dengue cases per day. Simulated dengue case data
DENV 3 and DENV 2 in 2009. DENV 3 was first detected in from the model output recorded as daily prevalent cases were
2009, whereas DENV 4 has re-emerged in 2010 after being absent compared with the reported dengue case data, recorded as num-
from the region for 20 years [22]. ber of incident cases per month, for the time period of 2006–2012.
Scenario 2 involved the introduction of a different serotype in In order to be able to assess model performance meaningfully,
each year of the first 4 years of the model simulation period. Each the simulated prevalent cases were converted to incident cases.
serotype introduction was modelled to run for a 22 months period The viraemic duration of an infected person was set to 5 days
to simulate co-circulation of serotypes within the study popula- in DENSiM and the incubation duration to 4 days. That means
tion as well as to show periods where one serotype is no longer on each day in the simulated dataset, the recorded infected per-
present and another is the more dominant serotype. This type sons from the previous 4 days have to be removed to be able to
of serotype co-circulation and dominance of one serotype over report only new (incident) cases of dengue each day. Daily inci-
different periods of time has been demonstrated by different stud- dent cases were totalled for each month to correspond to the
ies [23, 24]. Scenario 3 was run the same as scenario 2 except the recorded dengue case data.
serotype introduction periods were continuous. Lastly, scenario 4
involved the introduction of only one serotype in 2006 (DENV1). Dengue outbreaks
Different serotype introduction periods in the model were used to To assess model fit, the simulated monthly dengue case data were
account for the co-circulation of the serotypes that do occur in recoded to indicate whether an outbreak had occurred or not (1 =
Guangzhou (given the combination of imported and indigenous outbreak or 0 = no outbreak) for each month of the simulation. To
dengue cases). Additionally the better performance of scenario do this, thresholds for consideration of whether an outbreak had
4 might be explained by the likelihood that outbreaks in occurred were calculated. Three different thresholds were calcu-
Guangzhou can occur with a single dominant serotype as dis- lated to create three dengue outbreak outcome variables to test
cussed in the paper by Cheng et al. [3] which looked at the which outbreak variable allowed the best model fit [25]. The
large outbreak in 2014, where 98% of dengue cases tested were three thresholds above which an outbreak was considered to
infected by DENV-1. have occurred included incident cases exceeding (1) the mean
The exact number of infected people/travellers coming into for each month, (2) the mean plus 1.5 S.D. and (3) the mean
Guangzhou is unknown and difficult to estimate. Therefore, a plus 2 S.D.. When the number of incident dengue cases for a
number of iterations of different virus importation rates (number month was below the given threshold, no outbreak was consid-
of cases) were tested before a rate of 10 introductions per week ered to have occurred.
Downloaded from https://www.cambridge.org/core. IP address: 46.4.80.155, on 16 Feb 2022 at 13:34:18, subject to the Cambridge Core terms of use, available at https://www.cambridge.org/core/terms.
https://doi.org/10.1017/S095026881900030X4 G. Mincham et al.
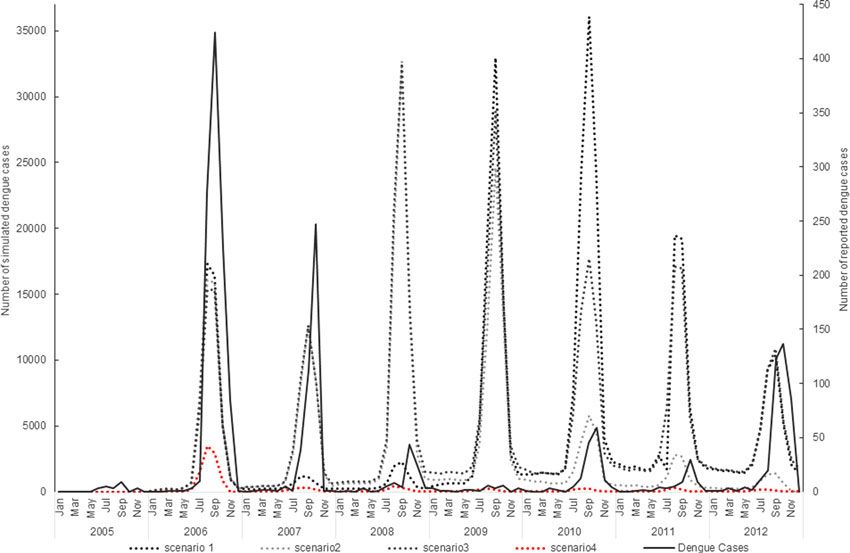
Fig. 1. Virus introduction scenarios comparing simulated and reported dengue cases. Four different simulation scenarios were run (Table 2). Scenario 1 involved
serotypes to be introduced at different points in the model, DENV1 was introduced in 2006, DENV4 in 2010 and DENV 3 and DENV 2 in 2009. Scenario 2 involved the
introduction of a different serotype in each year of the first 4 years of the model simulation period. Each serotype introduction was modelled to run for a 22 months
period to simulate co-circulation of serotypes within the study population. Scenario 3 was run the same as scenario 2 except the serotype introduction periods
were continuous. Scenario 4 involved the introduction of only one serotype in 2006 (DENV1). The four scenarios are compared with the reported dengue case data.
Table 3. Correlation coefficient for each virus introduction scenario operator characteristic curves were used to determine the best
model fit.
Virus scenario r A prediction of high incidence, for example, could lead to a
One 0.28
government department using its limited resources to utilise
costly measures such as vector control spraying, when a large out-
Two 0.37 break may not occur. Therefore, the model with the highest posi-
Three 0.32 tive predictive value (PPV) was considered for this study to have
the best model fit. Previous studies have shown that for dengue
Four 0.75
management strategies to be effective, a dengue prediction
r, Correlation coefficient. model with high PPV is desirable [26].
Identification of dengue seasonality
Table 4. Sensitivity and specificity of the final model for predicting outbreak
presence or absence using different thresholds (using scenario 4) To determine whether dengue outbreaks occur seasonally in
Guangzhou, the months were categorised into seasons. In
Threshold Sensitivity Specificity PPV NPV
Guangzhou, winter is comprised of December to February, spring
Mean 0.18 0.98 0.83 0.74 is March to May, summer covers June to August and September
to November are the autumn months. Simple linear regression
Mean + 1.5 S.D. 0.18 0.97 0.67 0.80
was used to test the probability of outbreaks occurring each
Mean + 2 S.D. 0.14 0.96 0.4 0.87 year in the same season in Guangzhou. The model simulated
S.D., standard deviation; PPV, positive predictive value; NPV, negative predictive value. number of incident cases per month was set as the dependent
variable and season was the independent variable. All analyses
were undertaken using statistical software STATA (V.14).
Assessment of model performance Statistical significance was considered at α = 0.05.
First, we analysed the validity of the dengue simulation model by
using cross-correlation analysis (in Stata, V.14) to compare the
Results
simulated case data with the reported dengue cases. Then, the
accuracy (sensitivity, specificity, positive and negative predictive The simulation model overall appeared to follow a pattern of den-
value) of each of the four model simulation scenarios was assessed gue incidence broadly consistent with reported dengue cases in
by comparing actual and predicted outbreaks per month. Receiver Guangzhou (Fig. 1).
Downloaded from https://www.cambridge.org/core. IP address: 46.4.80.155, on 16 Feb 2022 at 13:34:18, subject to the Cambridge Core terms of use, available at https://www.cambridge.org/core/terms.
https://doi.org/10.1017/S095026881900030XEpidemiology and Infection 5
Fig. 2. Virus introduction scenario 4 comparing simulated and reported dengue cases. Simulation model run from 2006 to 2012 shows the best fit with incident
case data from Guangzhou when only one serotype (scenario 4) is introduced. This was then modelled against the reported dengue cases and resulted in a cor-
relation coefficient of 0.75.
The simulation model output from DENSiM showed the best Table 5. The occurrence of dengue incidences in relationship to the different
fit with incident case data from Guangzhou when only one sero- seasons
type (scenario 4) was introduced in the virus introduction scen- Incident cases Coefficient CI 95% p-value
arios, based on cross-correlation results, even though multiple
serotypes do exist in nature. Summer Reference
Scenario 4 resulted in a correlation coefficient of 0.75, which Autumn −72.2 −383.0 to 238.5 0.65
reflects the highest correlation between the actual simulated den-
gue incidences in Guangzhou, out of all four scenarios simulated Winter −348.1 −658.9 to −37.4 0.03
(Table 3). Spring −345.9 −656.7 to −35.1 0.03
Virus introduction scenario 4 predicted outbreaks with a PPV CI, confidence interval.
of 0.83, a sensitivity of 0.18 and a specificity of 0.98 when apply-
ing a mean threshold for the outbreak/no outbreak months
(Table 4). However, some slight underprediction of cases still likely to occur in spring and winter compared with summer. No
occurs in the model in 2007 and 2012 (Fig. 2). significant difference was found between autumn and summer.
The underprediction of the model in year 2007 and 2012 could
be explained by the fact that the actual PPV in the field is poten-
tially lowered due to the accuracy of reported cases and the cur-
Discussion
rent surveillance system is not capturing all of the serotypes,
micro climatic factors that need to be considered that may influ- Using the DENSiM dengue model, a working simulation of den-
ence the conditions in the field could also impact on the PPV that gue incidence in Guangzhou was created. The model outputs
the model does not account for. The estimated biting rates (con- replicated observed dengue transmission dynamics, albeit with
tact between person and mosquito) may be higher in some areas underprediction of dengue activity in 2007 and 2012. The virus
where Ae. aegypti coexists with Ae. albopictus which is not introduction scenario, using a single serotype, showed the best
reflected in the model as Ae. albopictus has been reported as model fit to the actual dengue transmission occurring in
the main vector in Guangzhou and therefore only one species Guangzhou, even though multiple serotypes do occur in the
has been included in the simulation model. The NPV may there- area and are responsible for different outbreaks each year.
fore be affected in the field as areas where Ae. aegypti coexists with There are several potential reasons why the developed dengue
Ae. albopictus have not been factored into this model. This would simulation model did not work as well using multiple serotypes in
have an impact on biting rates and the contact rate between mos- the virus introduction scenarios. First, there is a possible existing
quito and human. bias in the reporting of actual dengue cases which can lead to
A seasonal trend can be observed when the dengue cases are under-reporting of the magnitude of an outbreak, or even the
plotted over the study period 2006–2012. Cases tend to occur incidence of dengue in a given time period if cases have not
between July and November (summer and autumn) each year been recorded [27]. Another reason is the set simulated popula-
(Fig. 2). The results of the simple linear regression (Table 5) con- tion size which differs from the actual population size, due to
firmed this, showing that dengue transmission is significantly less computer simulation capacities of the dengue model used. This
Downloaded from https://www.cambridge.org/core. IP address: 46.4.80.155, on 16 Feb 2022 at 13:34:18, subject to the Cambridge Core terms of use, available at https://www.cambridge.org/core/terms.
https://doi.org/10.1017/S095026881900030X6 G. Mincham et al.
may influence modelled outbreak size and dynamics. Lastly, a not used as a measure to identify the effectiveness of reducing
potential issue could be the different localised weather conditions dengue transmission once the control has been applied. For this
in Guangzhou. The model cannot account for small temperature purpose, the model is acceptable, having a relatively high PPV
fluctuations, which also have an influence on the local mosquito of 0.83, meaning outbreak occurrences are well predicted. Not
population activity profiles in the different areas of the city as all measures are controllable or accounted for in the simulation
microclimates and habitat availability can vary greatly within a scenario. Issues such as under-reporting, inaccuracies in the num-
large city such as Guangzhou. ber of infected travellers and the inability to account for micro cli-
The dengue model that has been developed in this study may mates affecting mosquito population dynamics may affect the
have worked best with a single serotype introduction as one virus model’s ability to simulate outbreaks. Overall however, the
strain can be more prevalent throughout an outbreak over longer model reflects dengue transmission dynamics in Guangzhou
periods of time or for a single outbreak period. This was demon- and may allow the assessment of the effectiveness of dengue con-
strated in the 2013 outbreak in Yunnan Province where DENV 3 trol strategies.
was the main serotype recorded [28]. This is the first time, based on current knowledge of the litera-
The study by Sang et al. [23] also showed that of all four den- ture, that the dengue model CIMSiM–DENSiM has been repara-
gue serotypes being detected in Guangzhou, DENV 1 was the pre- meterised for the mosquito species Ae. albopictus, and its first
dominant serotype reported, supporting the findings from this application in China to simulate dengue outbreak occurrences.
study that the best model fit using virus introduction scenario 4 This is significant and allows the utility of this model to be
(using just the DENV1 serotype) is a plausible simulation for den- extended into other contexts, particularly in Asia where Ae. albo-
gue transmission dynamics in Guangzhou. The simulated dengue pictus is the predominant dengue vector. This new parameterisa-
transmission in Guangzhou using one serotype only was most tion can now be used to evaluate the potential impact of different
successful at demonstrating the reported dengue transmission in vector control strategies or increased temperature scenarios (such
the area over the 2006–2012 period. This can possibly be as under climate change) on dengue transmission in Guangzhou.
explained by the findings of Sang et al. [23] who found that den-
gue viruses (different serotypes with various genotypes) are likely Author ORCIDs. Gina Mincham, 0000-0003-2337-4753
to be reintroduced to Guangzhou from other countries. The dif- Acknowledgements. I would like to acknowledge the CDC in China for
ferent dengue serotypes, therefore, have not been able to establish their help in sourcing the dengue case data and Dr Alana Hanson from the
an endemic cycle of dengue virus transmission in the area, poten- University of Adelaide for her support on obtaining dengue case data and put-
tially leading to one serotype to be more dominant in an outbreak ting this paper together. Lastly the CIMSiM model would not have been able
period over another even though multiple genotypes have been to be parameterised without the help of the mosquito population data pro-
detected in Guangzhou. vided by Rozilawati Harun. We also would like to thank the Director
Additionally, the better performance of scenario 4 might be General of Health, Malaysia for his permission to publish this paper.
explained by the likelihood that outbreaks in Guangzhou can Conflict of interest. None.
occur with one more dominant serotype as discussed by Cheng
et al. [3] when they looked at the large outbreak in 2014, where
98% of cases tested were infected by DENV-1. The poorer per-
formance of the model when multiple serotypes are used could References
be due to the reported serotypes not reflecting the reality of the
1. Guzman MG and Harris E (2015) Dengue. The Lancet 385, 453–465.
field surveillance conducted. Field surveillance may not be suffi- 2. Cheng Q et al. (2016) Climate and the timing of imported cases as deter-
cient enough to detect all serotypes, this may lead to the model minants of the dengue outbreak in Guangzhou, 2014: evidence from a
underpredicting cases as well as the modelling being based on mathematical model. PLoS Neglected Tropical Diseases 10, p. e0004417.
an estimated 10 viraemic persons being introduced, this may 3. Cheng Q et al. (2017) The interplay of climate, intervention and imported
not be representative enough of the actual number (imported cases as determinants of the 2014 dengue outbreak in Guangzhou. PLoS
and indigenous cases). Neglected Tropical Diseases 11, e0005701.
Notwithstanding these limitations, the developed mechanistic 4. Wu JY et al. (2010) Dengue fever in mainland China. The American
simulation model for dengue transmission in Guangzhou displays Journal of Tropical Medicine and Hygiene 83, 664–671.
the seasonal transmission patterns of dengue, highlighting the 5. Xiang J et al. (2017) Association between dengue fever incidence and
meteorological factors in Guangzhou, China, 2005–2014. Environmental
increased transmission times in summer and autumn. A study
Research 153, 17–26.
by Li et al. [29] supports these findings showing that both 6. Kearney M et al. (2009) Integrating biophysical models and evolutionary
imported as well as indigenous dengue cases were relatively rare theory to predict climatic impacts on species’ ranges: the dengue mosquito
in spring or winter, with increased cases in summer and peak Aedes aegypti in Australia. Functional Ecology 23, 528–538.
number of cases recorded for autumn. 7. Piao S et al. (2010) The impacts of climate change on water resources and
Even though the dengue transmission model for Guangzhou agriculture in China. Nature 467, 43–51.
closely simulated the reported dengue transmission, there are 8. Williams CR et al. (2015) Testing the impact of virus importation rates
some limitations in the model, such as under-reporting of the and future climate change on dengue activity in Malaysia using a mechan-
dengue outbreak size still occurred in the years 2007 and 2012. istic entomology and disease model. Epidemiology and Infection 143,
Based on some of the difficulties measuring exact outbreak size 2856–2864.
9. Ayala RG and Estrugo A (2014) Assessing the effects of climate and
and dengue importation rates, perfect function of the model is
socioeconomic factors on vulnerability to Vector-Borne Diseases in
not expected (nor required) for moving forwards to test the differ- Latin America.
ent disease control strategies. 10. Focks DA et al. (1995) A simulation model of the epidemiology of urban
This study models outbreak occurrences (dengue cases dengue fever: literature analysis, model development, preliminary valid-
reported or not) and the accuracy of these can allow the assess- ation, and samples of simulation results. American Journal of Tropical
ment of the different dengue control strategies. Outbreak size is Medicine and Hygiene 1995; 53, 489–506.
Downloaded from https://www.cambridge.org/core. IP address: 46.4.80.155, on 16 Feb 2022 at 13:34:18, subject to the Cambridge Core terms of use, available at https://www.cambridge.org/core/terms.
https://doi.org/10.1017/S095026881900030XEpidemiology and Infection 7
11. Focks DA et al. (1993) Dynamic life table model for Aedes aegypti 20. Tong MX et al. (2015) Infectious diseases, urbanization and climate
(Diptera: Culicidae): simulation results and validation. Journal of change: challenges in future China. International Journal of
Medical Entomology 30, 1018–1028. Environmental Research and Public Health 12, 11025–11036.
12. Thai KT and Anders KL (2011) The role of climate variability and change 21. Zhang L and Wilson DP (2012) Trends in notifiable infectious diseases in
in the transmission dynamics and geographic distribution of dengue. China: implications for surveillance and population health policy. PLoS
Experimental Biology and Medicine 236, 944–954. ONE 7, e31076.
13. Morin CW, Comrie AC and Ernst K (2013) Climate and dengue trans- 22. Guo RN et al. (2014) The prevalence and endemic nature of dengue infec-
mission: evidence and implications. Environmental Health Perspectives tions in Guangdong, South China: an epidemiological, serological, and
(Online) 121, 1264. etiological study from 2005–2011. PLoS ONE 9, p. e855969.
14. Sang S et al. (2014) Predicting local dengue transmission in Guangzhou, 23. Sang S et al. (2015) Dengue is still an imported disease in China: a case
China, through the influence of imported cases, mosquito density and cli- study in Guangzhou. Infection, Genetics and Evolution 32, 178–190.
mate variability. PLoS ONE 9, p. e102755. 24. Lai S et al. (2015) The changing epidemiology of dengue in China, 1990–
15. Lu L et al. (2009) Time series analysis of dengue fever and weather in 2014: a descriptive analysis of 25 years of nationwide surveillance data.
Guangzhou, China. BMC Public Health 9, 395. BMC Medicine 13, 100.
16. Bannister-Tyrrell M et al. (2013) Weather-driven variation in dengue 25. Cullen JR et al. (1984) An epidemiological early warning system for mal-
activity in Australia examined using a process-based modelling approach. aria control in northern Thailand. Bulletin of the World Health
American Journal of Tropical Medicine and Hygiene 88, 65–72. Organization 62, 107.
17. Hanson SM and Craig Jr GB (1994) Cold acclimation, diapause, and 26. Buczak AL et al. (2014) Prediction of high incidence of dengue in the
geographic origin affect cold hardiness in eggs of Aedes albopictus Philippines. PLoS Neglected Tropical Diseases 8, e2771.
(Diptera: Culicidae). Journal of Medical Entomology 31, 192–201. 27. Bhatt S et al. (2013) The global distribution and burden of dengue. Nature
18. Brady OJ et al. (2013) Modelling adult Aedes aegypti and Aedes albopictus 496, 504–507.
survival at different temperatures in laboratory and field settings. Parasites 28. Zhang FC et al. (2014) Severe dengue outbreak in Yunnan, China, 2013.
& Vectors 6, 351. International Journal of Infectious Diseases 27, 4–6.
19. United States Census Bureau 2015, Births and Deaths, U.S. Department 29. Li Z et al. (2012) Spatiotemporal analysis of indigenous and imported
of Commerce, viewed 6 July 2015, Available at https://www.census.gov/ dengue fever cases in Guangdong province, China. BMC Infectious
population/international/data/idb/informationGateway.php. Diseases 12, 132.
Downloaded from https://www.cambridge.org/core. IP address: 46.4.80.155, on 16 Feb 2022 at 13:34:18, subject to the Cambridge Core terms of use, available at https://www.cambridge.org/core/terms.
https://doi.org/10.1017/S095026881900030XYou can also read