Development and validation of prediction models for mechanical ventilation, renal replacement therapy, and readmission in COVID-19 patients ...
←
→
Page content transcription
If your browser does not render page correctly, please read the page content below
Journal of the American Medical Informatics Association, 28(7), 2021, 1480–1488
doi: 10.1093/jamia/ocab029
Advance Access Publication Date: 11 March 2021
Research and Applications
Research and Applications
Development and validation of prediction models for
mechanical ventilation, renal replacement therapy, and
Downloaded from https://academic.oup.com/jamia/article/28/7/1480/6168488 by guest on 27 October 2021
readmission in COVID-19 patients
Victor Alfonso Rodriguez,1,* Shreyas Bhave,1,* Ruijun Chen , Chao Pang,1,2
George Hripcsak,1 Soumitra Sengupta,1 Noemie Elhadad,1 Robert Green,3
Jason Adelman,4 Katherine Schlosser Metitiri,5 Pierre Elias,1 Holden Groves,6
Sumit Mohan,7 Karthik Natarajan 1 and Adler Perotte1
1
Department of Biomedical Informatics, Columbia University, New York, New York, USA, 2Department of Translational Data Sci-
ence and Informatics, Geisinger, Danville, Pennsylvania, USA, 3Department of Emergency Medicine, Columbia University Irving
Medical Center, New York, New York, USA, 4Division of General Medicine, Department of Medicine, Columbia University Irving
Medical Center, New York, New York, USA, 5Department of Pediatrics, Columbia University Irving Medical Center, New York,
New York, USA, 6Department of Anesthesiology, Columbia University Irving Medical Center, New York, New York, USA, and 7Divi-
sion of Nephrology, Department of Medicine, Columbia University Irving Medical Center, New York, New York, USA
*Co-first authors.
Corresponding Author: Victor Alfonso Rodriguez, MPhil, 622 West 168th St., PH20; New York, NY 10032, USA; victor.a.ro-
driguez@columbia.edu
Received 20 September 2020; Revised 9 January 2021; Editorial Decision 3 February 2021; Accepted 5 February 2021
ABSTRACT
Objective: Coronavirus disease 2019 (COVID-19) patients are at risk for resource-intensive outcomes including me-
chanical ventilation (MV), renal replacement therapy (RRT), and readmission. Accurate outcome prognostication
could facilitate hospital resource allocation. We develop and validate predictive models for each outcome using retro-
spective electronic health record data for COVID-19 patients treated between March 2 and May 6, 2020.
Materials and Methods: For each outcome, we trained 3 classes of prediction models using clinical data for a
cohort of SARS-CoV-2 (severe acute respiratory syndrome coronavirus 2)–positive patients (n ¼ 2256). Cross-
validation was used to select the best-performing models per the areas under the receiver-operating character-
istic and precision-recall curves. Models were validated using a held-out cohort (n ¼ 855). We measured each
model’s calibration and evaluated feature importances to interpret model output.
Results: The predictive performance for our selected models on the held-out cohort was as follows: area under
the receiver-operating characteristic curve—MV 0.743 (95% CI, 0.682-0.812), RRT 0.847 (95% CI, 0.772-0.936),
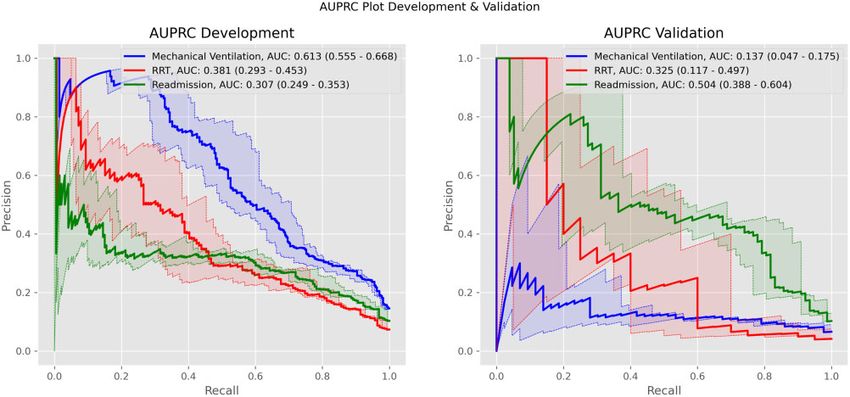
readmission 0.871 (95% CI, 0.830-0.917); area under the precision-recall curve—MV 0.137 (95% CI, 0.047-0.175),
RRT 0.325 (95% CI, 0.117-0.497), readmission 0.504 (95% CI, 0.388-0.604). Predictions were well calibrated, and
the most important features within each model were consistent with clinical intuition.
Discussion: Our models produce performant, well-calibrated, and interpretable predictions for COVID-19
patients at risk for the target outcomes. They demonstrate the potential to accurately estimate outcome progno-
sis in resource-constrained care sites managing COVID-19 patients.
C The Author(s) 2021. Published by Oxford University Press on behalf of the American Medical Informatics Association.
V
This is an Open Access article distributed under the terms of the Creative Commons Attribution Non-Commercial License (http://creativecommons.org/licenses/by-nc/4.0/),
which permits non-commercial re-use, distribution, and reproduction in any medium, provided the original work is properly cited. For commercial re-use, please contact
journals.permissions@oup.com 1480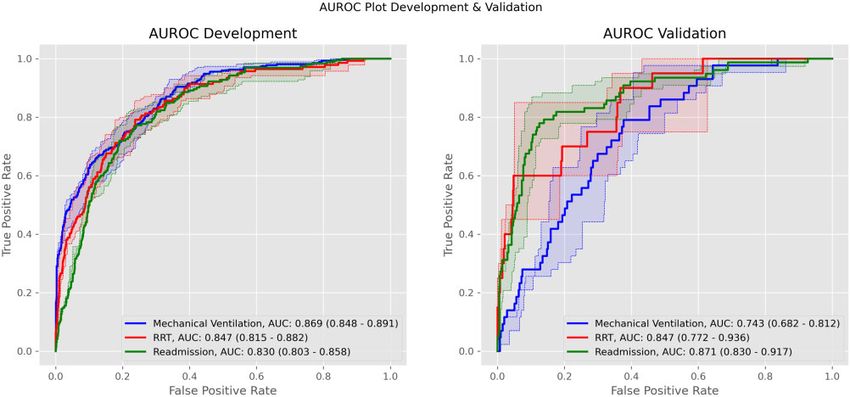
Journal of the American Medical Informatics Association, 2021, Vol. 28, No. 7                                                                     1481

Conclusions: We develop and validate prognostic models targeting MV, RRT, and readmission for hospitalized
COVID-19 patients which produce accurate, interpretable predictions. Additional external validation studies are
needed to further verify the generalizability of our results.

Key words: COVID-19, supervised machine learning, renal replacement therapy, respiration, artificial, patient readmission

INTRODUCTION                                                                  patients with active SARS-CoV-2 infection, we further limit this co-
                                                                              hort to patients with a positive, polymerase chain reaction–based
The United States continues to be a major epicenter for coronavirus
                                                                              SARS-CoV-2 test at any point during their hospital course. All clini-
disease 2019 (COVID-19), the disease caused by severe acute respi-
                                                                              cal observations were extracted from CUIMC/NYP’s Clinical Data
ratory syndrome coronavirus 2 (SARS-CoV-2).1,2 In the early phase
                                                                              Warehouse formatted according to the Observational Medical Out-
of the pandemic, hospitals in hard-hit regions, such as the New
                                                                              comes Partnership (OMOP) common data model.15 Data from
York Metropolitan Area, suffered large caseloads which heavily

                                                                                                                                                           Downloaded from https://academic.oup.com/jamia/article/28/7/1480/6168488 by guest on 27 October 2021
                                                                              CUIMC including Milstein Hospital and the Morgan Stanley Child-
strained medical resources.3–5 The surge in cases throughout the
                                                                              ren’s Hospital were used for model development. Observations for
country continues to drive medical resource expenditure, exhausting
                                                                              patients treated at NYP Allen Hospital, a community hospital mem-
limited supplies. In this setting, delivering optimal care to COVID-
                                                                              ber of NYP, were held out as a validation set. We use chi-square per-
19 patients will require matching scarce resources to patients in
                                                                              mutation tests to compare the distribution of outcomes and
need across hospital systems, cities, and even across the country. Ef-
                                                                              demographics between our 2 cohorts (see Table 1).
ficient distribution of resources will depend critically on prognostic
                                                                                  We note that the development and validation cohort data are de-
assessments for newly presenting patients. With accurate prognosti-
                                                                              rived from care sites with distinct inpatient and critical care capaci-
cation, patient needs may be anticipated and met with the necessary
                                                                              ties. To characterize these differences, we provide each site’s regular
equipment and provider expertise to limit disease progression or
                                                                              inpatient and ICU bed counts as well as their average annual admis-
guard against avoidable adverse outcomes. In this study, we de-
                                                                              sions (see Supplementary Table 1).
velop, validate, and analyze predictive models for the prognostica-
tion of 3 prevalent and actionable adverse outcomes in the setting of
COVID-19.                                                                     Clinical observations
    Acute respiratory failure (ARF) requiring mechanical ventilation,         Our datasets comprise demographics, smoking status, laboratory
severe acute kidney injury (AKI) requiring renal replacement therapy          test results, vital signs, and conditions. Clinical laboratory tests and
(RRT), and readmission are 3 common and critical adverse out-                 vital signs are standardized while demographics and conditions are
comes for patients with COVID-19. Roughly 12% to 33% of                       transformed into a binary encoding indicating presence (see Supple-
patients suffer ARF and require mechanical ventilation.6–9 34% of             mentary Methods). We include in our feature set only those condi-
all patients with COVID-19 and 78% of COVID-19 intensive care                 tions that appeared in the clinical records of at least 5 patients. A
unit (ICU) patients develop AKI, with up to 14% of all patients and           full list of the variables included in our feature set is provided in Sup-
35% of ICU patients requiring RRT.10 In addition, while hospitals             plementary Table 2.
struggle to manage heavy COVID-19 caseloads, patients who would                   For RRT and mechanical ventilation models, we use data gath-
normally be admitted may be discharged home, leading to higher                ered during the first 12 hours of the current hospital course. The 12-
than expected readmission rates.11 Each of these outcomes carries             hour constraint is meant to exclude early events, which are likely to
significant implications for patient outcomes, long-term sequelae,            be anticipated on presentation and are therefore less likely to be in-
and utilization of scarce resources including hospital beds and the           tervened upon based on the output from a predictive model. This
equipment and materials needed for mechanical ventilation and                 constraint also removes episodes occurring prior to a patient’s ar-
RRT. Clinical prediction models could be used effectively to assess           rival at the hospital; such events must be excluded to permit con-
patient prognosis, informing resource planning and triage deci-               struction of prognostic models. We also include data from patients’
sions.12,13 Nevertheless, most published COVID-19 prediction mod-             prior visits. For numerical data types like laboratory tests and vital
els have focused on disease diagnosis, while the few prognostic               signs, we use only the most recent values. Our binary encoding
models have targeted COVID-19 disease severity or mortality.14                accounts for the presence of conditions in a patient’s current visit
    In this work, we aim to build interpretable prognostic models for         and all their prior visits.
COVID-19 patients that estimate the risk of ARF requiring mechan-                 The dataset for our readmission models is constructed in the
ical ventilation, AKI requiring RRT, and hospital readmission. We             same way as is done for the mechanical ventilation and RRT models
develop our models using electronic health record (EHR) data from             with one important difference: we extend the data-gathering period
a major tertiary care center in New York City during the peak of the          to cover the entirety of the index hospital admission, not just the
COVID-19 crisis, and externally validate them using data from a               first 12 hours.
community hospital.
                                                                              Handling missing values
                                                                              For conditions, the binary encoding does not require imputation as
MATERIALS AND METHODS
                                                                              it encodes presence directly. For numerical variables, we impute
Data sources and patient population                                           missing values using Scikit-learn’s16 implementation of the MICE al-
We focus on patients whose hospital courses included emergency                gorithm17 with its default parameterization. Categorical variables
room visits, inpatient admissions, or both at Columbia University Ir-         (excluding conditions) were imputed using the most common class
ving Medical Center/NewYork-Presbyterian (CUIMC/NYP) be-                      in the training set. Furthermore, for imputed variables, we expand
tween March 2 and May 6, 2020. As we are interested in studying               our features to include binary missingness indicators specifying
1482 Journal of the American Medical Informatics Association, 2021, Vol. 28, No. 7
Table 1. Characteristics and target outcomes for patients with SARS-CoV-2–positive tests
Development (CUIMC) (n ¼ 2256) Validation (Allen Hospital) (n ¼ 855) P Value
Outcome
Mechanical ventilation 352 (15.60) 60 (7.02)Journal of the American Medical Informatics Association, 2021, Vol. 28, No. 7 1483
Table 2. Performance metrics for all models and outcomes
Outcome Model AUROC (Development) AUPRC (Development) AUROC (Validation) AUPRC (Validation)
Mechanical ventila- Logistic L1 0.869 (0.847-0.893) 0.569 (0.510-0.624) 0.741 (0.682-0.806) 0.127 (0.052-0.157)
tion Logistic EN 0.878 (0.858-0.902)a 0.562 (0.501-0.616) 0.738 (0.675-0.805) 0.141 (0.046-0.183)a
GBTb 0.869 (0.848-0.891) 0.613 (0.555-0.668)a 0.743 (0.682-0.812)a 0.137 (0.047-0.175)
Renal replacement Logistic L1b 0.847 (0.815-0.882)a 0.381 (0.293-0.453)a 0.847 (0.772-0.936)a 0.325 (0.117-0.497)a
therapy Logistic EN 0.844 (0.812-0.881) 0.378 (0.295-0.451) 0.841 (0.759-0.931) 0.314 (0.113-0.476)
GBT 0.837 (0.805-0.871) 0.325 (0.242-0.385) 0.829 (0.761-0.912) 0.196 (0.009-0.312)
Readmission Logistic L1 0.818 (0.789-0.847) 0.293 (0.233-0.344) 0.868 (0.823-0.917) 0.505 (0.395-0.602)a
Logistic ENb 0.830 (0.803-0.858) 0.307 (0.249-0.353) 0.871 (0.830-0.917)a 0.504 (0.388-0.604)
GBT 0.838 (0.814-0.864)a 0.287 (0.233-0.323) 0.869 (0.830-0.910) 0.427 (0.321-0.509)
AUROC: area under the receiver operating characteristic curve; AUPRC: area under the precision-recall curve; GBT: gradient boosted trees; Logistic EN: elas-
Downloaded from https://academic.oup.com/jamia/article/28/7/1480/6168488 by guest on 27 October 2021
tic-net logistic regression; Logistic L1: L1-penalized logistic regression.
a
The best performance for the given outcome according to the metric specified by the column heading.
b
Selected models are in bold for each outcome.
Statistical analysis tion. SHAP allows for instance-wise visualization, which for a given
Models feature can demonstrate the distribution of the effect size and direc-
We employ 3 types of models: L1-penalized logistic regression (logistic tion across the cohort.
L1), elastic-net logistic regression (logistic EN), and gradient boosted
trees (GBT). The former 2 are based on logistic regression, an effective Institutional review board
model for clinical prediction tasks.18,19 GBTs are nonparametric mod- This study was approved by CUIMC’s institutional review board
els that have also shown strong clinical prediction performance.20–23 and issued institutional review board number AAAS9678.
These models are relatively simple, interpretable, and straightforward
to apply for prognostic modeling. These characteristics align well with
the aims of the present study. Furthermore, each of these models has a RESULTS
built-in regularization mechanism.24–27 This is crucial in our setting in
which the number of features is on the order of the number patients. Cohort description
We use Scikit-learn to implement each model type.16 Both logistic L1 Our final development and validation cohorts contained 2256 and
and logistic EN have a hyperparameter, alpha, which controls the 855 patients, respectively. The distributions of outcome and demo-
strength of regularization. In addition, logistic EN has a second, mix- graphic variables for each cohort are presented in Table 1. The dis-
ing hyperparameter which controls the relative weight of the L1 vs L2 tributions of sex and race and the number of readmissions were not
penalties. We use the default hyperparameter settings for GBT. significantly different between cohorts (P values >.05). Significant
differences were found in the distributions of age and ethnicity, the
numbers of mechanical ventilation and RRT cases, and the numbers
Model selection (hyperparameter tuning) of patients with do not intubate or do not resuscitate status or who
Our model selection approach relies upon 2 performance metrics: the died during their hospitalization (P < .001).
area under the receiver-operating characteristic curve (AUROC) and
the area under the precision-recall curve (AUPRC). For each model
Model performance in development cohort
and outcome, we conducted 5-fold cross validation on the develop-
Performance metrics for all models and outcomes on the develop-
ment cohort data searching across different hyperparameters (alpha:
ment cohort are presented in Table 2. The models with best AUROC
[0.3, 0.5, 0.7]; mixing: [1 10-4, 1 104] equally spaced range of
for mechanical ventilation, RRT, and readmission were logistic EN
10 values). We select the model with the best average AUROC across
(0.878 [95% CI, 0.858-0.902]), logistic L1 (0.847 [95% CI, 0.815-
all folds. For the selected model, we compute the mean AUROC and
0.882], and GBT (0.838 [95% CI, 0.814-0.864]), respectively. The
AUPRC across all folds.28 We obtain 95% confidence intervals (CIs)
best performing models according to AUPRC were GBT (0.613
for all statistics by pooling the predicted probabilities and true labels
[95% CI, 0.555-0.668], logistic L1 (0.381 [95% CI 0.293-0.453],
across all folds within a reverse percentile bootstrap. For the valida-
and logistic EN (0.307 [95% CI, 0.249-0.353]), respectively.
tion cohort, we use the selected model to obtain outcome predictions
Logistic L1 achieved the highest AUROC and AUPRC for RRT
and subsequently compute the reverse percentile bootstrap.
prediction; we use logistic L1 for all remaining RRT prediction
experiments. No single model yielded the best performance on both
Calibration metrics for mechanical ventilation and readmission. We chose GBT
For the development cohort, we use the pooled predicted probabili- for mechanical ventilation and logistic EN for readmission, as they
ties and the true labels to generate the calibration curves. For the had the highest AUPRC and nearly highest AUROC (mechanical
validation cohort, we use the predicted probabilities and true labels ventilation, 0.869 [95% CI, 0.848-0.891]; readmission, 0.830 [95%
for the full cohort. CI, 0.803-0.858]). See Figures 1 and 2 for development cohort
ROC and precision-recall curves, respectively.
Feature importance
Feature importances for all models were evaluated using SHAP,29 a Model performance in validation cohort
method for estimating instance-wise Shapley values, which represent Table 2 displays the performance metrics for all models on the vali-
fair estimates of the effect each feature has upon an outcome predic- dation cohort. Relative to the development cohort, mechanical ven-1484 Journal of the American Medical Informatics Association, 2021, Vol. 28, No. 7
Downloaded from https://academic.oup.com/jamia/article/28/7/1480/6168488 by guest on 27 October 2021
Figure 1. Receiver-operating characteristic (ROC) curves for ventilation, renal replacement therapy (RRT), and readmission. Curves are for each outcome’s se-
lected model. Dark lines correspond to averages over all folds. Shaded areas correspond to 95% confidence intervals. AUC: area under the curve; AUROC: area
under the receiver-operating characteristic curve.
tilation predictive performance fell significantly across both tively to positively predictive as values increase from low to high.
AUROC (0.743 [95% CI, 0.682-0.812]) and AUPRC (0.137 [95% Meanwhile, serum bicarbonate and calcium make the same transi-
CI, 0.047-0.175]). RRT predictive performance remained consistent tion as values decrease. Furthermore, the presence of procalcitonin,
across both metrics (AUROC: 0.847 [95% CI, 0.772-0.936]; urea nitrogen-to-creatinine ratio, and glomerular filtration rate
AUPRC: 0.325 [95% CI, 0.117-0.497]). For readmission, both met- measurements were positively predictive for RRT.
rics increased (AUROC: 0.871 [95% CI, 0.830-0.917]; AUPRC: Readmission prediction was driven positively by high values for
0.504 [95% CI, 0.388-0.604]). See Figures 1 and 2 for validation temperature, hemoglobin, and oxygen saturation (SpO2). Con-
cohort ROC and precision-recall curves, respectively. versely, it was driven negatively by low values for these variables.
The opposite trend was observed for leukocyte count, respiratory
Calibration rate, erythrocyte sedimentation rate (ESR), calcium, and erythrocyte
distribution width. Fever and abdominal pain were positively pre-
Figure 3 shows the calibration curves for each outcome’s selected
dictive, whereas respiratory disorder and documented coronaviridae
model. In the development cohort, predicted probabilities for me-
infection were negatively predictive. Missing values for laboratory
chanical ventilation closely approximate the observed fraction of
tests including fibrin d-dimer, ferritin, procalcitonin, lactate dehy-
positive cases. Meanwhile, for both RRT and readmission, the pre-
drogenase, ESR, and activated partial thromboplastin time were
dicted probabilities overestimate the fraction of positive cases. How-
positively predictive.
ever, these estimates improve as the value of the predicted
probability increases. Similar trends are observed for calibration in
the validation cohort.
DISCUSSION
Feature importance Our results demonstrate that interpretable, performant, prognostic
SHAP values for each outcome’s selected model are visualized in models targeting resource-intensive outcomes important to the man-
Figure 4. Respiratory illnesses including acute hypoxemic respira- agement of COVID-19 may be trained using routinely recorded clin-
tory failure, acute respiratory distress syndrome (ARDS), and acute ical variables. For mechanical ventilation and RRT, our models use
lower respiratory tract infection served as positive predictors (posi- only the data available within the first 12 hours of a patient’s hospi-
tive SHAP values) for mechanical ventilation. High respiratory rate, tal course. Thus, their predictions may be made available to clini-
high neutrophil count, hypoxemia, shock, and documented disease cians actively managing COVID-19 patients. Meanwhile, for
due to coronaviridae (ie, the presence of the concept code “Disease readmission, our model utilizes data gathered throughout the cur-
due to Coronaviridae” in a patient’s clinical record) were also strong rent stay, making predictions available by the end of a hospital
positive predictors. Greater age was negatively predictive (negative course when they would have the largest impact.
SHAP values). Our work extends and improves on the current state-of-the-art
Respiratory and renal illnesses including acute renal failure, in outcome prediction for COVID-19 patients. Our mechanical ven-
acute hypoxemic respiratory failure, ARDS, and acute lower respira- tilation prediction model is competitive with the deep learning
tory tract infection functioned as positive predictors for RRT. Sev- model introduced by Shashikumar et al.30 Though our objectives are
eral features drove the predicted likelihood either positively or distinct (their model targets hourly predictions), their validation
negatively depending on their value. Serum creatinine, neutrophil AUROC (0.882) and AUPRC (0.209) lie near or within our 95%
count, C-reactive protein, and hyaline casts transition from nega- CIs. Our RRT prediction model demonstrates superior performanceJournal of the American Medical Informatics Association, 2021, Vol. 28, No. 7 1485
Downloaded from https://academic.oup.com/jamia/article/28/7/1480/6168488 by guest on 27 October 2021
Figure 2. Precision-recall curves for ventilation, renal replacement therapy (RRT), and readmission. Curves are for each outcome’s selected model. Dark lines cor-
respond to averages over all folds. Shaded areas correspond to 95% confidence intervals. AUC: area under the curve; AUPRC: area under the precision-recall
curve.
Figure 3. Calibration reliability curve for development and validation cohorts. The reliability curve shows how close each model is to a perfectly calibrated model.
This plot is created by binning predicted probabilities and examining the true fraction of cases in each bin. The plot under each reliability curve shows the support
(number of positives) in each bin. RRT: renal replacement therapy.
relative to previously described work which also utilized data from the first to describe a predictive model for COVID-19 patient read-
patients in New York City31; they obtained a validation AUROC of mission.32,33
0.79, which lies within our 95% CI (0.759-0.931). Though the cur- Each of our models demonstrates reasonably good calibration in
rent literature contains retrospective analysis studying the subpopu- the development and validation cohorts. Nevertheless, caution
lation of readmitted COVID-19 patients, to our knowledge, we are should be taken when interpreting our models’ predicted probabili-1486 Journal of the American Medical Informatics Association, 2021, Vol. 28, No. 7
The use of SHAP values illuminates which features are driving
our models’ predictions and in which directions. This information is
vital for evaluating what our models have learned. Consistent with
expectations, predicted likelihoods of mechanical ventilation and
RRT correlated positively with markers of respiratory and renal dis-
tress, as well as markers of active infectious or inflammatory pro-
cesses. Notably, patient age was negatively predictive of mechanical
ventilation, which is potentially a reflection of advance directives
and clinical decision making, rather than a lower incidence of severe
respiratory failure. In addition, as described in recently published
work,31 we find that respiratory distress is strongly associated with
RRT. Predicted probabilities for readmission were mostly driven by
the absence of labs, which would be ordered if clinical suspicion for
Downloaded from https://academic.oup.com/jamia/article/28/7/1480/6168488 by guest on 27 October 2021
an infectious process were high (eg, lactate dehydrogenase, C-reac-
tive protein, ESR). This finding suggests that readmitted patients
may not have been considered ill enough to warrant admission and
thus were given only a limited clinical workup for COVID-19. In ad-
dition, high respiratory rates were negatively predictive for readmis-
sion, suggesting that signs of respiratory distress may be associated
with presentation later in the disease course, prolonged evaluation,
and hence decreased probability of near-term return after discharge.
Of note, the condition “Disease due to Coronaviridae” is a strong
positive predictor for mechanical ventilation and a negative predic-
tor for readmission. This suggests that the subset of patients whose
documentation contains this concept code may be suffering from
more severe disease on admission, as such patients are more likely to
require invasive intervention (ie, mechanical ventilation) and are un-
likely to be discharged early and be subsequently readmitted.
With further development and prospective validation, our out-
come prediction models could potentially be utilized in practice to
inform triage and resource allocation. Patients with high estimated
risk of mechanical ventilation could be monitored more closely with
continuous pulse oximetry and given early, noninvasive interven-
tions such as self-proning.35 Care could be taken to place these
patients in beds with easy access to advanced oxygen therapies like
high-flow nasal cannula and noninvasive positive pressure ventila-
tion, resources that are typically not evenly distributed throughout a
hospital. Similarly, providers could ensure that patients at high risk
for RRT are placed in locations with the personnel and equipment
needed to deliver this service. Such patients may also benefit from
renal-protective therapeutic strategies such as setting a higher
threshold for use of nephrotoxic agents, managing ARDS with less
aggressive volume restriction, and an early nephrology consultation
for AKI—an intervention that has been associated with improved re-
nal prognosis.36,37 Additionally, given the relative paucity of dialysis
equipment and appropriately trained staff during a pandemic surge,
Figure 4. SHAP feature importances for ventilation, renal replacement therapy awareness of the risk of AKI requiring RRT could allow for im-
(RRT), and readmission. Each SHAP value plot displays a patient-level SHAP proved resource planning and appropriate timing of surge protocols
value as a point which lies on the horizontal axis and uses color to indicate such as shared continuous RRT and acute peritoneal dialysis. Fi-
whether the feature value for a patient was higher (red) or lower (blue) than av- nally, patients with high risk of readmission could be re-evaluated
erage. SHAP values >1 indicate increased risk for a patient. SHAP values 0) indicates higher risk for ventilation. The average of the absolute SHAP val- decompensating at home.
ues (shown in parenthesis for each feature) across all points shows the overall Though our models demonstrate strong performance on the de-
importance of the feature. aPTT: activated partial thromboplastin time; MCHC: velopment cohort, we must also acknowledge that this performance
mean corpuscular hemoglobin concentration; SpO2: oxygen saturation. deteriorates significantly when they are applied to the validation co-
hort. This observation speaks to the care practitioners must take
ties as estimates of the true risk of the target outcome for a given pa- when developing models on one patient population and applying
tient. Otherwise, a method for posttraining calibration should be them to another. In our case, the development cohort was drawn
employed, such as isotonic regression.34 from a major medical center while the validation cohort came fromJournal of the American Medical Informatics Association, 2021, Vol. 28, No. 7 1487
a small community hospital. It is likely that these 2 populations con- Additional external validation studies are needed to further verify
tain very different people who experience very different care practi- the generalizability of our results.
ces. The result is development and validation datasets that differ in
both the spectrum of observed variable values as well as the fre-
quency and pattern of variable missingness. These differences limit FUNDING
our models’ ability to generalize to the validation cohort what they VAR is supported by grant F31LM012894 from the National Institutes of
learned on the development cohort and are likely a major driver of Health (NIH), National Library of Medicine (NLM). SB is supported by grant
the performance degradation on the former. We also consider that 5T15LM007079 from the NIH, NLM. AP is supported by grant
differences in resource constraints, specifically regarding equipment R01HL148248 from the NIH, National Heart, Lung, and Blood Institute.
and materials needed for mechanical ventilation and RRT, could The funders played no direct role in the present work with regard to study
concept and design; acquisition, analysis, and interpretation of data; statisti-
have potentially contributed to our models’ performance degrada-
cal analysis; manuscript drafting and revision; and supervision.
tion on these outcomes in the validation cohort. However, due to
changes in care practices (eg, having 2 patients share a single contin-
Downloaded from https://academic.oup.com/jamia/article/28/7/1480/6168488 by guest on 27 October 2021
uous RRT machine within a 24-hour on/off cycle) and acquisition of
AUTHOR CONTRIBUTIONS
additional materials and equipment, neither site ever came close to
exhausting it’s supplies. This suggests that resource constraints AP, KN, RC, SM, and HG contributed to concept and design. SB, CP, AP,
VAR, KN, and SS contributed to acquisition, analysis, and interpretation of
played at most a marginal and indirect role in limiting our models’
data. SB contributed to statistical analysis. VAR, SB, and RC contributed to
performance on the validation cohort.
manuscript drafting. VAR, RC, SM, NE, GH, KSM, JA, PE, RG, and HG
We acknowledge several important limitations to this work. Our contributed to manuscript revision. AP was involved in supervision.
data were derived from a single hospital network. This limits the
generalizability of our results to other institutions, as we cannot cap-
ture the out-of-network variability in COVID-19 population charac- SUPPLEMENTARY MATERIAL
teristics and care practices. This limitation extends to our validation
Supplementary material is available at Journal of the American Medical Infor-
experiments, which used data from an in-network community hospi- matics Association online.
tal. This also complicates our modeling of readmission. Our positive
readmission cases are limited to those patients whose discharge and
readmission both occurred in our hospital network. Discharged ACKNOWLEDGMENTS
patients who were subsequently admitted elsewhere would appear
The following authors had full access to the electronic health record data used
as negative cases in our models. We adopted a feature-agnostic ap- in this work: AP, KN, CP, SB, VAR, and RC.
proach when choosing which variables to include in our model. This
allowed us to model many of the observations in the clinical record,
but it also complicates the models’ utility. To extract risk estimates CONFLICTS OF INTEREST
from our model, a user will need to replicate our feature engineering
The authors have no conflicts of interest to report as pertains to their financial
and apply it to their local data stores. Thus, they will likely need a
interests, activities, relationships, and affiliations.
pipeline inputting clinical observations directly into the model from
the EHR. Modeling many variables also introduced a significant
amount of missing values (see Supplementary Table 3). To handle REFERENCES
these, we used imputation strategies like MICE, which assume that
1. Centers for Disease Control and Prevention. Coronavirus disease 2019
the data are missing at random, even though our data are likely (COVID-19). https://www.cdc.gov/coronavirus/2019-ncov/cases-updates/
missing not at random. As such, it is likely that our fitted model cases-in-us.html Accessed August 11, 2020.
parameters are biased.38 However, as we are primarily concerned 2. Johns Hopkins University and Medicine. Coronavirus Resource Center.
with optimizing prediction, we are willing to trade off model param- https://coronavirus.jhu.edu/. Accessed August 11, 2020.
eter bias for predictive performance by modeling the imputed data 3. Goldfarb DS, Benstein JA, Zhdanova O, et al. Impending shortages of kid-
along with the observed missingness pattern.39 Our use of the ney replacement therapy for covid-19 patients. Clin J Am Soc Nephrol
OMOP common data model also introduced challenges and limita- 2020; 15 (6): 880–2.
4. Ranney ML, Griffeth V, Jha AK. Critical supply shortages - the need for
tions. The first of these concerns our outcome definitions, which re-
ventilators and personal protective equipment during the Covid-19 pan-
lied on structured fields in nursing flowsheet. As these data are not
demic. N Engl J Med 2020; 382 (18): e41.
part of the OMOP common data model, replicating our definitions
5. Sanger-Katz M, Kliff S, Parlapiano A. These places could run out of hospi-
at other sites may be difficult. Second, during the extraction, trans- tal beds as coronavirus spreads. The New York Times. https://www.
formation, and loading of data into the OMOP we may have lost nytimes.com/interactive/2020/03/17/upshot/hospital-bed-shortages-coro-
some observations. This is a likely source of the unusually large navirus.html Accessed August 11, 2020.
amount of missingness in routinely collected clinical measurements 6. Argenziano MG, Bruce SL, Slater CL, et al. Characterization and clinical
such as vitals and plasma and serum electrolyte labs. course of 1000 patients with coronavirus disease 2019 in New York: ret-
rospective case series. BMJ 2020; 369: m1996.doi:10.1136/bmj.m1996.
7. Goyal P, Choi JJ, Pinheiro LC, et al. Clinical characteristics of COVID-19
CONCLUSION in New York City. N Engl J Med 2020; 382 (24): 2372–4.
8. Richardson S, Hirsch JS, Narasimhan M, et al.; Northwell COVID-19 Re-
In conclusion, we have trained and validated prognostic models tar- search Consortium. Presenting characteristics, comorbidities, and out-
geting 3 significant, resource-intensive outcomes in the context of comes among 5700 patients hospitalized with COVID-19 in the New
COVID-19: mechanical ventilation, RRT, and hospital readmission. York City Area. JAMA 2020; 323 (20): 2052–9.
Our models run on routinely collected clinical variables, and pro- 9. Petrilli CM, Jones SA, Yang J, et al. Factors associated with hospital ad-
duce accurate, interpretable predicted likelihoods for each outcome. mission and critical illness among 5279 people with coronavirus disease1488 Journal of the American Medical Informatics Association, 2021, Vol. 28, No. 7
2019 in New York City: Prospective cohort study. BMJ 2020; 369: 25. Zou H, Hastie T. Regularization and variable selection via the elastic net.
m1966.doi:10.1136/bmj.m1966. J R Stat Soc Series B Stat Methodol2005; 67 (2): 301–20.
10. Robbins-Juarez SY, Qian L, King KL, et al. Outcomes for patients with 26. Hastie T, Tibshirani R, Wainwright M. Statistical Learning with
COVID-19 and acute kidney injury: a systematic review and meta-analy- Sparsity: The Lasso and Generalizations. Boca Raton, FL: CRC
sis. Kidney Int Rep 2020; 5 (8): 1149–60. Press; 2015.
11. Parra LM, Cantero M, Morras I, et al. Hospital readmissions of dis- 27. Friedman JH. Greedy function approximation: a gradient boosting ma-
charged patients with COVID-19. Int J Gen Med 2020; 13: 1359–66. chine. Ann Stat 2001; 29 (5): 1189–232.
12. Obermeyer Z, Emanuel EJ. Predicting the future-big data, machine learn- 28. Ledell E, Petersen M, Van Der Laan M. Computationally efficient confi-
ing, and clinical medicine. N Engl J Med 2016; 375 (13): 1216–9. dence intervals for cross-validated area under the ROC curve estimates.
13. Shilo S, Rossman H, Segal E. Axes of a revolution: challenges and prom- Electron J Stat 2015; 9 (1): 1583–607.
ises of big data in healthcare. Nat Med 2020; 26 (1): 29–38. 29. Lundberg SM, Lee SI. A unified approach to interpreting model predic-
14. Cummings MJ, Baldwin MR, Abrams D, et al. Epidemiology, clinical tions. Adv Neural Inform Process Syst 2017; 4765–74.
course, and outcomes of critically ill adults with COVID-19 in New York 30. Shashikumar SP, Wardi G, Paul P, et al. Development and prospective val-
City: a prospective cohort study. Lancet 2020; 395 (10239): 1763–70. idation of a transparent deep learning algorithm for predicting need for
15. Overhage JM, Ryan PB, Reich CG, Hartzema AG, Stang PE. Validation of mechanical ventilation. Chest 2020 Dec 17 [E-pub ahead of print].
Downloaded from https://academic.oup.com/jamia/article/28/7/1480/6168488 by guest on 27 October 2021
a common data model for active safety surveillance research. J Am Med doi:10.1101/2020.05.30.20118109
Inform Assoc 2012; 19 (1): 54–60. 31. Chan L, Chaudhary K, Saha A, et al. AKI in hospitalized patients with
16. Pedregosa F, Varoquaux G, Gramfort A, et al. Scikit-learn: machine learn- COVID-19. J Am Soc Nephrol. 2021; 32 (1): 151–60.
ing in Python. J Mach Learn Res 2011; 12: 2825–30. 32. Somani S, Richter F, Fuster V, et al. Characterization of patients who re-
17. van Buuren S, Groothuis-Oudshoorn K. mice: Multivariate imputation by turn to hospital following discharge from hospitalization for COVID-19. J
chained equations in R. J Stat Softw 2011; 45 (3): 1–68. Gen Intern Med 2020; 35 (10): 2838–44
18. Christodoulou E, Ma J, Collins GS, Steyerberg EW, Verbakel JY, Van Cal- 33. Wang X, Xu H, Jiang H, et al. The clinical features and outcomes of dis-
ster B. A systematic review shows no performance benefit of machine charged coronavirus disease 2019 patients a prospective cohort study.
learning over logistic regression for clinical prediction models. J Clin Epi- QJM 2020; 113 (9): 657–65.
demiol 2019; 110: 12–22. 34. Chakravarti N. Isotonic median regression: a linear programming ap-
19. Pavlou M, Ambler G, Seaman S, De Iorio M, Omar RZ. Review and eval- proach. Math Oper Res 1989; 14 (2): 303–8.
uation of penalised regression methods for risk prediction in low- 35. Caputo ND, Strayer RJ, Levitan R. Early self-proning in awake, non-
dimensional data with few events. Stat Med 2016; 35 (7): 1159–77. intubated patients in the emergency department: a single ED’s experi-
20. Atkinson EJ, Therneau TM, Melton LJ, et al. Assessing fracture risk using gradi- ence during the COVID-19 pandemic. Acad Emerg Med 2020; 27 (5):
ent boosting machine (GBM) models. J Bone Miner Res 2012; 27 (6): 375–8.
1397–404. 36. Ponce D, de Pietro Franco Zorzenon C, dos Santos NY, Balbi AL. Early
21. Ayaru L, Ypsilantis PP, Nanapragasam A, et al. Prediction of outcome in nephrology consultation can have an impact on outcome of acute kidney
acute lower gastrointestinal bleeding using gradient boosting. PLoS One injury patients. Nephrol Dial Transplant 2011; 26 (10): 3202–6.
2015; 10 (7): e0132485. 37. Soares DM, Pessanha JF, Sharma A, Brocca A, Ronco C. Delayed nephrol-
22. Blagus R, Lusa L. Gradient boosting for high-dimensional prediction of ogy consultation and high mortality on acute kidney injury: a meta-analy-
rare events. Comput Stat Data Anal 2017; 113: 19–37. sis. Blood Purif 2017; 43 (1–3): 57–67.
23. Sinha P, Churpek MM, Calfee CS. Machine learning classifier models can 38. Rubin DB. Inference and missing data. Biometrika 1976; 63 (3): 581–92.
identify acute respiratory distress syndrome phenotypes using readily available 39. Sperrin M, Martin GP, Sisk R, Peek N. Missing data should be han-
clinical data. Am J Respir Crit Care Med 2020; 202 (7): 996–1004. dled differently for prediction than for description or causal explana-
24. Tibshirani R. Regression shrinkage and selection via the Lasso. J R Stat tion. J Clin Epidemiol 2020; 125: 183–7. doi:10.1016/j.jclinepi.
Soc Series B Stat Methodol 1996; 58 (1): 267–88. 2020.03.028You can also read