Determining the Optimal Scalar Intensity Measure of Floor Communication Towers
←
→
Page content transcription
If your browser does not render page correctly, please read the page content below
Hindawi
Shock and Vibration
Volume 2022, Article ID 6347334, 12 pages
https://doi.org/10.1155/2022/6347334

Research Article
Determining the Optimal Scalar Intensity Measure of Floor
Communication Towers

 Bo Li ,1,2 Qinghui Lai,3 Endong Guo,1 Chenxi Mao,1 and Xiaofei Li2
 1
 Key Laboratory of Earthquake Engineering and Engineering Vibration, Institute of Engineering Mechanics,
 China Earthquake Administration, Harbin 150080, China
 2
 School of Architecture Engineering, Binzhou University, Binzhou 256600, China
 3
 State Key Laboratory of Precision Blasting, Jianghan University, Wuhan 430056, China

 Correspondence should be addressed to Bo Li; libo20070025@126.com

 Received 16 November 2021; Revised 12 January 2022; Accepted 21 January 2022; Published 23 February 2022

 Academic Editor: Luigi Di Sarno

 Copyright © 2022 Bo Li et al. This is an open access article distributed under the Creative Commons Attribution License, which
 permits unrestricted use, distribution, and reproduction in any medium, provided the original work is properly cited.

 Various structural types and ground motion characteristics lead to distinct intensity measures of structural seismic performance.
 For the lattice high-rise steel structure of communication towers, determining the intensity measures to adjust ground motion is
 critical. Additionally, a crucial problem is whether the ground motion intensity parameters of pulse-like ground motion and
 ordinary ground motion are consistent. In this study, a standard floor four-leg angle steeled communication tower was considered
 the study object, and 50 pulse-like ground motions and 50 ordinary ground motions were identified to form a pulse-like ground
 motion set and ordinary ground motion set, respectively. For comparative analyses, 15 ground motion parameters, including
 amplitude, spectrum, duration, and energy parameters, were selected. The results revealed that for the lattice towers, such as
 communication tower, under the action of pulse-like ground motion or ordinary ground motion, efficiency, practicability, and
 sufficiency should be considered. Furthermore, the most suitable intensity measure was the spectral acceleration corresponding to
 the natural period of the tower. This study provides a basis for selecting the ground motion for dynamic time history analysis of the
 lattice steel tower.

1. Introduction such scenarios, rescue operations cannot be performed ef-
 fectively, causing considerable casualties and loss of
With the continuous development of 5G communication property.
technology and Internet, portable communication network Typically, dynamic time history analysis is used to
services and applications, such as smartphone payment, analyse the seismic performance of structures. The results
online office and teaching, and webcast, have become an revealed that the ground motion parameters (intensity
indispensable part of people’s daily lives. As the main carrier measures, IMi) suitable for the study of structural seismic
of the communication antenna, the operation of commu- performance differed with the type of structures and
nication towers is primarily associated with the smoothness ground motion characteristics. For lattice towers, in-
of the communication system. Conventionally, the design of cluding transmission towers and communication towers,
communication towers is considered for the perspective of currently, the seismic intensity measures identified by
its wind resistance performance [1–3]. However, China’s dynamic time history analysis or amplitude modulated
Wenchuan earthquake, Yushu earthquake, and Japan’s ‘311’ ground motion predominantly involve peak acceleration
earthquake and other earthquake damage investigations (PGA) [6, 7], peak velocity (PGV) [8], spectral acceler-
have revealed that in the event of an earthquake, damage to ation Sa(T1) corresponding to the natural period of the
communication towers results in the suspension of com- structure [9, 10] and the ratio of peak velocity to peak
munication with the outside world in some areas [4, 5]. In acceleration (V/A) [11]. In theoretical research and
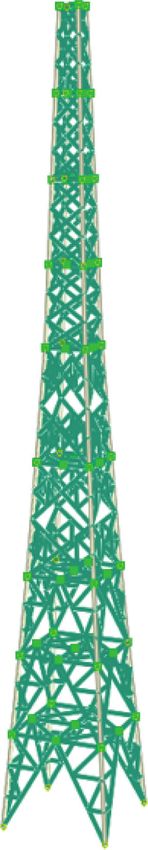
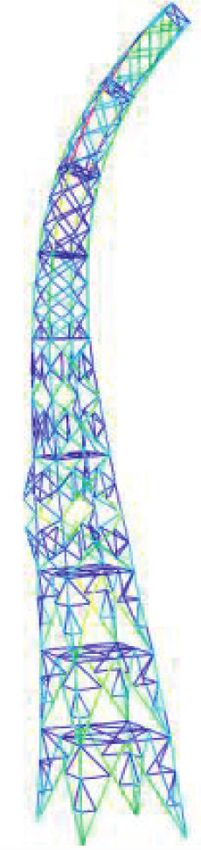
2 Shock and Vibration

engineering practice, ground motion intensity is typically 3. Intensity Measures
quantitatively characterised by ground motion parame-
ters, in which scalar parameters predominantly include A reasonable intensity measure is a critical basis for eval-
amplitude parameters, spectrum parameters, duration uating the structural response and recoverable ability of the
parameters, and energy parameters [12–14]. The use of structural seismic function. This measure should reflect the
appropriate intensity measures to select and adjust natural structural seismic response index or damage indexes. The
ground motion and the selection of appropriate engi- selection of intensity measures should be comprehensive
neering demand parameters (EDP) to evaluate structural and cover three elements of ground motion, namely am-
damage are conducive to reducing the discrete type of plitude parameters, spectrum parameters, and duration
structural dynamic time history analysis results and im- parameters, as well as energy parameters [12–14, 18]. The
proving calculation efficiency. Therefore, the selection of selection of intensity measures should specify representative
reliable intensity measures is critical for structural dy- ground motion parameters with clear physical meaning,
namic response analysis. Compared with ordinary ground wide application range, and high frequency in seismic en-
motion, pulse-like earthquakes typically exhibit a wide gineering. The representative intensity measures discussed
response spectrum sensitive area. Because earthquakes in this study are presented in Table 2. The intensity measures
produce high-energy input to the structure in a short time, considered in this study did not include vector parameters.
this ground motion typically causes considerable damage
to the engineering structure. However, for the lattice high- 4. Description of the Model
rise steel structure of the communication tower, deter-
mining the type of intensity measure that is the most 4.1. Overview of the Selected Tower and Finite Element Model.
effective to specify and adjust ground motion is critical. To analyse object representative, a 50 m high falling four-
Currently, limited studies have been conducted to de- legged steel tower was selected as the structural prototype of
termine if the most effective parameters of pulse-like the standard Atlas of communication tower formulated by
ground motion and ordinary ground motion are China Tower Co. Ltd. General finite element software
consistent. ABAQUS was used to construct the finite element model.
 In this study, a standard floor four-leg angle steeled Q345 and Q235 section steel was used for main material and
communication tower was considered the research object, inclined material, respectively, which were simulated by the
50 pulse-like ground motions and 50 ordinary ground beam element. The damping ratio is 2%. As a high-rise
motions were gathered from PEER ground motion data structure, the communication tower is highly influenced by
centre to form the pulse and ordinary ground motion sets, the p-delta effect. Therefore, initial defects were introduced
respectively. A total of 15 ground motion parameters, in- in the analysis process. Considering the influence of bending
cluding amplitude parameters, spectrum parameters, du- and shear deformation of members, the contribution to
ration parameters, and energy parameters, were selected for structural stiffness to natural vibration period and frequency
comparative analysis. Considering the uncertainty of the was consistent with those in practice, and the geometric
input ground motion, the optimal intensity measures under nonlinearity of the structure was considered. Because of the
pulse-like ground motion and ordinary earthquake action material nonlinearity of structural steel, pursuant to the ideal
were selected from the perspectives of efficiency, practica- elastic-plastic assumption, von Mises criterion was imple-
bility, and sufficiency. This study provides a basis of selecting mented as the material yield criterion, and the double
ground motion for dynamic time history analysis of lattice broken line constitutive model was adopted as the material
steel tower. constitutive model. The mechanical parameters are pre-
 sented in Table 3. The antenna platform at the top of the
2. Ground Motion Records tower, lightning rod, bolts, and ladders at each section were
 applied as additional loads at the horizontal nodes of each
In the process of dynamic time history analysis of earth- section. The sketch of the prototype structure is displayed in
quakes, accurate evaluation of ground motion is critical for Figure 1, and the components size and the additional mass of
determining whether the analysis results are effective. Pulse- the tower are displayed in Table 4. The bottom of the tower
like ground motion closely related to the relative position was absolutely consolidated. According to the modal anal-
between site and seismic fault has attracted considerable ysis, the mass participation ratios of the first three modes are
attention in structural engineering. Because its main energy 37.2%, 34.4%, and 20.5%, totally 92.1%. The first three mode
occurs in a concentrated time or frequency domain, pulse- shapes are shown in Figure 2.
like ground motion is generally recognised as the key factor
causing severe damage to all engineering structures.
 By using the simplified and efficient method proposed by 4.2. Model Verification. The rationality of the finite element
Zhai [15] for quantitatively identifying pulse-like ground model is directly relevant to the reliability of the analysis
motions, 50 pulse-like and 50 ordinary ground motions were results. To verify the rationality of the aforementioned
obtained from the PEER ground motion database to form model, a 50-m four-legged steel tower was designed con-
pulse-like and ordinary ground motion sets, and the cloud forming to the standard Atlas of communication tower in
analysis method was employed to analyse the structure Harbin, Heilongjiang Province, for the frequency test. A
[16, 17]. The established ground motions are listed in Table 1. three-way acceleration sensor was placed on the top
Shock and Vibration 3

 Table 1: Selected ground motions.
 (a) Pulse-like ground motions
Seq. RSN Event Year Station M EpiD (km)
1 77 San fernando 1971 Pacoima dam 6.61 11.87
2 184 Imperial Valley-06 1979 El centro 6.53 27.23
3 250 Mammoth Lakes-06 1980 Long valley dam 5.94 14.04
4 296 Irpinia, Italy-02 1980 Bagnoli irpinio 6.2 22.29
5 503 Taiwan SMART1(40) 1986 SMART1 C00 6.32 68.18
6 506 Taiwan SMART1(40) 1986 SMART1 I07 6.32 67.98
7 540 N. Palm springs 1986 Whitewater 6.06 4.24
8 614 Whittier Narrows-01 1987 Downey—birchdale 5.99 15.29
9 645 Whittier Narrows-01 1987 LB—orange ave 5.99 20.68
10 732 Loma Prieta 1989 APEEL 2 6.93 63.49
11 738 Loma prieta 1989 Alameda naval air 6.93 90.77
12 764 Loma prieta 1989 Gilroy 6.93 28.11
13 779 Loma prieta 1989 LGPC 6.93 18.46
14 784 Loma prieta 1989 Oakland—title 6.93 91.68
15 787 Loma prieta 1989 Palo alto—SLAC lab 6.93 51.2
16 802 Loma prieta 1989 Saratoga—aloha ave 6.93 27.23
17 803 Loma prieta 1989 Saratoga—W valley 6.93 27.05
18 805 Loma prieta 1989 Stanford park. Garage 6.93 18.60
19 808 Loma prieta 1989 Treasure island 6.93 97.43
20 821 Erzican, Turkey 1992 Erzincan 6.69 8.97
21 879 Landers 1992 Lucerne 7.28 44.02
22 900 Landers 1992 Yermo fire station 7.28 85.99
23 953 Northridge-01 1994 Beverly hills 6.69 13.39
24 960 Northridge-01 1994 Canyon country 6.69 26.49
25 963 Northridge-01 1994 Castaic 6.69 40.68
26 1003 Northridge-01 1994 LA—saturn st 6.69 25.52
27 1004 Northridge-01 1994 LA—sepulveda 6.69 8.48
28 1007 Northridge-01 1994 Los angeles 6.69 36.47
29 1013 Northridge-01 1994 LA dam 6.69 11.79
30 1045 Northridge-01 1994 Newhall 6.69 21.55
31 1050 Northridge-01 1994 Pacoima Dam 6.69 20.36
32 1054 Northridge-01 1994 Pardee—SCE 6.69 25.65
33 1081 Northridge-01 1994 Stone canyon 6.69 21.75
34 1084 Northridge-01 1994 Converter sta 6.69 13.11
35 1085 Northridge-01 1994 Converter sta east 6.69 13.60
36 1106 Kobe, Japan 1995 KJMA 6.90 18.27
37 1116 Kobe, Japan 1995 Shin-osaka 6.90 45.97
38 1119 Kobe, Japan 1995 Takarazuka 6.90 38.60
39 1120 Kobe, Japan 1995 Takatori 6.90 13.12
40 1148 Kocaeli, Turkey 1999 Arcelik 7.51 53.68
41 1170 Kocaeli, Turkey 1999 Sakarya 7.51 90.66
42 1176 Kocaeli, Turkey 1999 Yarimca 7.51 19.30
43 1182 Chi-chi, Taiwan 1999 CHY006 7.62 40.47
44 1197 Chi-chi, Taiwan 1999 CHY028 7.62 32.67
45 1198 Chi-chi, Taiwan 1999 CHY029 7.62 39.70
46 1231 Chi-chi, Taiwan 1999 CHY080 7.62 31.65
47 1244 Chi-chi, Taiwan 1999 CHY101 7.62 31.96
48 1504 Chi-chi, Taiwan 1999 TCU067 7.62 28.70
49 1550 Chi-chi, Taiwan 1999 TCU136 7.62 48.75
50 1602 Duzce, Turkey 1999 Bolu 7.14 41.27
 (b) Ordinary ground motions
Seq. RSN Event Year Station M EpiD (km)
1 432 Taiwan SMART1(25) 1983 SMART1 O01 6.50 100.64
2 1036 Northridge-01 1994 Mojave—hwys 14 6.69 102.24
3 1163 Northridge-01 1994 Rinaldi receiving sta 7.51 101.86
4 1217 Chi-chi, Taiwan 1999 CHY060 7.62 91.08
5 1471 Chi-chi, Taiwan 1999 TCU015 7.62 101.62
6 1747 Little skull mtn, NV 1992 Station #8 5.65 99.66
7 1789 Hector mine 1999 Hesperia—4th and palm 7.13 98.53
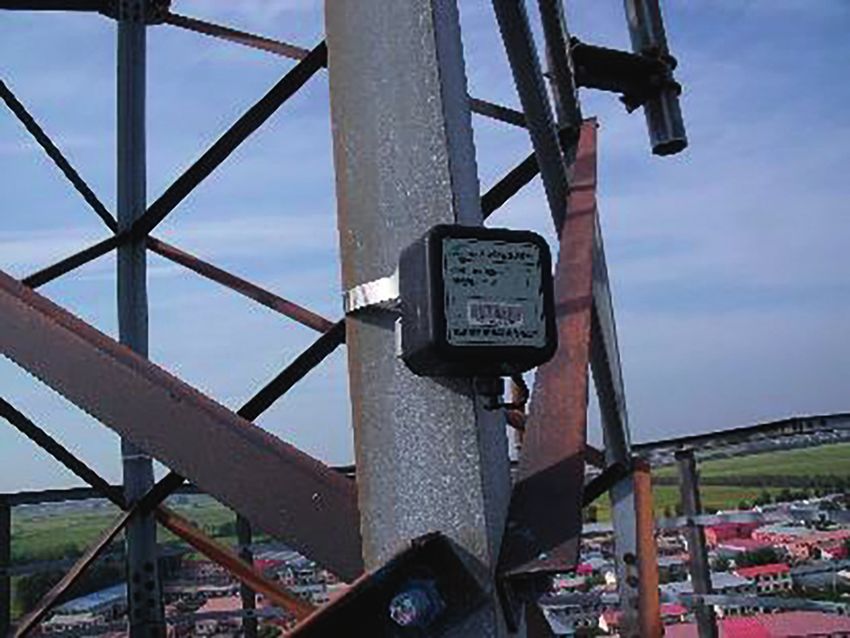
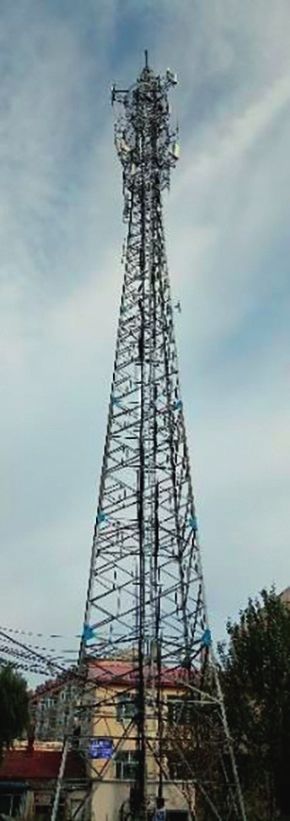
4 Shock and Vibration

 Table 1: Continued.
 (a) Pulse-like ground motions
Seq. RSN Event Year Station M EpiD (km)
8 1929 Anza-02 2001 Corona 4.92 101.56
9 1969 Anza-02 2001 Riverside 4.92 101.05
10 1973 Anza-02 2001 Riverside Airport 4.92 99.31
11 1995 Gulf of California 2001 El Centro Array #11 5.7 102.56
12 2178 Chi-chi, Taiwan-02 1999 CHY054 6.20 100.24
13 2833 Chi-chi, Taiwan-02 1999 KAU078 6.20 100.58
14 2959 Chi-chi, Taiwan-05 1999 CHY055 6.20 102.15
15 2961 Chi-chi, Taiwan-05 1999 CHY057 6.20 100.40
16 2965 Chi-chi, Taiwan-05 1999 CHY061 6.20 100.17
17 2966 Chi-chi, Taiwan-05 1999 CHY062 6.20 100.04
18 2988 Chi-chi, Taiwan-05 1999 CHY100 6.20 99.39
19 2990 Chi-chi, Taiwan-05 1999 CHY107 6.20 98.67
20 3072 Chi-chi, Taiwan-05 1999 ILA062 6.20 102.97
21 3073 Chi-Chi, Taiwan-05 1999 ILA064 6.20 102.68
22 3074 Chi-chi, Taiwan-05 1999 ILA066 6.20 99.75
23 3165 Chi-chi, Taiwan-05 1999 TCU033 6.20 99.89
24 3194 Chi-chi, Taiwan-05 1999 TCU085 6.20 100.36
25 3280 Chi-chi, Taiwan-06 1999 CHY044 6.30 101.89
26 3286 Chi-chi, Taiwan-06 1999 CHY055 6.30 100.75
27 3287 Chi-chi, Taiwan-06 1999 CHY057 6.30 100.89
28 3291 Chi-chi, Taiwan-06 1999 CHY061 6.30 101.92
29 3292 Chi-chi, Taiwan-06 1999 CHY062 6.30 101.03
30 3316 Chi-chi, Taiwan-06 1999 CHY100 6.30 98.81
31 3392 Chi-Chi, Taiwan-06 1999 ILA066 6.30 100.46
32 3484 Chi-chi, Taiwan-06 1999 TCU094 6.30 100.17
33 3531 Chi-chi, Taiwan-06 1999 TTN024 6.30 100.37
34 3584 Taiwan SMART1(25) 1983 SMART1 I10 6.50 99.30
35 3585 Taiwan SMART1(25) 1983 SMART1 I11 6.50 99.33
36 3586 Taiwan SMART1(25) 1983 SMART1 I12 6.50 99.36
37 3587 Taiwan SMART1(25) 1983 SMART1 M02 6.50 99.47
38 3590 Taiwan SMART1(25) 1983 SMART1 M05 6.50 98.24
39 3601 Taiwan SMART1(25) 1983 SMART1 O09 6.50 99.68
40 3783 Hector mine 1999 Beaumont 7.13 98.80
41 3883 Tottori, Japan 2000 HRS017 6.61 100.23
42 3917 Tottori, Japan 2000 OKY014 6.61 100.93
43 3946 Tottori, Japan 2000 SMN018 6.61 102.27
44 3957 Tottori, Japan 2000 SMNH13 6.61 99.33
45 4152 Niigata, Japan 2004 FKS021 6.63 98.33
46 4154 Niigata, Japan 2004 FKS023 6.63 98.25
47 4240 Niigata, Japan 2004 TCG009 6.63 101.23
48 4244 Niigata, Japan 2004 TCGH09 6.63 101.85
49 5001 Chuetsu-oki, Japan 2007 FKSH01 6.80 99.92
50 5060 Chuetsu-oki, Japan 2007 GNM001 6.80 100.83

platform of the tower with a height of 48.2 m (Figure 3). Pile 4.3. Structural Response. The function of the communication
foundations were used for the tower, and the soil was hard, tower is to support the transmission antenna to receive and
which can be approximately equivalent to the fixed con- transmit signals in an area. The dynamic response to the
straint at the bottom. According to the conversion rela- tower under an earthquake is principally monitored by using
tionship between the fundamental frequency and the first the maximum roof drift (MRD) of the tower top relative to
period, the natural periods in X and Y directions of the actual the tower bottom. Furthermore, as a lattice high-rise steel
structure and finite element model were derived, as pre- structure, the communication tower exhibits a large accel-
sented in Table 5. The natural period difference between the eration amplification effect at the top of the tower under the
finite element model and the prototype structure of both action of a horizontal earthquake, whereas the communi-
directions was less than 15%, which revealed the finite el- cation antenna and the tower top platform are mainly linked
ement model of communication tower based on ABAQUS to by bolts. The amplified acceleration at the top of the tower
be acceptable and reliable. exhibits a large dynamic response to the connected bolts.
Shock and Vibration 5

 Table 2: IMs considered in this study.
 IMi
Class Expression
 Notation Definition/references
 PGA Peak ground acceleration PGA � max|a(t)|
 PGV Peak ground velocity PGV � max|](t)|
Amplitude parameters
 PGD Peak ground displacement PGD � max|d(t)|
 V/A Ratio of peak velocity to peak acceleration PGV/PGA
 EPA Effective peak acceleration EPA � Sa /2.5
 EPV Effective peak velocity EPV � Sv /2.5
Spectrum parameters 2.5
 SI Housner spectral intensity SI (ζ) � 0.1 SV (ζ, T)dt
 Sa(T1) Spectral acceleration at the fundamental period Sa (T1 , ξ)
 Udu Consistent duration Udu � i ti
Duration parameters
 Sdu Duration of strong ground motion S90 � t95 − t5
 t
 CAV Cumulative absolute velocity CAV � 0max |a(t)|d(t)
 t +1
 CAVS Standard cumulative absolute velocity CAVS � i ti Wi |a(t)|d(t)
 i t
Energy parameters MIV Maximum incremental speed MIV � max( 0max a(t)d(t))
 t
 MID Maximum incremental displacement MID � max( 0max v(t)d(t))
 t
 AI Arias intensity IA � π/2g 0 a2 (t)dt

 Table 3: Mechanical properties of Q345 and Q235.
Material Yield stress (Pa) Strain-hardening ratio Young’ modulus (Pa) Poisson’s ratio Density (kg/m3)
Q345 3.45 E + 8 1.37 2.06 E + 11 0.3 7850
Q235 2.35 E + 8 2.06 E + 11 0.3 7850

 1200 1547 1894 2241 2594

 10
 27

 1750
 854

 1600

 1600
 1600

 1
 5000

 87
 10
 1800

 11 1694
 11

 27
 10

 55

 1750 1750
 1700
 1700

 56
 1700

 5000

 5000
 5000
 5000

 5000
 1600

 2

 7000
 55
 11
 11
 16
 3
 1700

 1700
 1700

 11
 28

 1719
 1600

 16
 111
 875
 879

 871

 3
 5000

 832

 20

 1750
 1876
 1567 1911 2261 2608
 33
 12

 2 3 4 3500
 4 1
 5000

 3480 5
 11 4392
 98
 1750

 11
 98
 54
 7000

 5
 13 1721

 1696
 50000

 13

 20

 11
 90

 8

 9
 176
 04

 6 1467
 1750

 A A
 04

 7000

 1609

 1652
 5000
 13

 12
 9

 87
 176
 7000

 6
 1750

 6 128 733
 3
 114 7
 1723

 27
 1652

 9
 9

 86
 186
 1750

 13
 1850
 5000

 7 86
 13 5186
 4392
 7
 6
 5000

 8 5959
 5166
 2000
 26

 3

 9
 85
 6000

 1800

 221
 23

 00

 1986
 23

 20

 1653
 6000
 202

 2000
 5000

 3
 160

 1600

 Z
 221
 7
 67

 993
 9
 17

 827
 1600

 2000
 3
 67

 231
 18

 Y 5959 6910
 X
 Plan A-A 8 9

 Figure 1: Sketch of the prototype Structure (unit: mm).
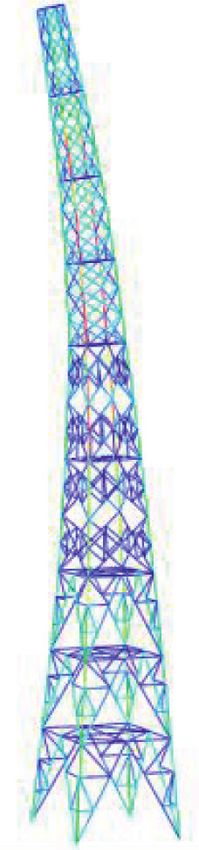
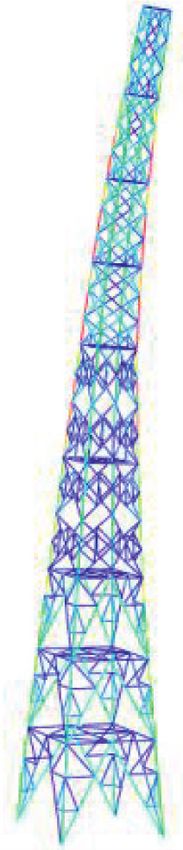
6 Shock and Vibration

 Table 4: Components size.
Legs (unit: mm) Braces (unit: mm) Added mass (kg)
L80 x 6 L50 x 5 1003.3
L100 x 8 L56 x 5 971.6
L125 x 10 L63 x 5 1126.7
L140 x 12 L63 x 5 1247.8
L160 x 14 L63 x 5 273.4
L180 x 16 L70 x 5 290.6
L180 x 16 L80 x 6 270.3
L200 x 16 L90 x 7 280.5
L200 x 18 L100 x 7 295.6

 Z Z

 X Y X Y
 Step: Step-1 Step: Step-1
 Mode 1: Value = 119.62 Freq = 1.7407 (cycles/time) Mode 2: Value = 119.70 Freq = 1.7413 (cycles/time)
 Primary Var: S, Mises Primary Var: S, Mises
 Deformed Var: U Deformation Scale Factor: +5.001e+00 Deformed Var: U Deformation Scale Factor: +5.001e+00
 (a) (b)

 Z

 X Y
 Step: Step-1
 Mode 3: Value = 1348.4 Freq = 5.8443 (cycles/time)
 Primary Var: S, Mises
 Deformed Var: U Deformation Scale Factor: +5.001e+00
 (c)

 Figure 2: Mode shapes of (a) first order, (b) second order, and (c) third order.
Shock and Vibration 7

 (a) (b)

Figure 3: Measured real (a) angle steel and (b) example of the installed three-directional acceleration transducers used for the
measurements.

Table 5: Comparison of the natural periods between the model and used to perform regression analysis on the obtained n scatter
the prototype structure. points (IMi, EDPi) to obtain the empirical regression lines of
 X Y ln(IMi) and ln(EDP) and obtain the conditional logarithmic
 F (Hz) T1 (s) f (Hz) T1 (s) standard deviation, as follows.
Prototype tower 1.51 0.66 1.50 0.67 �����������������������
 2
FE model 1.74 0.57 1.74 0.57 ln(EDP) − ln a · IMbi (2)
Difference - 13.6% - 14.9% βln(EDP|IMi ) � .
 n−2

Therefore, the acceleration amplification factor (AAF) at the For any intensity measure IMi, the smaller the condi-
top of the tower is a critical structural dynamic response tional logarithmic standard deviation, βln(EDP|IMi ), is the
demand parameter. Therefore, in this study, MRD and AAF smaller the discrete type of seismic response to engineering
were assigned as EDP. The structural response to the structure is, indicating that the efficiency of the ground
communication tower under the action of pulse-like ground motion parameter IMi is higher, otherwise, the efficiency is
motions and ordinary ground motions along the X direction lower.
is listed in Table 6. Under the action of pulse-like ground motions and
 ordinary ground motions, the conditional logarithmic
 standard deviation, βln(E DP|ItMi ), corresponding to the in-
5. Evaluation of IM tensity measures to be analysed, and the structural dynamic
5.1. Results in Terms of Efficiency. The efficiency of intensity response (MRD and AAF) was calculated by using the cloud
measures reveals that under a certain ground motion in- analysis method, as displayed in Figure 4.
tensity condition, the discrete engineering structure requires (1) For MRD and AAF, the conditional logarithmic
small parameters. On the premise of not lowering the cal- standard deviation βln(E DP|ItMi ) of spectrum pa-
culation accuracy, the estimated conditional probability rameters is the smallest, that is, among the four
P(E DP|ItM) can be reduced, and the number of seismic aforementioned four ground motion intensity pa-
records and dynamic time history analysis conditions re- rameters, spectrum parameters are the most
quired for analysis can be reduced to a certain extent. effective.
Typically, the validity of ground motion parameters is de- (2) Figure 4(a) reveals for the MRD, under the action of
termined by conditional logarithmic standard deviation β to pulse-like ground motions and ordinary ground
judge, and efficiency is the core index used to measure the motions, with the exception that the conditional
superiority over an IMi [19]. logarithmic standard deviation βln(E DP|ItMi ) corre-
 The relationship between the EDP and IMi approxi- sponding to Sa(T1) is basically equal, the values of
mately satisfies the logarithmic relationship, and its rela- other intensity measures corresponding to pulse-like
tionship formula is displayed as follows: ground motions are smaller. The MRD are predicted
 ln(EDP) � ln(a) + b · ln IMi . (1) more efficiently with pulse-like ground motions than
 with ordinary motions, that is, regression models are
 The aforementioned formula satisfies the univariate better fitted to data from the pulse-like ground
linear regression model, and the least square principle can be motion set than to that from ordinary sets.
8 Shock and Vibration

Table 6: Structural responses to pulse-like GMs and ordinary GMs. close under the action of pulse-like ground motions
 Pulse-like GMs Ordinary GMs
 and ordinary ground motions.
Sequence MRD (mm) AAF No. MRD (mm) AAF (4) The aforementioned results revealed that for MRD
PL1 50 4.13 OR1 20 8.63
 and AAF, the discrete type of ground motion pa-
PL2 30 2.81 OR 2 20 9.47 rameters considered in this study were less than that
PL3 78 4.89 OR3 70 13.71 under ordinary ground motion. From the perspec-
PL4 43 4.65 OR4 40 15.87 tive of efficiency, the top-five most effective intensity
PL5 110 7.80 OR5 60 8.71 measures are amplitude parameter PGA, spectrum
PL6 72 5.71 OR6 3 8.64 parameters Sa (T1) and EPA, and energy parameters
PL7 210 4.79 OR7 14 5.56 CAV and CAVs. The logarithmic standard deviation
PL8 160 6.89 OR8 1 5.88 βln(EDP|IMi ) from duration parameter conditions is
PL9 380 10.14 OR9 1 7.11 higher than 0.5, representing large discrete and
PL10 110 8.10 OR10 1 7.38 unreliable intensity measures.
PL11 270 4.04 OR11 7 10.36
PL12 160 6.20 OR12 5 8.06
PL13 140 5.77 OR13 25 8.82 5.2. Results in Terms of Practicality. Practicality refers to
PL14 150 6.14 OR14 30 10.91 whether a direct correlation exists between an IM and the
PL15 70 4.74 OR15 22 12.64 engineering demand placed on the structure. For a specified
PL16 130 6.24 OR16 11 8.82 intensity measure, the practicability is not strong, which
PL17 500 14.32 OR17 30 7.68 indicates that the seismic response to the engineering
PL18 160 7.79 OR18 20 9.13 structure is slightly influenced by the change in this pa-
PL19 170 8.19 OR19 10 8.16 rameter. The quantitative index of practicability can be
PL20 270 10.76 OR20 8 7.30 assessed by using linear regression coefficient b given in (1).
PL21 80 5.25 OR21 15 13.75 The larger the value of b is, the greater the influence of the
PL22 110 5.77 OR22 20 6.64
 change of intensity measures on the seismic response to
PL23 220 6.40 OR23 3 3.87
PL24 150 6.66 OR24 20 10.09 engineering structures is, that is, the stronger the correlation
PL25 120 2.91 OR25 43 9.37 is, the higher the practicability is; if the value of b is close to 0,
PL26 320 5.63 OR26 5 6.00 the change in intensity measures does not affect the seismic
PL27 210 8.88 OR27 16 9.42 response to engineering structures [20]. An example of the
PL28 100 6.26 OR28 20 8.09 relative practicality of intensity measures is displayed in
PL29 180 5.57 OR29 46 11.51 Figure 5.
PL30 390 6.19 OR30 18 13.29 The regression coefficient b corresponding to various
PL31 100 6.54 OR31 10 10.94 intensity measures can be derived by fitting the straight line
PL32 140 7.58 OR32 6 8.93 of (1), as displayed in Figure 6. For intensity measures, the
PL33 80 6.91 OR33 15 10.46
 requirements of efficiency and practicability must be si-
PL34 250 5.88 OR34 16 9.87
PL35 110 5.06 OR35 16 10.46
 multaneously met; therefore, only the practicability of the
PL36 80 7.07 OR36 24 13.82 five most effective ground motion parameters evaluated in
PL37 190 9.15 OR37 120 4.75 the previous step can be compared. The practicability of the
PL38 250 7.56 OR38 20 10.41 selected intensity measures under the action of pulse-like
PL39 200 5.67 OR39 9 4.79 ground motions is stronger than that under the action of
PL40 50 4.93 OR40 16 9.60 ordinary ground motions. For the spectrum parameters EPA
PL41 140 12.22 OR41 22 9.02 and Sa(T1), the regression coefficient b corresponding to
PL42 70 5.58 OR42 4 5.57 Sa(T1) is larger. Thus, the practicability of Sa(T1) is stronger
PL43 80 7.45 OR43 16 8.50 than EPA. This result reveals that Sa(T1) related to the vi-
PL44 150 7.94 OR44 3 5.21 bration characteristics of the structure is more sensitive to
PL45 130 6.81 OR45 20 6.14
 the structural demand parameters than EPA. Furthermore,
PL46 40 4.13 OR46 23 7.53
PL47 90 5.91 OR47 40 12.10 according to Figure 6(a) and 6(b), the regression coefficient b
PL48 150 7.65 OR48 5 6.81 corresponding to CAVs under ordinary ground motion is
PL49 100 7.05 OR49 2 4.75 close to 0, indicating poor practicability, that is, there is small
PL50 140 8.99 OR50 8 4.30 or no dependence of the level of engineering demand on the
 CAV level. Typically, the amplitude parameter PGA, spec-
 trum parameter Sa(T1), and energy parameter CAV are
 (3) Figure 4(b) reveals that for the AAF, βln(EDP|IMi ) highly practical.
 corresponding to the duration parameters (Udu and
 Sdu) and CAV in the energy parameters under the 5.3. Results in Terms of Sufficiency. Sufficiency is a crucial
 action of pulse ground motion is significantly less index to assess the independence of the ground motion
 than that under the action of ordinary ground parameter and indicates the correlation between the ground
 motion, while the values of βln(EDP|IMi ) corre- motion parameter (IMi) and ground motion information
 sponding to other ground motion parameters are parameter (magnitude M or source-to-site distance R). A
Shock and Vibration 9

 1.0

 0.8
 βIn (MRD|IM)
 0.6

 0.4

 0.2

 0.0
 PGA

 PGV

 PGD

 V/A

 EPA

 EPV

 SI

 MIV

 MID

 AI
 Sa (T1)

 Udu

 Sdu

 CAV

 CAVS
 Amplitude parm Spectrum parm Time parm Enerny parm
 Intensity measure, IM
 pulse-like GMs
 ordinary GMs
 (a)
 1.0

 0.8
 βIn (AAF|IM)

 0.6

 0.4

 0.2

 0.0
 PGA

 PGV

 PGD

 V/A

 EPA

 EPV

 SI

 MIV

 MID

 AI
 Sa (T1)

 Udu

 Sdu

 CAV

 CAVS

 Amplitude parm Spectrum parm Time parm Enerny parm
 Intensity measure, IM
 pulse-like GMs
 ordinary GMs
 (b)

Figure 4: Reveals the following: (a) MRD and (b) AAF, obtained from the cloud analysis subjected to pulse-like and ordinary ground
motions.

 In (EDP)=ln (a)+b·ln (IMi)

 IM1 IM2
 More
 Parctical
 In (EDP)

 b1
 b2

 Less
 Parctical

 In (IM)
 Figure 5: Example of the relative practicality of intensity measures.
10 Shock and Vibration

 1.2

 1.0
 Regression coefficient b

 0.8

 0.6

 0.4

 0.2

 0.0
 PGA

 PGV

 PGD

 V/A

 EPA

 EPV

 SI

 MIV

 MID

 AI
 Sa (T1)

 Udu

 Sdu

 CAV

 CAVS
 Amplitude parm Spectrum parm Time parm Enerny parm
 Intensity measure, IM
 pulse-like GMs
 ordinary GMs
 (a)
 0.4
 Regression coefficient b

 0.3

 0.2

 0.1

 0.0
 PGA

 PGV

 PGD

 V/A

 EPA

 EPV

 SI

 MIV

 MID

 AI
 Sa (T1)

 Udu

 Sdu

 CAV

 CAVS

 Amplitude parm Spectrum parm Time parm Enerny parm
 Intensity measure, IM
 pulse-like GMs
 ordinary GMs
 (b)

Figure 6: Regression coefficient, b, corresponding to the engineering demanded parameters (a) MRD and (b) AAF, obtained from the cloud
analysis subjected to pulse-like and ordinary ground motions.

sufficient ground motion parameter should be statistically magnitude and source-to-site distance F-text are displayed
independent of the ground motion information parameter. in Figure 8. The results reveal that under the action of or-
If the demand residuals and seismic information parameters dinary ground motions, the p value among PGA, CAV, and
are not statistically independent of each other, the p value of magnitude M is equal to 0, indicating a complete linear
regression analysis would be less than the given significance correlation and sufficiency is 0. If PGA or CAV is taken as
level, indicating that the sufficiency of IMi is poor. The p IM to select the ground motions for the dynamic time
value of 0.05 was considered the cutoff for an insufficient history analysis of the floor four-leg angle steeled com-
IMi. If the p value value is larger, the sufficiency of IM would munication tower, the results are strongly related to the
be stronger [21]. Because of the limitations on the length of magnitude of the earthquake event. Under the action of
the article, only the scatter and fitting line expressions of the pulse-like ground motions, the p value between PGA and
required residual of AAF and magnitude M when PGA is a source-to-site distance R is equal to 0, demonstrating
ground motion parameter are presented in Figure 7. complete linear correlation. Only the correlation coefficient
 The p values derived from the three highly practical p value between the spectrum parameter Sa(T1) and the
intensity measures PGA, Sa(T1), and CAV for the seismic magnitude M or source-to-site distance R is greater than the
Shock and Vibration 11

 0.8

 0.6

 Residual of ln (AAF)|PGA
 0.4

 0.2

 0.0

 -0.2

 -0.4
 Res=0.096M-0.658
 -0.6 p-value=0.35

 5.7 6.0 6.3 6.6 6.9 7.2 7.5 7.8
 M
 Figure 7: Testing the sufficiency of PGA with respect to M for predicting AAF.

 0.8 1.0
 0.85
 0.8
 0.6 0.55 0.7
 0.66
 0.5 0.63 0.63
 0.45 0.6 0.58 0.56
 0.43
 p-value

 p-value

 0.4
 0.4 0.49
 0.35
 0.32 0.41
 0.3 0.4 0.35
 0.3
 0.2
 0.2
 0.11 0.2

 0 0 0
 0.0 0.0
 PGA Sa (T1) CAV PGA Sa (T1) CAV
 Intensity measure, IM Intensity measure, IM
 MRD under pulse-like GMs MRD under pulse-like GMs
 MRD under ordinary GMs MRD under ordinary GMs
 AFF under pulse-like GMs AFF under pulse-like GMs
 AFF under ordinary GMs AFF under ordinary GMs
 (a) (b)

Figure 8: Median p values obtained from investigating the sufficiency of typical IMi with respect to (a) magnitude and (b) source-to-site
distance.

given significance level of 0.05 under the action of pulse-like pulse-like ground motions, and ordinary ground motions,
ground motions or ordinary ground motions, that is, it was determined from the perspectives of efficiency, prac-
satisfies the sufficiency requirements. ticability, and sufficiency.
 Briefly, for the lattice tower such as the communication
 (1) For MRD and AAF, the discrete type of ground
tower, irrespective of whether under the action of pulse-like
 motion parameters considered in this study is less
and ordinary ground motions, the most suitable intensity
 than that under the action of impulse ground mo-
measure is the spectral acceleration Sa(T1) corresponding to
 tion. From the perspective of efficiency, the top-five
the natural period of the structure from the three aspects of
 most effective intensity measures are amplitude
efficiency, practicability, and sufficiency.
 parameter PGA, spectrum parameter Sa(T1) and
 EPA, and energy parameter CAV and CAVs. The
6. Conclusions duration parameters are discrete and noneffective
In this study, a standard floor four-leg angle steel com- intensity measures.
munication tower was considered. Based on the cloud (2) Under the action of pulse ground motion, the
analysis method, a linear logarithmic regression fitting practicability of the selected intensity measures is
method of intensity measures, considering the uncertainty of stronger than that of ordinary ground motion. For
input ground motion, the optimal intensity measures under the spectrum parameters EPA and Sa(T1), Sa(T1) is
12 Shock and Vibration

 more practical than EPA. Furthermore, the regres- of Earthquake Engineering, vol. 19, no. 11, pp. 4311–4337,
 sion coefficient b corresponding to CAVs under 2021.
 ordinary ground motion is close to 0, indicating that [7] M. Sadeghi, F. Mohajeri, and E. Khalaghi, “Seismic perfor-
 the practicability is considerably poor. Typically, the mance and communication failure of cell phone towers in
 amplitude parameter PGA, spectrum parameter Iran’s seismic zones, case study: developing structural and
 communicational fragility curves for 24M monopole tower,”
 Sa(T1), and energy parameter CAV are highly
 in Proceedings of the 7th International Conference on Urban
 practical. Earthquake Engineering (7CUEE) &5th International Con-
 (3) For the lattice tower, such as the communication tower, ference on Earthquake Engineering (5ICEE), Tokyo Institute of
 irrespective of whether the measure is under the action Technology, Tokyo, Japan, March 2010.
 of pulse-like ground motion or ordinary ground mo- [8] L. Tian, X. Gai, and B. Qu, “Shake table tests of steel towers
 tion, considering from the three aspects of efficiency, supporting extremely long-span electricity transmission lines
 practicability, and sufficiency, the most suitable inten- under spatially correlated ground motions,” Engineering
 Structures, vol. 132, pp. 791–807, 2017.
 sity measure is the spectral acceleration Sa(T1) corre-
 [9] L. Tian, R. Ma, and B. Qu, “Influence of different criteria for
 sponding to the natural period of the structure. selecting ground motions compatible with IEEE 693 required
 The scalar intensity measures are considered in this response spectrum on seismic performance assessment of
study. In a subsequent study, the vector intensity measures electricity transmission towers,” Engineering Structures,
can be elaborated. vol. 156, pp. 337–350, 2018.
 [10] G. G. Amiri and S. R. Massah, “Seismic response to4-legged
 self-supporting telecommunication tower,” IJE Transactions
Data Availability B: Applications, vol. 20, no. 2, pp. 107–126, 2007.
 [11] M. A. Khedr and G. McClure, “A simplified method for seismic
The data used to support the findings of this study are analysis of lattice telecommunication towers,” Canadian Journal
available from the corresponding author upon request. of Civil Engineering, vol. 27, no. 3, pp. 533–542, 2000.
 [12] N. Luco and C. A. Cornell, “Structure-specific scalar intensity
Conflicts of Interest measures for near-source and ordinary earthquake ground
 motions,” Earthquake Spectra, vol. 23, no. 2, pp. 357–392,
The authors declare that they have no conflicts of interest. 2007.
 [13] J. W. Baker, Vector-valued Ground Motion Intensity Measures
Acknowledgments for Probabilistic Seismic Demand Analysis [D], Stanford
 University, California, 2006.
The authors gratefully acknowledge the financial support [14] Q. H. Lai, J. J. Hu, L. L. Xie, J. Y. Tan, and Z. F. Zhao,
provided by the Scientific Research Fund of Institute of “Correlation analysis potential damage parameters of pulse-
Engineering Mechanics, China Earthquake Administration like ground motion,” World Earthquake Engineering, vol. 36,
(Grant nos. 2020EEEVL0503 and 2019EEEVL0304) and no. 1, pp. 35–43, 2020, (Chinese).
scientific research fund project of Binzhou University (Grant [15] C. Zhai, C. Li, S. Kunnath, and W. Wen, “An efficient al-
 gorithm for identifying pulse-like ground motions based on
no. BZXYLG2102).
 significant velocity half-cycles,” Earthquake Engineering &
 Structural Dynamics, vol. 47, no. 3, pp. 757–771, 2018.
References [16] F. Jalayer and C. A. Cornell, A Technical Framework for
 Probability-Based Demand and Capacity Factor Design
 [1] L. Tian, X. Zhang, and X. Fu, “Collapse simulations of (DCFD) Seismic Formats, Pacific Earthquake Engineering
 communication tower subjected to wind loads using dynamic Center (PEER), California, USA, 2003.
 explicit method,” Journal of Performance of Constructed Fa- [17] F. Jalayer, R. De Risi, and G. Manfredi, “Bayesian cloud
 cilities, vol. 34, no. 3, 2020. analysis: efficient structural fragility assessment using linear
 [2] X. Fu, H.-N. Li, L. Tian, J. Wang, and H. Cheng, “Fragility regression,” Bulletin of Earthquake Engineering, vol. 13, no. 4,
 analysis of transmission line subjected to wind loading,” pp. 1183–1203, 2015.
 Journal of Performance of Constructed Facilities, vol. 33, no. 4, [18] A. K. Kazantzi and D. Vamvatsikos, “Intensity measure se-
 2019. lection for vulnerability studies of building classes,” Earth-
 [3] Z. Meng, G. F Zhao, L. L Wang, and J. Li, “Wind-induced quake Engineering & Structural Dynamics, vol. 44, no. 15,
 coupling vibration effects of high-voltage transmission tower- pp. 2677–2694, 2015.
 line systems,” Shock and Vibration, vol. 2017, Article ID [19] E. Hossein, J. Fatemeh, L. Andrea, M. Fabrizio, and
 1205976, 34 pages, 2017. M. Gaetano, “Preliminary ranking of alternative scalar and
 [4] X. Wang, “Thoughts left by the 311 earthquake in Japan,” City vector intensity measures of ground shaking,” Bulletin of
 and disaster reduction, vol. 2017, no. 5, pp. 31–35, 2017, Earthquake Engineering, vol. 13, pp. 2805–2840, 2015.
 (Chinese). [20] J. E. Padgett, B. G. Nielson, and R. DesRoches, “Selection of
 [5] A. W. Liu, S. Xia, H. S. Lv, K. Chen, and W. J. Xu, “Typical optimal intensity measures in probabilistic seismic demand
 damage analysis for mobile communication base stations in models of highway bridge portfolios,” Earthquake Engineering
 the extremely damage area of Wenchuan earthquake,” Tele- & Structural Dynamics, vol. 37, no. 5, pp. 711–725, 2008.
 com Engineering Technics and Standardization, vol. 25, no. 12, [21] M. Yakhchalian and G. Ghodrati Amiri, “A vector intensity
 pp. 82–86, 2012, (Chinese). measure to reliably predict maximum drift in low- to mid-rise
 [6] H. Pan, C. Li, and L. Tian, “Seismic fragility analysis of buildings,” Proceedings of the Institution of Civil Engineers -
 transmission towers considering effects of soil-structure in- Structures and Buildings, vol. 172, no. 1, pp. 42–54, 2019.
 teraction and depth-varying ground motion inputs,” Bulletin
You can also read