Detection of electromagnetic anomalies of three earthquakes in Mexico with an improved statistical method
←
→
Page content transcription
If your browser does not render page correctly, please read the page content below
Nat. Hazards Earth Syst. Sci., 11, 2021–2027, 2011
www.nat-hazards-earth-syst-sci.net/11/2021/2011/                                                   Natural Hazards
doi:10.5194/nhess-11-2021-2011                                                                           and Earth
© Author(s) 2011. CC Attribution 3.0 License.                                                     System Sciences

Detection of electromagnetic anomalies of three earthquakes in
Mexico with an improved statistical method
O. Chavez1 , R. Pérez-Enrı́quez2 , J. A. Cruz-Abeyro2 , J. R. Millan-Almaraz1 , A. Kotsarenko2 , and E. Rojas1
1 División
          de Investigación y Posgrado, Facultad de Ingenierı́a, Universidad Autónoma de Querétaro, Centro Universitario,
Cerro de las Campanas s/n, Querétaro, Querétaro, C.P. 76010, México
2 Centro de Geociencias (CGEO), Juriquilla, UNAM, Apdo Postal 1-742, Centro Querétaro, Querétaro, México,

C.P. 76001, México
Received: 22 March 2011 – Revised: 25 May 2011 – Accepted: 26 May 2011 – Published: 21 July 2011

Abstract. A method for detecting seismomagnetic signals              Kushwah et al., 2009). This frequency range is of practical
is presented. This work presents evidence of geomagnetic             importance in relation with EQ activity, since these waves
perturbations associated with three earthquakes (EQs) that           are able to propagate easily on the Earth’s surface where a
occurred in Mexico within a distance of ρ = (1.8) 100.45M ,          ULF sensor is installed (Ida et al., 2008).
where M is the magnitude of the EQ, during the year 2010.               The serious problem regarding these seismogenic ULF
An improved statistical analysis in relation with the polariza-      emissions is the detection of these weak signals. Different
tion analysis (as the ratio of vertical magnetic field compo-        methods of analysis have been developed: polarization anal-
nent to the horizontal one) has been developed. The variation        ysis by means of the ratio of vertical magnetic field compo-
index (S4 ) shows important differences one day before and           nent to the horizontal (Hayakawa et al., 1996), fractal anal-
one day after the EQs (magnitudes considered are from 6 to           ysis (mono- and multi-) (Hayakawa et al., 1999; Gotoh et
7.2).                                                                al., 2004; Smirnova et al., 2004; Ida et al., 2005; Ida and
                                                                     Hayakawa, 2006; Kotsarenko et al., 2004, 2005, 2007), prin-
                                                                     cipal component analysis (Gotoh et al., 2002; Hattori et al.,
1   Introduction                                                     2004; Kotsarenko et al., 2005), and singular value decompo-
                                                                     sition (Hattori et al., 2006), among others.
Evidence of electromagnetic emission at several frequen-                All the aforementioned methods are applied to improve
cies associated with EQs has been accumulated over the               both the detection of the ULF signals associated with seismo-
years (e.g., Hayakawa and Molchanov, 2002; Molchanov                 genic phenomena at different frequencies (Hayakawa et al.,
and Hayakawa, 2008). The presence of strong interferences            2008), and the understanding of electromagnetic phenom-
hampers the accumulation of the experimental data to test            ena associated with tectonic and volcanic activity (Currenti
existing ideas on the mechano-electromagnetic conversion             et al., 2005a, b). In this paper, a simple polarization anal-
in the Earth’s crust (Guglielmi et al., 2006). In addition,          ysis which is the simplest analysis method has been used.
many authors perform the signal processing in a wide fre-            But we have looked into the problem variation in order to
quency ranges reporting geomagnetic perturbations related to         improve the statistical method. This improved polarizations
EQs. Such anomalies have been reported for several decades           statistical method was applied to the ULF data observed in
(Parrot and Johnston, 1989; Johnston, 1997; Kushwah et               Mexico during the year 2010. We found a significant corre-
al., 2009; Telesca and Hattori, 2007; Telesca et al., 2008).         lation in the data obtained for three EQs in Mexico near the
Seismogenic phenomena in the ULF (ultra low frequency)               observing station, within the earthquake radius preparation
range, with frequency from 0.005 to 1 Hz (Kopytenko et al.,          zone (ρ), as a modification of the previously stated equa-
1993) related with EQs has been studied since Fraser-Smith           tion proposed by Dobrovolsky et al. (1979) and Dobrobolsky
et al. (1990) and a number of papers have been published on          (1993b), where ρ = (1.8) 100.45M , where M is the magnitude
this topic after that (Smirnova et al., 2004; Serita et al., 2005;   of the EQ (Fig. 1). Finally, the results obtained in this pa-
                                                                     per would be compared with earlier results obtained with the
                                                                     wavelet method (Chavez et al., 2010).
                     Correspondence to: O. Chavez
                     (omar.chavez@uaq.mx)

Published by Copernicus Publications on behalf of the European Geosciences Union.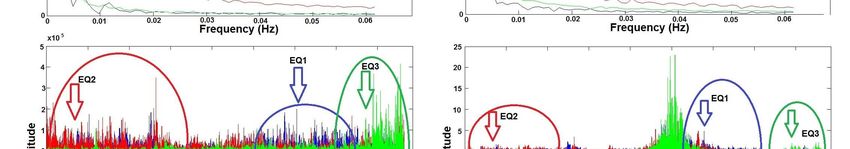
2022                                     O. Chavez et al.: Detection of electromagnetic anomalies of three earthquakes in Mexico
             1

             2
Fig. 1. The relative
              3      location of the geomagnetic observatory, Juriquilla (JU2) and three EQs (indicated by black stars) occurring during the
year 2010.
             4     Figure 1. The relative location of the geomagnetic observatory, Juriquilla (JU2) and three EQs

2             5    (indicated
     ULF geomagnetic      databy
                               andblack
                                    EQsstars) occurring during the 2010  year. emissions (Ida et al., 2008), while the geomagnetic
                                                                     mogenic
              6                                                      field variation are found to show smaller values (Hayakawa
ULF geomagnetic data is obtained at an observatory named             et al., 1996),
Juriquilla (JU2) (geographic coordinates: −100.45◦ N,
20.70◦ E) as in Fig. 1. At this field site we observe three geo-        The time series of the ULF data was processed to obtain
magnetic components (H : N-S component, D: E-W compo-                the polarization signals Z/H and Z/D from the three geomag-
nent, and Z: vertical component) by means of fluxgate sen-           netic components H , D, and Z as was previously reported
sors. The sampling frequency is 1 Hz. The analysis focused           by Ida et al. (2008). Furthermore, the Fast Fourier Trans-
on three rather big EQs (with magnitude greater than 6.0)            form (FFT) is performed to the polarization signals to obtain
within a distance to the station of ρ = (1.8) 100.45M , where M      the power spectrum. Figure 2 shows three ratio signals corre-
is the magnitude of the EQ. All the events occurred during           sponding to the FFT spectra of each one of the three seismic
the year 2010. The first EQ took place on 4 April, the second        events. This was performed in order to analyze the compo-
on 30 June, and the third on 10 August. The characteristics          nents of the frequency previously associated to seismogenic
of the EQs are presented in Table 1. The distance between            ULF emissions (Hayakawa et al., 2007). It can be observed
the EQs and the geomagnetic observatory is consistent with           that FFT spectrum is not adequate to show significant dif-
that considered in a previous study (Chavez et al., 2010). In        ferences or common patterns between the three FFT spectra.
such study the perturbations associated with the magnitude           For that reason, a Discrete Wavelet Transform (DWT) anal-
of the EQs could be observed.                                        ysis was used to analyze the three ratio signals. This type
                                                                     of analysis was selected due to its time-frequency decom-
                                                                     position capabilities. This methodology has been previously
3 Signal analysis                                                    reported for co-seismic event detection in H13, D, and Z com-
                                                                     ponents (Chavez et al., 2010). For this study, six DWT levels
The polarization method developed by Hayakawa et                     were analyzed using a wavelet mother function Daubechies
al. (1996) is based on the measurement of the ratio of spec-         1 (DB1), but we present only the D6 for comparative reasons
tral power of the vertical magnetic field (Z) to the horizon-        (see Fig. 2). Table 2 shows the frequency bands correspond-
tal magnetic fields (H and D) (i.e., Z/H or Z/D). This ratio         ing to each DWT analysis level for signals that were sampled
is known to provide information of related variations of the         at a frequency of 1 Hz. The first event is presented in blue,
geomagnetic field of ionospheric origin (or solar-terrestrial        the second in red, and the third in green (see Table 1).. Some
effect) or seismic origin (Ida et al., 2008). Generally speak-       frequency activity can be inferred from highest observable
ing, the polarization ratio becomes larger when there are seis-      amplitude during the D6 level of the DWT decomposition at

Nat. Hazards Earth Syst. Sci., 11, 2021–2027, 2011                                 www.nat-hazards-earth-syst-sci.net/11/2021/2011/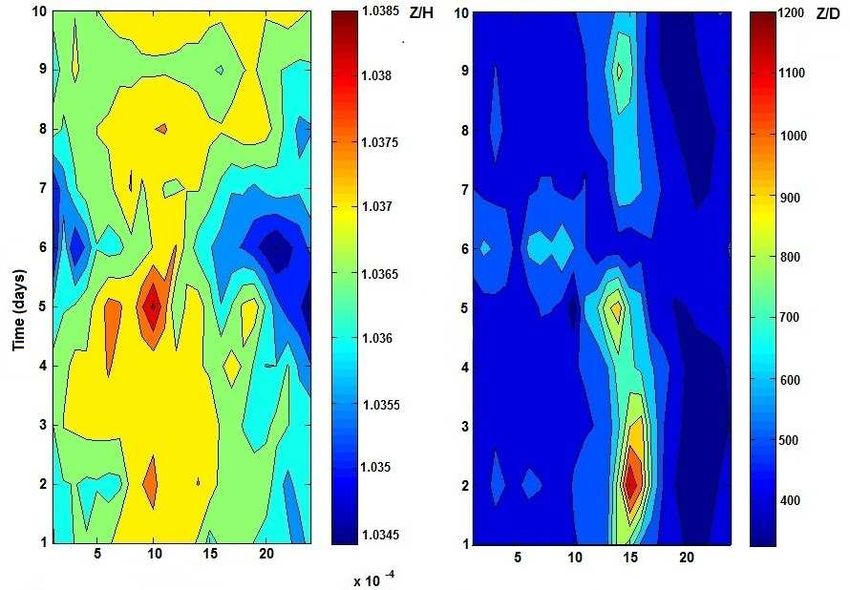
O. Chavez et al.: Detection of electromagnetic anomalies of three earthquakes in Mexico 2023
Table 1. Earthquakes occurring in Mexico during 2010 (magnitude greater than 6) selected for this analysis. Year/month/day/hour/min
are: the exact time of the EQ (Local Time); Latitude and Longitude: the geographic coordinates of the epicenter; Magnitudes and Depth:
magnitude and depth of the EQ; Distance: the distance between the epicenter and Juriquilla station; ρ: the radius of the EQ preparation zone
estimated by the proposed equation. The EQ magnitudes are presented in bold.
Event Year Month Day Hour Min Longitude Latitude Magnitude, M Depth, km Distance, km ρ, km Distance/ρ
1 2010 4 4 17 40 −115.36 32.54 7.2 10 1974 2245 0.87
2 2010 6 30 2 22 −98.03 16.22 6.0 8 563 684 0.82
3 2010 8 23 21 11 −107.23 18.44 6.1 10 751 755 1.00
1
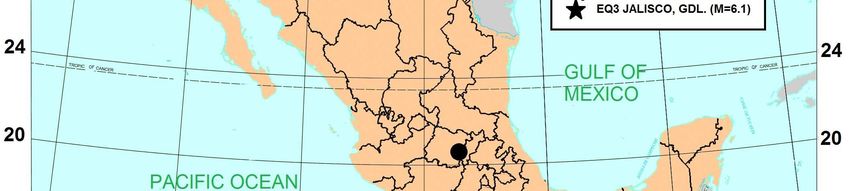
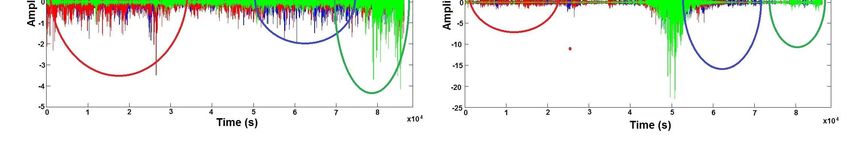
Fig. 2. Geomagnetic data analyzed: The first event is presented in blue, the second in red, and the third in green. The FFT analysis does
2 Figure 2. Geomagnetic data analyzed: The first event is presented in blue, the second in red,
not show important peaks. Included is a Discrete Wavelet Transform (DWT) of the Z/H and Z/D ratio in a superposed analysis in the ULF
frequency range = 0.0078125
3 f and the thirdtoin
0.015625
green. Hz.
TheThe main
FFT seismicdoes
analysis shocks
notare shown
show with arrows.
important peaks. And Wavelet
4 Discrete Transform of the Z/H and Z/D ratio in a superposed analysis in the ULF frequency
5 signals
the start of the rangefollowed
f =0.0078125 to 0.015625
by amplitude Hz. The
suppression pe-main it
seismic
can be shocks
observedarethat
shown with arrows.
important amplitudes in each level are
riods. The aforementioned behaviour is common to the three present. The values of Z/H and Z/D are computed as repre-
analyzed seismic events. There are some important peaks senting the daily data. This process implies that the distance
during the EQs in different frequency ranges, e.g., for the of analysis is directly associated to the magnitude of the EQ.
three EQs we have significant increases from the D2 to the
D6 (0.0078125–0.25 Hz). Those results can be associated
with the distance and the magnitude of the EQs.
4 Observation results
Furthermore, Fig. 2 also shows the corresponding DWT
decomposition for the signals Z/D ratio, where the middle An improved variation index method is proposed herein. The
cluster during the day is the principal perturbation. However superposed epoch analysis was performed over the basis of 5
www.nat-hazards-earth-syst-sci.net/11/2021/2011/ Nat. Hazards Earth Syst. Sci., 11, 2021–2027, 2011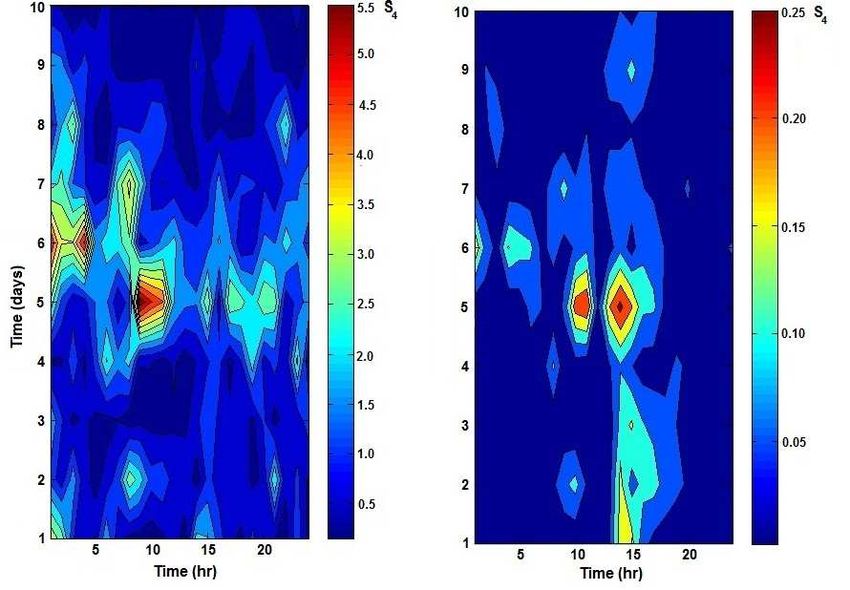
2024 O. Chavez et al.: Detection of electromagnetic anomalies of three earthquakes in Mexico
Table 2. DWT decomposition bandwidths in Hz for a sampling
frequency fs = 1 Hz.
Level Approximation (An) Detail (Dn)
1 0 to 0.25 Hz 0.25 to 0.5 Hz
2 0 to 0.125 Hz 0.125 to 0.25 Hz
3 0 to 0.0625 Hz 0.0625 to 0.125 Hz
4 0 to 0.03125 Hz 0.03125 to 0.0625 Hz
5 0 to 0.015625 Hz 0.015625 to 0.03125 Hz
6 0 to 0.0078125 Hz 0.0078125 to 0.015625 Hz
1
1
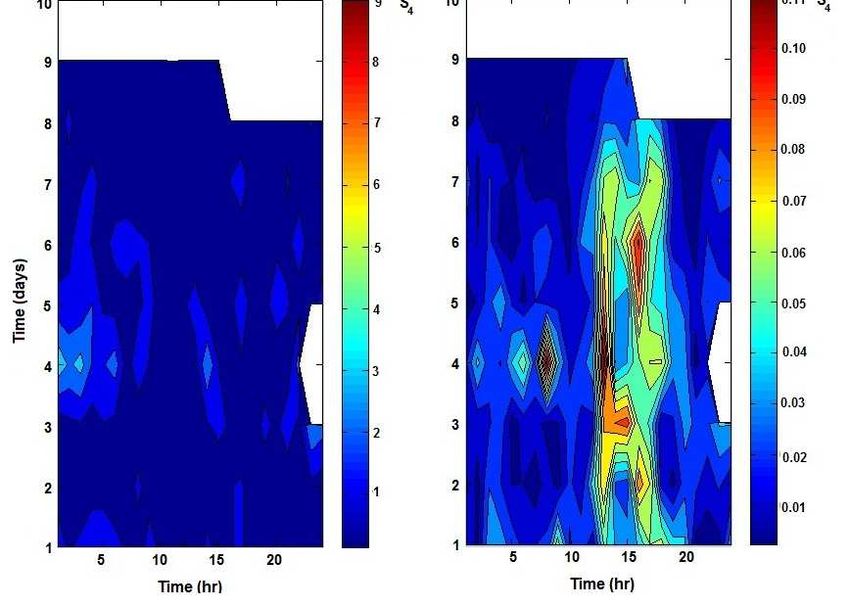
2 Fig. 4. Map
Figure 4. Mapshowing the time
showing theseries
timeofseries
the analysis for analysis
of: The the first for the fi
second event Z/H and Z/D top right and left, respectively. At the
3 top right
bottom, and left,index
the variation respectively.
for Z/H (left),At
andthe
for bottom,
Z/D (right).the variation ind
There
are no data in the white areas.
4 (right). There is no data in the white areas.
5
the standard deviation of the same component i ratio over the
whole period.
Figures 3, 4 and 5 illustrate the temporal evolution of the
analysis (Z/D and Z/H) during the period of 5 days before
2 and 5 days after the EQs (see Table 1). The day of each
EQs occurrence is during the 5th day, and its specific time
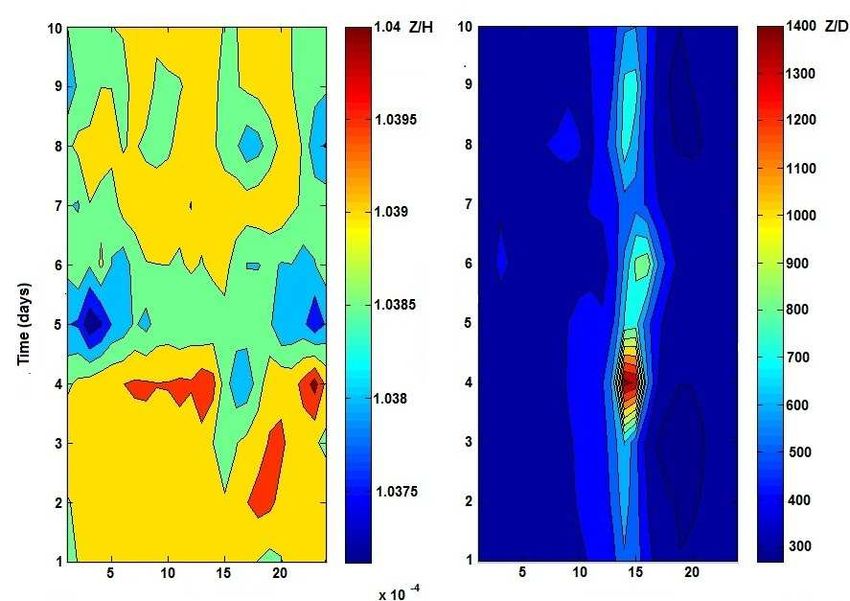
3 Figure
Fig. 3. 3. Map
Map showing
showing the the
timetime
seriesseries
of theof:analysis
the analysis
for thefor
firstthe first event Z/H
is shown (top right),
in Table and3 shows the corresponding anal-
1. Figure
event Z/H (top right), and Z/D (top left). At the bottom, the variation ysis (on top) and the variation index obtained for the first
4 Z/D (top left). At the bottom, the variation index for Z/H (left), and for Z/D (right).
index for Z/H (left), and for Z/D (right). event. Important increments on the variation index are ob-
5 served 7 h before and almost 12 h after the event. Also it
is observed that these variations are observed only around
days before and 5 days after the EQ. The variation index is day 5. Figure 4 shows this same analysis, but in this case
defined by, the white areas indicate the periods where data could not be
σi recorded due to some problems of the ULF system. How-
S4 = (1) ever, 24 h before and 24 h after the main shock an impor-
x
tant increase in the variation index was observed. The in-
where S4 is the variation index considering a mean period crement variation index is mainly associated to the Z/D ra-
of ten days and for the i ratio (i = Z/H and Z/D), x is the tio. The Z/H ratio has similar changes as those observed
average of the component i over the whole period, and σi is in Fig. 4, where a sudden decrease on this value previous
Nat. Hazards Earth Syst. Sci., 11, 2021–2027, 2011 www.nat-hazards-earth-syst-sci.net/11/2021/2011/
15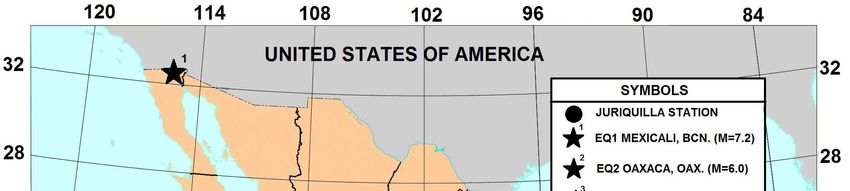
O. Chavez et al.: Detection of electromagnetic anomalies of three earthquakes in Mexico                                          2025

1
2    Figure
    Fig.      5. Map
         5. Map        showing
                  showing         the
                           the time     timeof:series
                                     series            of: Theforanalysis
                                                The analysis      the third for the third event Z/H, and Z/D top
    event Z/H, and Z/D top right and left, respectively. At the bottom,
3    right
    the     and left,
        variation indexrespectively.     At for
                        for Z/H (left), and  theZ/D
                                                  bottom,
                                                     (right). the variation index for Z/H (left), and for Z/D
4   (right).
5   to the main shocks is shown. In the last figure, important
    increases in the variation index are observed almost 30 h             Fig. 6. Dst Index obtained from Kyoto observatory web page cor-
    before and 10 h after the EQ. Figure 6 shows certain en-              responding with the 3 EQs analyzed. The period of time presented
    hancement in the Z/H and Z/D plots just before, during,               is 10 days.
    and after the EQs and also shows significant increments in
    the variation index. The data was compared with the geo-
    magnetic activity expressed by the Dst index (data obtained           5    Conclusions
    from http://wdc.kugi.kyoto-u.ac.jp/dstdir/) where those in-
    dices apparently had no correlation with EQs variation index
                                                                          There are seismo-magnetic signals related to EQs disturbing
    (see Fig. 5).
                                                                          the electromagnetic field. The principal problem of the sig-
       The increase in the polarization and the variation index re-
                                                                          nal detection is the discrimination of the background noise.
    sulted not only from the increase in Z/H, but also from the
                                                                          For that reason, the use of the DWT at different levels is
    increase and decrease of Z/D. These figures show a signif-
                                                                          proposed. Additionally, an improved statistical polarization
    icant increase of the variation index occurs before, during,
                                                                          analysis method has been applied to the ULF geomagnetic
    and after the EQs. The indices of Dst and Kp did not show
                                                                          data at Juriquilla station in Mexico. The three geomagnetic
    important changes during this period. This indicates that the
                                                                          field components recorded behave in different ways; for that
    polarization and the statistical analysis are closely associated
                                                                          reason a general variation index17is used to estimate the per-
    with occurrence of EQs. The three EQs analyzed exhibit sig-
                                                                          turbations for each polarization during the whole period. By
    nificant changes.
                                                                          using the variation index, it is found that the polarization ratio
                                                                          between the vertical and the horizontal magnetic field com-
                                                                          ponents (Z/H, Z/D) at different levels (see Table 2) exhibits

    www.nat-hazards-earth-syst-sci.net/11/2021/2011/                                Nat. Hazards Earth Syst. Sci., 11, 2021–2027, 2011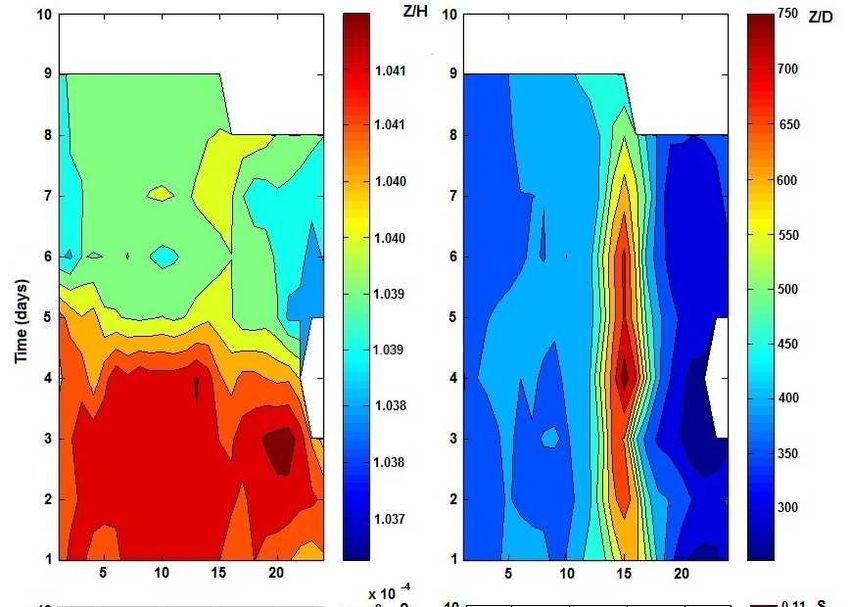
2026                                      O. Chavez et al.: Detection of electromagnetic anomalies of three earthquakes in Mexico

significant clusters during the day of analysis. An increase            Hattori, K., Serita, A., Yoshino, C., Hayakawa, M., and Isezaki, N.;
in the variation index value, with the maximum value a few                 Singular spectral analysis and principal component analysis for
hours before and after the EQs, are observed. The applica-                 signal discrimination of ULF geomagnetic data associated with
tion of a DWT filter using different levels in order to obtain             2000 Izu Island earthquake swarm, Phys. Chem. Earth, 31, 281–
frequency components that correspond to associated seismic                 291, 2006.
                                                                        Hayakawa, M., Kawate, R., Molchanov, O. A., and Yumoto, K.: Re-
anomalies shows that there are not predetermined favorable
                                                                           sults of ultra-low-frequency magnetic field measurements during
frequency ranges – apparently it depends on the direction,                 the Guam earthquake of 8 August 1993, Geophys. Res. Lett.,
the distance, and the magnitude of each EQ analyzed. This                  26(18), 2797–2800, 1996.
kind of ULF lead time seems to be consistent with a previ-              Hayakawa, M., Ito, T., and Smirnova, N.: Fractal analysis of ULF
ous work by Chavez et al. (2010). The epicentral distance of               geomagnetic data associated with the Guam earthquake on 8 Au-
these three superficial EQs varies from 563 to 1974 km.                    gust 1993, Geophys. Res. Lett., 26, 18, 2797–2800, 1999.
                                                                        Hayakawa, M. and Molchanov, O.: Seismo Electromagnet-
Acknowledgements. The authors are grateful to CONACyT and                  ics Lithosphere-Atmosphere-Atmosphere-Ionosphere Coupling,
Centro de Geociencias of the National University of Mexico                 TERRAPUB, Tokyo, Japan, 477, 2002.
(UNAM) for their support and collaboration in this research under       Hayakawa, M., Hattori, K., and Ohta, K.: Monitoring of ULF (ultra-
the project number 209837.                                                 low-frequency) geomagnetic variations associated with earth-
                                                                           quakes, Sensors, 7, 1108–1122, 2007.
Edited by: M. E. Contadakis                                             Hayakawa, M., Hattori, K., and Ohta, K.: Observation of ULF Geo-
Reviewed by: two anonymous referees                                        magnetic Variations and Detection of ULF Emissions Associated
                                                                           with Earthquakes: Review, Electric Engineering in Japan, 162, 4,
                                                                           Traslated from Denki Gakkai Ronbunshi, 126-A, 12, December
References                                                                 2006, 1238–1244, 2008.
                                                                        Ida, Y. and Hayakawa, M.: Fractal analysis for the ULF data dur-
Chavez, O., Millan-Almaraz, J. R., Pérez-Enrı́quez, R., Arzate-           ing the 1993 Guam earthquake to study prefracture criticality,
   Flores, J. A., Kotsarenko, A., Cruz-Abeyro, J. A., and Rojas, E.:       Nonlin. Processes Geophys., 13, 409–412, doi:10.5194/npg-13-
   Detection of ULF geomagnetic signals associated with seismic            409-2006, 2006.
   events in Central Mexico using Discrete Wavelet Transform, Nat.      Ida, Y., Hayakawa, M., Adalev, A., and Gotoh, K.: Multifrac-
   Hazards Earth Syst. Sci., 10, 2557–2564, doi:10.5194/nhess-10-          tal analysis for the ULF geomagnetic data during the 1993
   2557-2010, 2010.                                                        Guam earthquake, Nonlin. Processes Geophys., 12, 157–162,
Currenti, G., Del Negro, C., Lapenna, V., and Telesca, L.; Fluctua-        doi:10.5194/npg-12-157-2005, 2005.
   tion analysis of the hourly time variability of volcano-magnetic     Ida, Y., Yang, D., Li, Q., Sun, H., and Hayakawa, M.: Detection
   signals recorded at Mt. Etna volcano, Sicily (Italy), Chaos Soli-       of ULF electromagnetic emissions as a precursor to an earth-
   tons & Fractals, 23, 1921–1929, 2005a.                                  quake in China with an improved polarization analysis, Nat.
Currenti, C. Del Negro, C., Lapenna, V., and Telesca, L.: Scaling          Hazards Earth Syst. Sci., 8, 775–777, doi:10.5194/nhess-8-775-
   characteristics of local geomagnetic field and seismicity at Etna       2008, 2008.
   volcano and their dynamisc in relation to the eruptive activity,     Johnston, M. J. S.: Review of electric and magnetic fields accom-
   Earth Planet. Sci. Lett., 235, 96–106, 2005b.                           panying seismic and volcanic activity, Surv. Geophys., 18, 441–
Dobrovolsky, I. P., Zubkov, S. I., and Myachkin, V. I.: Estimation of      475, 1997.
   the size of earthquake preparation zones, Pure Appl. Geophys.,       Kopytenko, Y. A., Matiashvili, T. G., Voronov, P. M., Kopytenko,
   117, 1025–1044, 1979.                                                   E. A., and Molchanov, O. A.: Detection of ultra-low-frecuency
Dobrovolsky, I. P.: Analysis of preparation of a strong tectonic           emissions and its aftershock activity, based on geomagnetic pul-
   earthquake, Phys. Solid Earth, 28, 481–492, 1993.                       sations data at Dusheti and Vardzia observatories, Phys. Earth
Fraser-Smith, A. C., Bernardi, A., McGill, P. R., Ladd, M. E., Hel-        Planet. In., 77, 85–95, 1993.
   liwell, R. A., and Villard, O. G.: Low-frequency magnetic mea-       Kotsarenko, A., Pérez Enrı́quez, R., López Cruz-Abeyro, J. A.,
   surements near the epicenter of the Ms 7.1 Loma Prieta earth-           Koshevaya, S., Grimalsky, V., and Zúñiga, F. R.: Analysis of
   quake, Geophys. Res. Lett. 17, 1465–1468, 1990.                         the ULF electromagnetic emission related to seismic activity,
Guglielmi, A., Hayakawa, M., Potapov, A., and Tsegmed, B.: Po-             Teoloyucan geomagnetic station, 1998–2001, Nat. Hazards Earth
   larization method to detect the co-seismic magnetic oscillations,       Syst. Sci., 4, 679–684, doi:10.5194/nhess-4-679-2004, 2004.
   Phys. Chem. Earth, 31, 299–304, 2006.                                Kotsarenko, A., Molchanov, O., Hayakawa, M., Koshevaya, S., Gri-
Gotoh, K., Akaniga, Y., Hayakawa, M., and Hattori, K.: Princi-             malsky, V., Pérez Enrı́quez, R., and López Cruz-Abeyro, J. A.:
   pal component analysis of ULF geomagnetic data for Izu islands          Investigation of ULF magnetic anomaly during Izu earthquake
   earthquakes in July 2000, J. Atmos. Electr., 22, 1–12, 2002.            swarm and Miyakejima volcano eruption at summer 2000, Japan,
Gotoh, K., Hayakawa, M., Smirnova, N. A., and Hattori, K.: Fractal         Nat. Hazards Earth Syst. Sci., 5, 63–69, doi:10.5194/nhess-5-63-
   analysis of seismogenic ULF emissions, Phys. Chem. Earth, 29,           2005, 2005.
   419–424, 2004.                                                       Kotsarenko, A., Pérez Enrı́quez, R., López Cruz-Abeyro, J. A.,
Hattori, K., Serita, A., Gotoh, K., Yoshino C., Harada, M., Isezaki,       Koshevaya, S.,Grimalsky, V., Yutsis, V., and Kremenetsky, I.:
   N., and Hayakawa M.: ULF geomagnetic anomaly associated                 ULF geomagnetic anomalies of possible seismogenic origin ob-
   with 2000 Izu Islands earthquake swarm, Japan Physics and               served at Teoloyucan station, México, in 1999–2001: Interme-
   Chemistry of the Earth, Parts A/B/C, 29, 4–9, 425–435, 2004.

Nat. Hazards Earth Syst. Sci., 11, 2021–2027, 2011                                 www.nat-hazards-earth-syst-sci.net/11/2021/2011/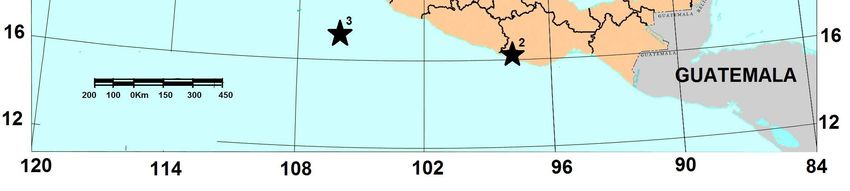
O. Chavez et al.: Detection of electromagnetic anomalies of three earthquakes in Mexico                                             2027

  diate and Short-Time Analysis, Tectonophysics, 431, 249–262,        Smirnova, N., Hayakawa, M., and Gotoh, K.: Precusory behavior of
  doi:10.1016/j.tecto.2006.05.036, 2007.                                fractal characteristics of the ULF electromagnetic fields in seis-
Kushwah, V., Singh, V., and Singh, B.: Ultra low frequency (ULF)        mic active zones before strong earthquakes, Phys. Chem. Earth,
  amplitude observed at Agra (India) and their association with re-     29, 445–451, 2004.
  gional earthquakes, Phys. Chem. Earth, 34, 367–272, 2009.           Telesca, L. and Hattori, K.: Non-Uniform scaling behavior in ultra-
Molchanov, O. A. and Hayakawa, M.: Seismo-Electromagnetics              low-frequency (ULF) earthquake-ralated geomagnetic signals,
  and Related Phenomena, History and latest results, TERRAPUB,          Physica A, 384, 522–528, 2007.
  Tokyo, Japan, 189, 2008.                                            Telesca, L., Lapenna, V., Macchiato, M., and Hattori, K.: Investigat-
Parrot, M. and Johnston, M. J. S.: Seismoelectromagnetic effects,       ing non-uniform scaling behavior in Ultra Low Frequency (ULF)
  Phys. Earth Planet. Int., 57, 177, 1989.                              earthquake-related geomagnetic signals, Earth Planet. Sci. Lett.,
Serita, A., Hattori, K., Yoshino, C., Hayakawa, M., and Isezaki,        268, 219–224, 2008.
  N.: Principal component analysis and singular spectrum analysis
  of ULF geomagnetic data associated with earthquakes, Nat.
  Hazards Earth Syst. Sci., 5, 685–689, doi:10.5194/nhess-5-685-
  2005, 2005.

www.nat-hazards-earth-syst-sci.net/11/2021/2011/                               Nat. Hazards Earth Syst. Sci., 11, 2021–2027, 2011
You can also read