DEPARTMENT OF THE ENVIRONMENT - Prince George's ...
←
→
Page content transcription
If your browser does not render page correctly, please read the page content below
DEPARTMENT OF THE ENVIRONMENT
PRINCE GEORGE’S COUNTY
         UNDERSTANDING THE RELATIONSHIP
      BETWEEN LAND USE PRACTICES & CLIMATE
                    CHANGE

                     Presentation of Initial Assessment
                              July 23, 2021

SUSTAINABILITYDIVISION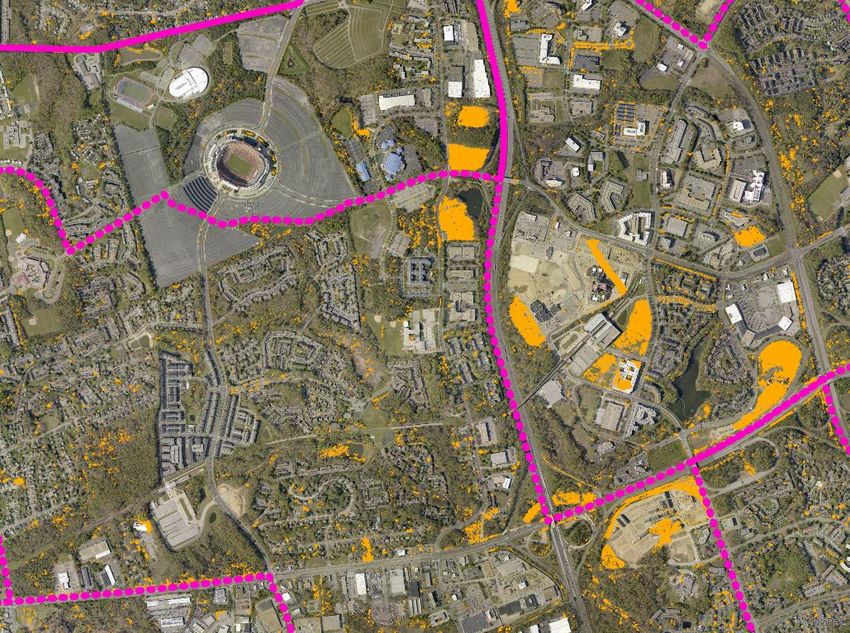
Central China-July21                               Germany-July 16                          Central China-July21
                       California- June 1

                                                                                                 Year 2021
                                                                                      A Summer of Disasters
                                                                                          Around the World
                               New York City- July 1
 Netherland- July 17

                                                                       ARE WE NEXT?
SUSTAINABILITYDIVISION
                                                          Pictures from Washington Post: A summer of floods July 22, 2021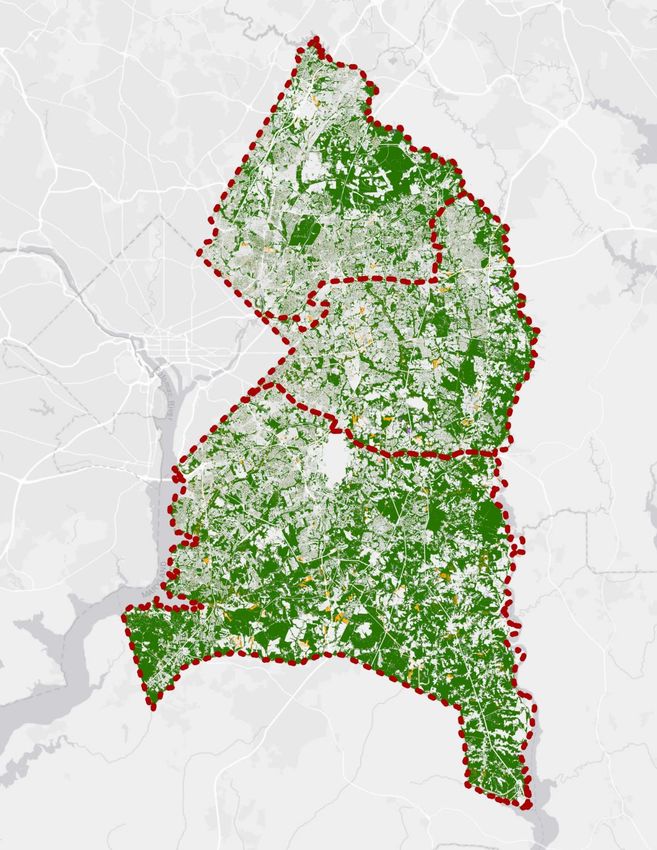
INTRODUCTION:
  On May 21, 2021, the Climate Action Commission approved (27) CAC Priority
  Recommendations as the basis of its Climate Action Plan. The success of the following
  CAC Priority Recommendations will be directly dependent on our County’s ability to
  both maintain and expand our County’s EXSITING TREE and FOREST COVER.

  #12-Establish a County no net loss policy. Strengthen Woodland Conservation Act. Create or expand existing
  incentives for residents and local businesses to plant trees that expand urban tree canopy.

  #21- Preserve the flood retention capacity of existing floodplains. Preserve and increase, if possible,
  the capacity of natural areas to manage additional flooding per future climate projections.

  #26- Integrate green infrastructure (GI) projects into County capital improvement budgets, including the prioritization
  of creating additional publicly accessible open, green spaces with potential for carbon sequestration on County
  properties. Prioritize nature-based solutions for carbon sequestration, flood prevention, and extreme heat mitigation
  by adopting and enforcing codes to require green infrastructure (GI) practices for new and existing properties.

SUSTAINABILITYDIVISION
PRESERVATION AND EXPANSION OF EXISTING TREE COVER WILL:
 MODERATE temperatures through shade/evapotranspiration.

 CREATE Community-wide flood resiliency to extreme precipitation events
 through natural ecosystem services which and increased flood storage.

 PROVIDE natural filters for clean air and water

 SEQUESTER CARBON to offset greenhouse gases

SUSTAINABILITYDIVISION
Are we recovering what we are losing
                         by planting trees instead of
                         preserving trees?

                         Will it be enough to provide our
                         County with resiliency for climate
                         change?

                         Is there enough time to allow trees to
                         grow to provide resiliency to climate
                         change’s extreme storm events?

SUSTAINABILITYDIVISION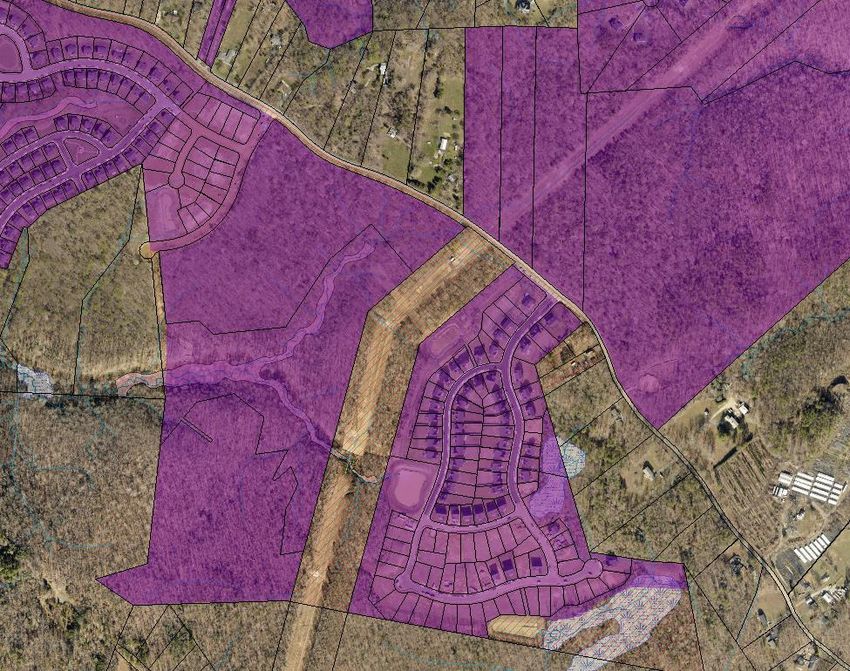
THERE IS ALSO ECONOMIC VALUE
                           OF EXISTING TREE CANOPY
                         Economic values quantified in 2013, based on 2009 canopy data
                         • 52%* Canopy Coverage BENEFITS:
                             • Removes more than 5,100 metric tons of air pollution worth
                               $21 million in 2013
                             • Absorbs 211,000 metric tons of carbon worth $16.6 million in
                               2013
                             • Stores 5 million metric tons of carbon over the lifetime of the
                               forest, valued at $395 million in 2013
                           • *University of Vermont data which tracks change over time.

SUSTAINABILITYDIVISION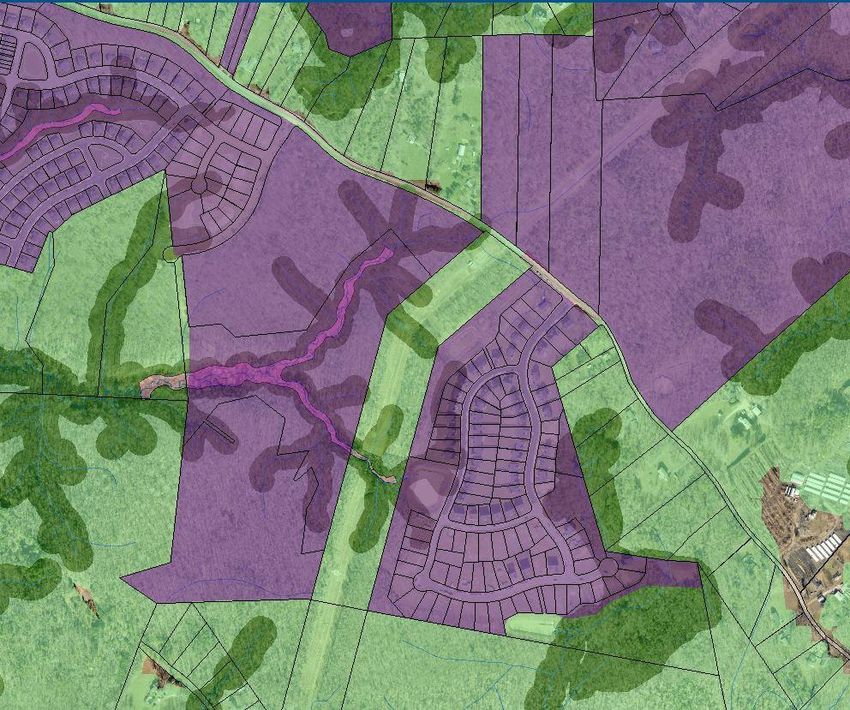
EXISTING RECOMMENDATIONS FROM CURRENT COUNTY
 PLANNING DOCUMENTS WHICH SUPPORT TREE CANOPY
                                                   Resource Conservation
             Plan 2035                          Plan(Functional Master Plan)
  • Recommends sustaining the combined        • Track forest and tree canopy coverage
    forest and tree canopy coverage at          countywide
    52%                                       • Place green infrastructure network as the
  • Recommends targeting land acquisition       highest priority areas for preservation,
    or ecological restoration activities to     restoration, and enhancement of natural
    stronghold watersheds.                      resources.
                                              • Focus conservation efforts on preserving
                                                existing forests and ensuring sustainable
                                                connectivity between forest patches
                                              • Improve overall human health by providing
                                                equitable access to connected open and
                                                green spaces throughout the County
SUSTAINABILITYDIVISION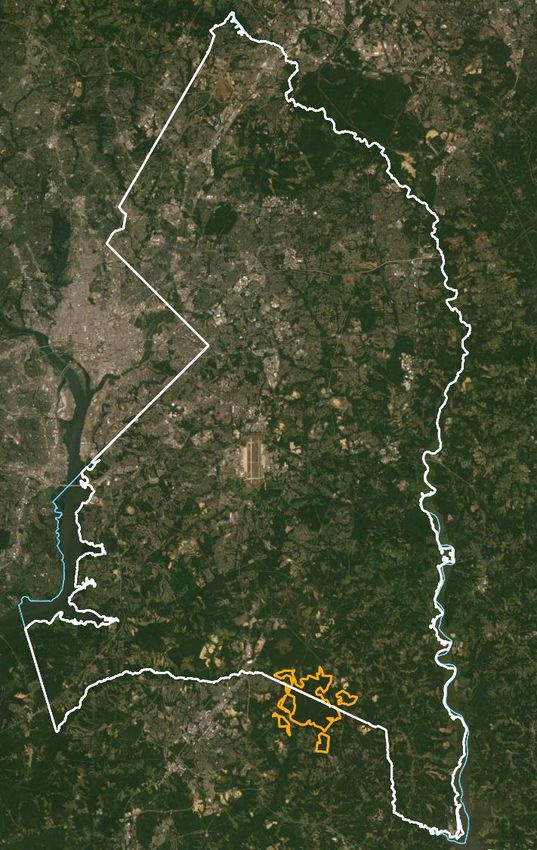
HOWEVER, OUR
     COUNTY’S EXISTING
     TREE COVER AND
     FORESTS ARE UNDER
     SIGNIFICANT THREAT
     FROM LAND
     DISTURBANCE
     ACTIVITIES.

SUSTAINABILITYDIVISION
PLEASE NOTE: The following slides discuss what
    appears to be an overall decline of the County’s
    existing tree cover. The data and timelines used for
    the initial findings are as follows:
    Chesapeake Bay Program:
    • 1-meter resolution data produced by the Chesapeake Conservancy (CC) and University
      of Vermont (UVM) for the years 2013/14 to 2017/18.
    • Measures tree canopy change during the period 2014-2018.
    • 2021/22 is forthcoming in the year 2023.

SUSTAINABILITYDIVISION
Tree Canopy Change
TREE CANOPY MEASURES 2014-2018
Gain
Loss
No change
From Plan 2035
• “[Sustain] the County’s combined forest
and tree canopy coverage at 52
percent.”
• “Increase tree canopy coverage
countywide with a focus on existing
communities where forest and tree
canopy coverage is sparse.”
SUSTAINABILITYDIVISIONTREE CANOPY CHANGE Tree Canopy Change
2014-2018
Gain
Tree canopy is decreasing* Countywide Loss
• 53.3% in 2014 No change
• 51.0% in 2018
Tree canopy change includes Countywide gains
and losses
• Gain: 514.7 acres
• Loss: 7,628.7 acres
• Net Loss: 7,114 Acres*
Relative decrease in tree canopy between
2014-2018 was 4.3%
*See Study Methodology Notes-Presentation Appendix.
SUSTAINABILITYDIVISIONNorth County
COUNTYWIDE TREE CANOPY
ree Canopy oss ain
by C C orth Central outh reas Central
County
South
Central
North
South
County
oss cres ain cres
SUSTAINABILITYDIVISIONEnvironmental
TREE CANOPY BY COUNTY TIERS Strategy Area
Tier 1 | Developed
Tier 2 | Developing
Tier 3 | Rural
Tier 4 | CBCA
4
3
2
1
SUSTAINABILITYDIVISIONHOW MANY
CEDARVILLE STATE
FORESTS
IS THAT?
Cedarville State Forest is an MD
DNR-owned forest protection area
on the border between Prince
George’s and Charles County. It is
5.7 square miles in total size.
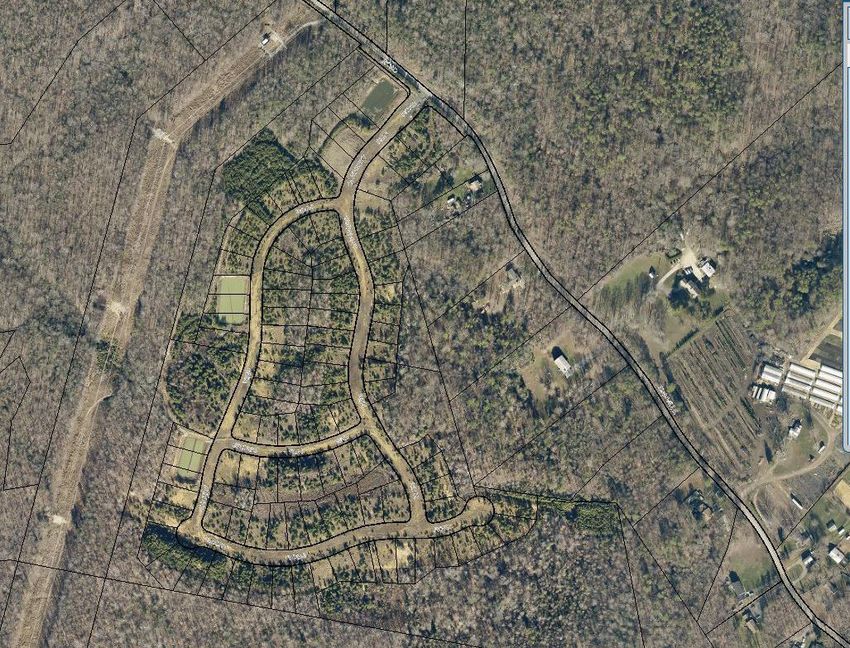
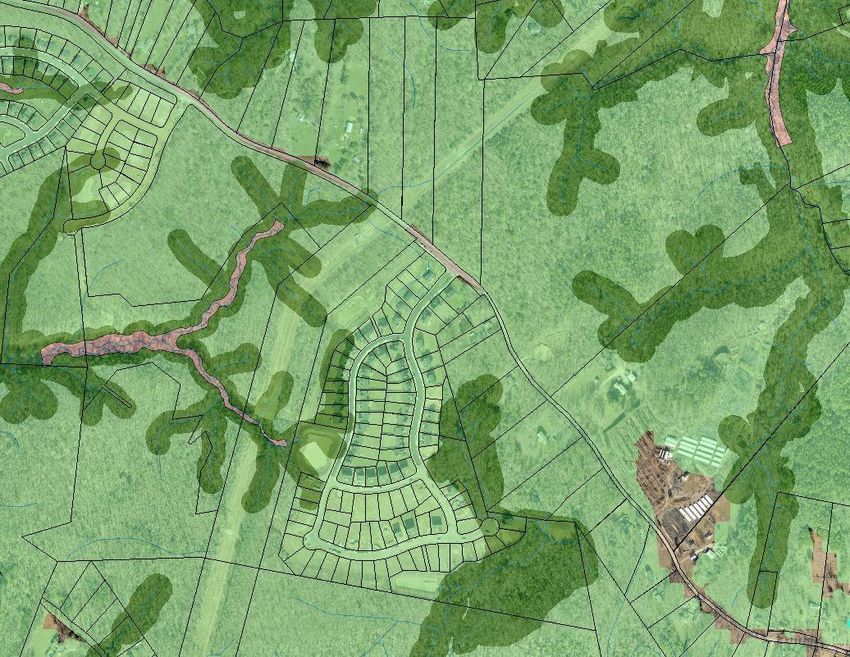
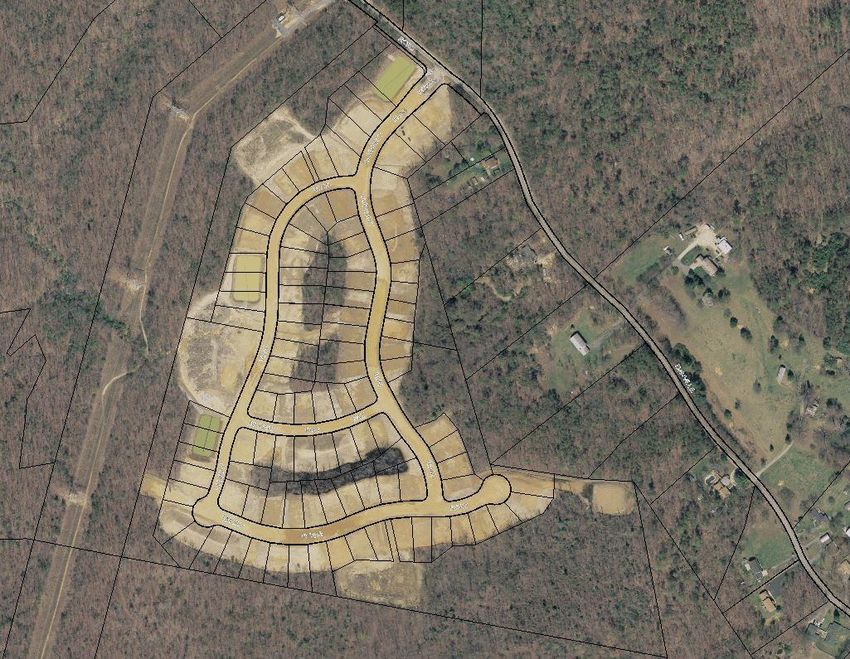
SUSTAINABILITYDIVISIONEXAMPLE: LAND DISTURBANCE
AND TREE CANOPY CHANGE
Preliminary Plans as recorded 2007 - Present
Total Gross Acreage of
61,538 Acres
Preliminary Plan Area
Estimated Tree Canopy in 2018 21,494 Acres
% total Cedarville State
land area Forest Equivalent
Estimated Tree Canopy (2018) 35% ~6
Estimated Protected via
16% ~2.5
Woodland Conservation
Estimated Unprotected 19% ~3.5
SUSTAINABILITYDIVISIONWHAT APPROXIMATE AMOUNT OF PROTECTION
DOES THE TREE CANOPY ORDINANCE PROVIDE?
Tree Canopy Requirements by Zone
Zone Minimum Tree
Canopy Coverage
R-O-S, O-S, R-A Exempt Assuming 20% Canopy Required
R-E, R-L, V-L 20% Cedarville State
Acres
Forest Equivalent
R-S, R-R, R-80, R-55, R-35, R-20, R-T, R-30, R-30C, 15%
Total Gross Acreage of
R-18, R-18C, R-10, R-10A, R-H, R-U, R-M, R-M-H, 61,538 ~17
Preliminary Plan Area
V-M
C-A, C-O, C-S-C, C-1, C-C, C-G, C-2, C-W, C-M, 10% Minimum Tree Canopy
C-H, C-R-C, I-1, I-2, I-3, I-4, E-I-A, L-A-C, M-X-C, Required 12,308 ~3.5
(Gross Acreage x 20%)
M-U-I, M-U-T-C, M-X-T, M-A-C, U-L-I
*Note: Tree canopy coverage are required for Building and grading permits that propose 5,000 square feet or greater of gross floor area or disturbance.
Coverage requirements are based on the gross tract area. The tree canopy coverage requirements for the redevelopment of a previously developed site
that is not exempt are based on the area within the limit of disturbance as shown on any Site Plan. Waivers, Fee-In-Leu, and Offsite are possible-data on
frequency of developments utilizing these options not available.
SUSTAINABILITYDIVISIONWHAT PROTECTION DOES THE WOODLAND & WILDLIFE
HABITAT CONSERVATION ORDINANCE PROVIDE?
WCO Canopy Requirements by Zone
Zone Woodland Afforestation
Conservation Threshold
Threshold
R-O-S, O-S, R-A 50% 20% Assuming 20% Canopy Required
Cedarville
R-E, R-L, V-L 25% 20% Acres State Forest
R-S, R-R, R-80, R-55, R-35, R-20, R-T, R-30, R- 20% 15% Equivalent
30C, R-18, R-18C, R-10, R-10A, R-H, R-U, R-M, R- Total Net Acreage of
46,314 ~13
M-H, V-M Preliminary Plan Area
C-A, C-O, C-S-C, C-1, C-C, C-G, C-2, C-W, C-M, 15% 15% Minimum Tree Canopy
C-H, C-R-C, I-1, I-2, I-3, I-4, E-I-A, L-A-C, M-X-C, Required 9,262 ~2.5
M-U-I, M-U-T-C, M-X-T, M-A-C, U-L-I (Net Acreage x 20%)
*Note: WCO applies to applications pursuant to Subtitles 4 (Building Code), 24 (Subdivision Ordinance) and 27 (Zoning Ordinance) of the County Code; all
activities by a public utility; all activities of a unit of County or municipal government; and all activities delegated to the local jurisdiction by the State.
Coverage requirements are based on the net tract area. Based on Net Tract Area, requirements can be accomplished through Fee-In-Lieu , and/or Banks,
Offsite without on-site tree preservation.
SUSTAINABILITYDIVISIONTHEN Vs.NOW
Year 2000 Year 2020
SUSTAINABILITYDIVISIONWHAT COULD
OUR COUNTY BE
LIKE WITH EVEN
MORE TREES?
SUSTAINABILITYDIVISIONGREEN INFRASTRUCTURE NETWORK
Plan 2035 Our STUDY Question:
• Place green infrastructure network
“How much tree canopy has
as the highest priority areas for
preservation, restoration, and been gained/lost in the green
enhancement of natural resources. infrastructure network’s regulated
area between 2014 – 2018?”
SUSTAINABILITYDIVISIONCANOPY CHANGE IN GREEN INFRASTRUCTURE
NETWORK REGULATED AREAS
Tree canopy is decreasing Tree Canopy Change
• 74.1% in 2014 2014-2018
• 71.9% in 2018 Gain
Loss
Tree canopy gains and losses No change
• Gain: 142.5 acres
• Loss: 2,052.1 acres
• Net Loss: 1,909.6 acres(3 Square Miles)
Relative decrease between 2014-2018
was 3.0%
No assessment on impact to connectivity
SUSTAINABILITYDIVISIONExample of Green Infrastructure within Preliminary Plan Areas
Green Infrastructure(Unregulated)
Under Preliminary Plan Green Infrastructure(Regulated)
SUSTAINABILITYDIVISIONLocations were both stream, buffer,
and trees were lost in the Regulated
Areas of the Green Infrastructure
Area in 2005-Total Forest Cover
SUSTAINABILITYDIVISIONEXAMPLE OF LAND DISTURBANCE OVER 16 YEARS
2005 2007 2016
2017 2020
SUSTAINABILITYDIVISIONFOREST REGENERATION WAS REMOVED
2020
2016
SUSTAINABILITYDIVISION2005 Tree Canopy Before Rough Grading 2016 Tree Canopy Regeneration(Opportunity)
Plan Key
Trees planted
post development Zone R-L(1.0-1.5)
For Tree Canopy 25% Conservation
20% Tree Cover
Same Location over time
2020 Installed Tree Canopy
SUSTAINABILITYDIVISIONTREE CANOPY CHANGE DATA
Chesapeake Bay Program
• 1-meter resolution data produced by the Chesapeake Conservancy (CC)
and University of Vermont (UVM) for the years 2013/14 to 2017/18.
• Measures tree canopy change during the period 2014-2018.
• 2021/22 is forthcoming in the year 2023.
SUSTAINABILITYDIVISIONCOUNCIL OF GOVERNMENTS
EQUITY EMPHASIS AREAS Tree Canopy Change
2014-2018
Equity Rest of Gain
Emphasis Area County Loss
Total Gain (Acres) 42. 7 472.1 No change
Total Loss (Acres) 1,710.4 5,918.3 Equity
Emphasis
No Change (Acres) 20,019.9 137,866.3 Area
Net Loss (Acres) 1,667.7 5,446.8
Equity Rest of
Emphasis Area County
Percent Tree Canopy
in Year 2014* 38.8% 56.5%
Percent Tree Canopy
in Year 2018* 35.8% 54.4%
*As a percentage of land cover
SUSTAINABILITYDIVISIONCOUNCIL OF GOVERNMENTS
EQUITY EMPHASIS AREAS
Equity Emphasis Areas tend
to be highly developed with a
high proportion of impervious
surfaces.
Tree LOSS in an Equity
Emphasis AREA
SUSTAINABILITYDIVISIONSTRONGHOLD
WATERSHEDS-IDENTIFIED Stronghold
Watershed
BY STATE OF MARYLAND Protected land
Newly protected
AS IMPORTANT TO
land (since 2014)
Protected land in
stronghold watershed
PROTECT Newly protected land in
stronghold watershed
(since 2014)
Plan 2035
• Target land acquisition or ecological
restoration activities to stronghold
watersheds (NE 2.3).
SUSTAINABILITYDIVISIONWHERE HAS LAND ACQUISITION OCCURRED?
• Not much difference
between percent of
land protected with
Stronghold watersheds
vs. without overall.
• No indication that land
protection efforts have
been targeted to
stronghold watersheds
since Plan 2035 was
put in place in 2014.
SUSTAINABILITYDIVISIONQUESTIONS FOR DISCUSSION:
• How can land use policy support climate resiliency?
• Is it possible to accomplish our Carbon Sequestration goals without amending
our current land disturbance practices?
• Policy vs. Practice, what are the carbon footprint benefits of preservation of
existing tree canopy vs. new tree plantings?
• Why are existing forested properties targeted for development vs. infill
development?
• How does a no NET Loss tree Policy fit into this discussion?
• How do we balance incentivizing transit- oriented activity centers(denser
growth) with without compromising fragile urban tree canopy and forest?
SUSTAINABILITYDIVISIONenvironment.mypgc.us
CONTACT US
Prince George’s County Department of the Environment
1801 McCormick Drive, Suite 500
Largo, Maryland
(301) 883-5810
DEPARTMENT OF THE ENVIRONMENTAPPENDIX-DATA SOURCE EXPLANATION The CBP data was selected to evaluate tree canopy change because it was specifically designed for monitoring change. The University of Vermont and developed a land cover change classification directly from spectral change over two dates in addition to developing a 2017/18 land cover dataset to monitor change, versus evaluating change using two independently- produced datasets. In addition, while the threshold for the M-NCPPC appears to have been set to 40 square feet, which equates to roughly 3.7 square meters, the CBP data was set to measure change down to 1 square meter (~10.8 square feet), allowing for smaller trees to be picked up by the analysis. Prince George’s County Department of the Environment Draft Methodology for Countywide Canopy Change July 22, 2021 Description: This indicator utilizes the Chesapeake Conservancy’s Change in Tree Canopy 2014-2018 and its 2018 Land Cover dataset to determine the total acreage of tree that was canopy gained or lost, or where no change was observed for the specified time period. The Change in Tree Canopy 2014-2018 data includes four change scenarios: • Gain (areas where tree canopy was gained from 2014-2018) • Loss (areas where tree canopy was lost from 2014-2018) • Tree Canopy (areas where there was no change in tree canopy from 2014-2019) • No Tree Canopy (areas where no tree canopy existed at either time period). The “water” category from the Chesapeake Conservancy’s 2018 Land Cover data was utilized to exclude water from CBP tree canopy change layer to account for inability for trees to be grow in water. Both of the Chesapeake Conservancy’s datasets were converted from raster to polygon features to simplify the analysis. Area calculations were prepared for change scenarios using the following geographic breakdowns: Countywide; North/Central/South; Environmental Strategy Areas; and MWCOG’s Equity Emphasis Areas (2012-2016). About the Chesapeake Conservancy Data: Under a 6-year Cooperative Agreement with the Chesapeake Bay Program, the Chesapeake Conservancy (CC) and University of Vermont (UVM) are producing 1- meter resolution land cover datasets for the years 2013/14, 2017/18, 2021/22 using the best available Light Detection and Ranging (LiDAR) and National Agriculture Imagery Program (NAIP) aerial imagery for the Chesapeake Bay watershed (including Prince George’s County). Information for 2013/14 is complete. Information for 2017/18 is still considered draft. The data is currently in it's Version1 form. A Version 2 of this dataset will be available in December 2021 SUSTAINABILITYDIVISION
You can also read