DEPARTMENT of HEALTH and HUMAN - Agency for Toxic Substances and Disease Registry - CDC
←
→
Page content transcription
If your browser does not render page correctly, please read the page content below
DEPARTMENT
         of HEALTH
        and HUMAN
          SERVICES
              Fiscal Year
                     2022

Agency for Toxic Substances and
               Disease Registry
                  Justification of
                    Estimates for
        Appropriation Committees

ATSDR FY 2022 Congressional Justification

                                                                   TABLE OF CONTENTS
   MESSAGE FROM THE ADMINISTRATOR .............................................................................................................................................. 4
   INTRODUCTION AND MISSION ......................................................................................................................................................... 5
   ATSDR ORGANIZATIONAL CHART ................................................................................................................................................... 6
   AGENCY FOR TOXIC SUBSTANCES AND DISEASE REGISTRY ..................................................................................................................... 8
   AGENCY FOR TOXIC SUBSTANCES AND DISEASE REGISTRY PERFORMANCE .............................................................................................. 21
BUDGET EXHIBITS .......................................................................................................................................................... 24
   APPROPRIATIONS LANGUAGE ........................................................................................................................................................ 26
   AMOUNTS AVAILABLE FOR OBLIGATION .......................................................................................................................................... 27
   SUMMARY OF CHANGES .............................................................................................................................................................. 28
   AUTHORIZING LEGISLATION .......................................................................................................................................................... 29
   APPROPRIATIONS HISTORY ........................................................................................................................................................... 30
SUPPLEMENTAL TABLES ................................................................................................................................................. 32
   OBJECT CLASS TABLE – DIRECT ..................................................................................................................................................... 34
   SALARIES AND EXPENSES .............................................................................................................................................................. 35
   DETAIL OF FULL-TIME EQUIVALENT EMPLOYMENT (FTE) ................................................................................................................... 36
   ATSDR FULL TIME EQUIVALENTS FUNDED BY THE AFFORDABLE CARE ACT ............................................................................................ 37
   DETAIL OF POSITIONS .................................................................................................................................................................. 38

                                                                                            3
ATSDR FY 2022 Congressional Justification
MESSAGE FROM THE ADMINISTRATOR
4ATSDR FY 2022 Congressional Justification
INTRODUCTION AND MISSION
About
The Agency for Toxic Substances and Disease Registry (ATSDR) is a non-regulatory, environmental public health
agency of the U.S. Department of Health and Human Services.
Congress established ATSDR under the Comprehensive Environmental Response, Compensation, and Liability
Act of 1980—more commonly known as CERCLA or the Superfund law. The Superfund program is responsible for
finding and cleaning up the most dangerous hazardous waste sites in the country. ATSDR is the lead federal
public health agency for determining, preventing, and mitigating the human health effects of toxic exposures.
In 1984, amendments to the Resource Conservation and Recovery Act authorized ATSDR to conduct public
health assessments at the request of the Environmental Protection Agency (EPA), states, or individuals. Congress
also authorized ATSDR to assist the EPA in determining which substances may pose a threat to human health.
Passage of the Superfund Amendments and Reauthorization Act of 1986 authorized ATSDR to maintain
toxicological databases, disseminated information, and provide medical education.
ATSDR maintains a joint director’s office with the National Center for Environmental Health at the Centers for
Disease Control and Prevention. In addition to its Atlanta, Georgia headquarters, ATSDR has staff in each of the
10 EPA regional offices and at EPA headquarters in Washington, D.C. ATSDR experts provide a 24/7 response to
toxic chemical exposure, hazardous leaks and spills, environmentally related poisonings, natural disasters, and
terrorist acts.
Mission
ATSDR protects people’s health from environmental hazards that can be present in the air we breathe, the
water we drink, and the world that sustains us. We do this by investigating the relationship between
environmental factors and health, developing guidance, and building partnerships to support healthy decision
making.
Goals
Implement environmental health programs and interventions to protect and promote health.
Prepare for and respond to health hazards and toxic exposures, including those caused by public health
emergencies such as chemical, biological, radiological, and nuclear incidents; natural disasters; and extreme
weather events.
Build additional national, state, local, and tribal capacity to anticipate, assess, and respond to environmental
exposures.
5ATSDR FY 2022 Congressional Justification
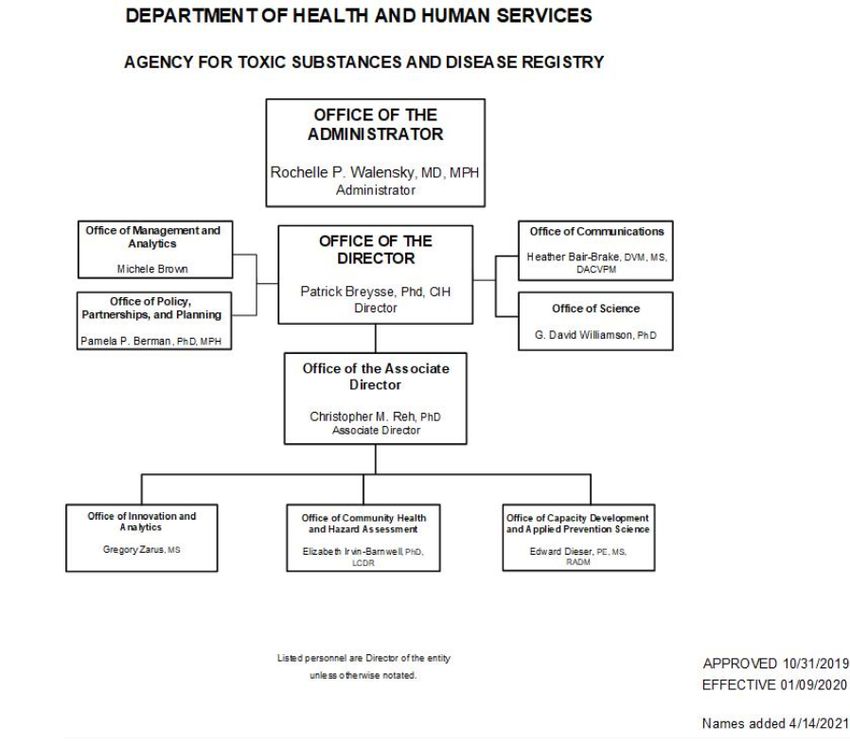
ATSDR ORGANIZATIONAL CHART
6(page intentionally left blank)
ATSDR FY 2022 Congressional Justification

               AGENCY FOR TOXIC SUBSTANCES AND DISEASE REGISTRY
                                                                                             FY 2022    FY 2022
                                                         FY 2020               FY 2021    President's        +/-
 (dollars in millions)                                      Final              Enacted        Budget    FY 2021
                            Budget Authority              $76.691               $78.000       $81.750    +$3.750
                                       FTEs                   221                   228           228          0

Enabling Legislation Citation: Sections 104(i) and 111(c)(4) of the Comprehensive Environmental Response,
Compensation and Liability Act of 1980, as amended by the Superfund Amendments and Reauthorization Act of
1986 (42 U.S.C. § 9604(i) and § 9611)*; The Defense Environmental Restoration Program (10 U.S.C. § 2704);
Section 3019 of the Solid Waste Disposal Act (42 U.S.C. § 6939a); Section 2009 of the Social Security Act (42
U.S.C. § 1397h); P.L. 114-148; P.L. 115-141

Enabling Legislation Status: Permanent

Authorization of Appropriations for FY 2021: Indefinite; Expired/Expiring noted with *

Allocation Methods: Direct Federal/Intramural, Contracts, Competitive Grants/Cooperative Agreements

For three decades, the Agency for Toxic Substances and Disease Registry (ATSDR) has protected American
communities from exposures to harmful substances in our soil, water, and air. ATSDR works to better
understand the human health effects of hazardous substances and supports local efforts to investigate and take
action to reduce harmful exposures in our communities. ATSDR is the only federal health agency that works
directly with concerned citizens to address environmental hazards and responds to requests for assistance from
communities across the nation. In addition to protecting human health, ATSDR’s efforts mitigate the economic
burdens commonly associated with environmental contamination, including the cost of treatment, lost
productivity, and decreased lifetime earnings for those affected, and even reduced property value and business
liability.

ATSDR is based in Atlanta and has staff located in regional offices across the country, ready 24/7 to respond to
environmental threats from natural disasters, chemical spills, and other emergencies. ATSDR staff represent a
variety of disciplines and have extensive experience in addressing some of the most significant and difficult
environmental health hazards in the United States, including dioxins/furans, per- and polyfluoroalkyl substances,
radiation, lead, trichloroethylene, and ethylene oxide.

ATSDR’s core focus areas include:

Public Health Assessments: Assess current and emerging environmental health threats and provide actionable
recommendations to protect health at hazardous waste sites and in response to environmental public health
emergencies.

Health Studies: Health Studies include those that examine the relationship between exposure to substances
such as per- and polyfluoroalkyl substances (PFAS) in communities and health outcomes.

Children’s Environmental Health: Help states promote and implement initiatives to protect children in childcare
and early learning facilities from environmental hazards and provide specialized environmental exposure
medical knowledge to pediatric healthcare professionals through the Pediatric Environmental Health Specialty
Units.

Land Reuse and Redevelopment: Expand the capacity of state, local, and tribal partners to assess and safely
redevelop brownfields and land reuse sites. The utility and economic value of a site is improved, and community
health is protected by ensuring redevelopment occurs in a healthy manner.

                                                            8
ATSDR FY 2022 Congressional Justification
Protection of Tribal Nations: Help tribal governments identify and address environmental contaminants and
investigate exposures on American Indian/Alaskan Native lands.
State-of-the-Art Science: Strengthen the application of toxicological science to inform public health actions,
address emerging contaminants, and conduct health studies and surveillance to understand health effects of
environmental exposures.
9ATSDR FY 2022 Congressional Justification
AGENCY FOR TOXIC SUBSTANCES AND DISEASE REGISTRY
BY THE NUMBERS
• 1,700—Children protected by ATSDR actions from harmful exposures to lead.
• 715—Community, state, and Federal requests responded to by ATSDR in FY 2019, addressing the
potential health risk of over 2 million people around the country.
• 28—State health departments funded through ATSDR's APPLETREE cooperative agreement program.
Sixteen recipient states received an additional $1.4 million in COVID-19 supplemental funding through
APPLETREE to provide guidance and community engagement on safe practices for disinfection for
home, school, and early learning education centers.
• 110 Million—Views of the COVID-19 Data Tracker Dashboard since its launch in April 2020. ATSDR’s
Geospatial Research, Analysis, and Services Program (GRASP) developed the tracker that provides
information on COVID-19 cases, deaths, testing, seroprevalence, emergency department visits,
societal impact, and other metrics. ATSDR also used GRASP’s Social Vulnerability Index (SVI), a tool to
identify socially vulnerable populations, to create a Pandemic Vulnerability Index (PVI) to map
populations that are more vulnerable to the spread of COVID-19.
• 10—Number of Pediatric Environmental Health Specialty Units (PEHSUs) that advise parents and
pediatric health providers on protecting and caring for children potentially exposed to harmful
chemicals. PEHSUs and other partners engaged early in the COVID-19 response to deliver timely
education and disseminated infographics and guidance on safely disinfecting the home during the
pandemic.
• 31,647—Health professionals educated by ATSDR in FY 2019 on ways to diagnose and treat conditions
related to hazardous exposures.
• Over 40—Communities across the nation where ATSDR is currently working to examine the impact of
exposure to PFAS, which are a large group of man-made chemicals.
o 10—Exposure assessments conducted in communities near current or former military bases
across the U.S. that are known to have had PFAS in their drinking water.
o 8—States with sites for ATSDR's Multi-Site Health Study, a national study that will look at the
relationship between PFAS exposure and health effects.
• 17—Toxicological profiles published by ATSDR in FY 2020 for substances that are hazardous to human
health. ATSDR maintains 184 toxicological profiles containing scientific data and public health
information and has developed 459 minimum risk levels (MRLs), which are health guidance values
used to make health decisions.
• 16,583—Number of participants in the National Amyotrophic Lateral Sclerosis (ALS) Registry
diagnosed with the disease. As of FY 2020, CDC/ATSDR has connected over 1,000 patients with more
than 50 clinical trials and epidemiological studies, collected specimens from more than 1,400 patients
nationally for the biorepository, and funded 19 research grants.
*Unless otherwise noted, all information and calculations are from ATSDR program data.
10ATSDR FY 2022 Congressional Justification
Agency For Toxic Substances
and Disease Registry Funding History1
Dollars
Fiscal Year
(in millions)
2018 $74.691
2019 $74.691
2020 $76.691
2021 $78.000
2022 President's Budget $81.750
1
P.L. 111-148 appropriated $23,000,000 for the period of FY 2010-2014,
and $20,000,000 for each five-year period thereafter, in no-year funding
for the early detection of certain medical conditions related to
environmental health hazards.
Budget Request
ATSDR’s FY 2022 request of $81,750,000 is $3,750,000 above the FY 2021 Enacted. New resources in FY 2022
will enable continued and expanded geospatial public health analyses, including COVID-19 variant, cluster, and
outbreak analysis. In the last 10 years, ATSDR's mission has become increasingly complex with communities
around the United States concerned about possible exposure to hazardous substances including PFAS, ethylene
oxide and lead. ATSDR is mandated by law to respond to health concerns at all sites that are on or proposed for
the National Priorities List (NPL). Currently, the NPL includes over 1,300 sites, and last year, EPA placed 15 new
sites on the list, with 53 more proposed to be added.
Since FY 2020, ATSDR has increased the number of states funded through the ATSDR Partnership to Promote
Local Efforts to Reduce Environmental Exposure (APPLETREE) cooperative agreement to 28. ATSDR was also able
to increase support to the 10 Pediatric Environmental Health Specialty Units (PEHSUs) that advise parents and
pediatric health providers on protecting and caring for children potentially exposed to harmful chemicals.
Public Health Assessments
ATSDR protects people who are at risk of harmful exposures which cause cancer, developmental disabilities,
neurologic and cardiovascular complications, and other severe health problems. More specifically, ATSDR
reviews environmental and health data and provides guidance, health education, and technical expertise to
people living near hazardous waste sites, including elderly adults, children, and American Indians and Alaska
Natives.
In FY 2019, ATSDR conducted more than 100 assessments in communities across the country to evaluate the
health risks of over 2 million people potentially exposed to harmful substances. ATSDR responded to more than
700 community, state, and federal requests to address potential health risks. In addition, ATSDR is currently
working in 40 communities across the nation to examine the impact of exposure to PFAS, which are a large
group of man-made chemicals.
In FY 2022, ATSDR will continue to support public health assessments, evaluating health risks as requested by
communities, state, and federal partners.
The information that ATSDR provides to communities helps people take protective action to prevent harmful
exposures. When working at contaminated sites, ATSDR conducts a variety of community relations activities:
• Speaks face-to-face with concerned community members;
11ATSDR FY 2022 Congressional Justification
• Assesses human health risks posed by potential exposures;
• Provides public health evaluation results and recommended actions to protect health;
• Develops site-specific and chemical-specific information to provide to community members; and
• Follows up on recommendations to determine whether they are implemented by partners and
effectively protecting health.
In rare circumstances where information needed to conduct Public Health Assessments—such as direct
exposure measurements—is unavailable, ATSDR may address a contamination issue by conducting a Health
Study.
Health Studies
When necessary, ATSDR will gather biological samples (e.g., urine, blood) and environmental media (e.g.,
drinking water, dust, air) to better characterize the relationship between how people come into contact with
hazardous substances and possible exposure-related health effects in a community.
For example, ATSDR and its state health partners are investigating exposure to and possible health effects
associated with PFAS in multiple communities across the United States. Per- and polyfluoroalkyl substances
(PFAS) are a class of thousands of man-made chemicals that have been used in industry and consumer products
worldwide since the 1950s. Exposure to these chemicals is widespread, with the CDC’s National Health and
Nutrition Examination Survey (NHANES) detecting PFAS in the blood of more than 95% of the U.S. population.
More research is needed to determine the health effects in humans, but some studies suggest exposure may
affect cholesterol levels, affect the immune system, and increase the risk for some cancers. ATSDR has worked
to address community concerns about PFAS since 2009, with the development of the first health assessment
that looked at PFAS exposure in Decatur, Alabama. In addition to ATSDR’s site work, the National Defense
Authorization Act (NDAA) of 2018 directed ATSDR to complete exposure assessments and a health study to look
at PFAS exposure in communities. Currently, ATSDR is investigating exposure to and possible health effects
associated with PFAS in more than 40 communities across the United States. Most of these communities have
concerns about PFAS in their drinking water connected with PFAS production facilities or fire training areas
where aqueous film forming foam (AFFF) was regularly used.
In FY 2020, through an interagency agreement with Department of Defense, ATSDR conducted exposure
assessments in ten communities near current or former military bases across the U.S. that are known to have
had PFAS in their drinking water. An exposure assessment provides information to communities about the levels
of PFAS in their bodies. This information can be used to help reduce exposures. ATSDR has completed sample
collection at all sites and reported results in seven communities, with results for the remaining communities
expected to be released in FY 2021. The exposure assessments looked at exposure in more than 2,300
individuals from over 1,400 households. Over 770 people attended in-person or virtual community meetings
about the assessments and more than 158,000 people have been reached on social media. In FY 2022, ATSDR
will continue to develop summaries of individual site reports and an overall PFAS exposure assessment report
covering all sites. ATSDR will also continue to conduct Q&A sessions with community members and complete
health care provider information. ATSDR will utilize the information and lessons learned from the exposure
assessments to inform ATSDR's overall work in PFAS.
In addition, through support from the Department of Defense, ATSDR is conducting a national health study that
will look at the relationship between PFAS exposures through drinking water and health outcomes. The Pease
Study in New Hampshire will serve as the first site in the multi-site health study. Recruitment and sample
collection for the Pease Study reopened on October 15 after a pause to ensure safety of participants and staff
from COVID-19. In September 2019, ATSDR awarded research cooperative agreements to seven recipients for
the Multi-Site Study. This groundbreaking health study will provide information about the health effects of PFAS
exposure that can be used in all communities to protect health.
12ATSDR FY 2022 Congressional Justification
Since there is evidence to suggest that exposure to PFAS may impact the immune system, ATSDR is collaborating
with CDC to evaluate COVID-19 in healthcare providers and first responders. Study participants will provide
blood samples for serum PFAS concentration testing and participants will be monitored for both symptomatic
and asymptomatic infection. In cases where individuals contract COVID-19, their symptom severity,
hospitalization status, and antibody titers will be tracked at entry, midpoint, and study’s end. This analysis will
provide critical insight into the relationship between a widespread environmental exposure and infectious
disease.
Children’s Environmental Health
During community consultations, ATSDR observed that early childcare and education centers are often located
on or adjacent to hazardous sites, exposing children to environmental contaminants. Children’s exposure to
environmental hazards such as lead, arsenic, asbestos, mercury, and radon can slow childhood growth and
development and affect lifelong health. An estimated 8.3 million children nationwide are in programs that
warrant additional evaluation to ensure safe placement. To address this significant concern, ATSDR created the
Choose Safe Places for Early Care and Education (CSPECE) program, which protects the health of children by
reducing their risk of being exposed to dangerous chemicals during their time in childcare facilities. ATSDR will
continue to fund 25 state health departments to implement CSPECE through its state cooperative agreement
program in FY 2022. These states will continue screening potential childcare locations, educating childcare
providers, and integrating protective steps into existing processes to ensure children learn and grow in healthy,
safe places.
The 25 state partners have already achieved the following to help protect children where they live and play:
• Formed 150 local partnerships with licensing, environmental, zoning, childcare, health, non-profit,
academic, economic, and business partners for successful program design.
• Developed over 60 tools and resources to promote sustainability.
• Reached 79,000 childcare stakeholders through educational materials and 1,100 through direct training.
• Screened 2,300 childcare locations for potential hazards to directly protect children and staff.
• Screened childcare locations to identify issues that lead to process changes in the state.
o For example, in FY 2018, a state funded by this program screened childcare locations that use
private wells and found that many had not been testing their wells for contaminants and
bacteria. The state tested 14 private wells at childcare facilities and worked with them to ensure
the water was safe to drink, protecting 231 children. Going forward, the state plans to ensure
childcare facilities meet annual well testing requirements.
• Executed or pending execution for 17 state-specific systems changes to improve processes for
integration of environmental contamination considerations in the state or locality ECE system to protect
children.
As a part of the CSPECE program, the Site Assessment Section of the California Department of Public Health
(CDPH) collaborated with the California Department of Social Services (CDSS) and the CDPH Indoor Radon
Program to educate and leverage resources for early care and education (ECE) providers. Through this
collaboration, CDSS sent over 10,000 ECE provider notices in English and Spanish that recommended that they
test their facility for radon gas and provided information on obtaining free radon test kits. Mass distribution of
10,000 notices is expected to increase awareness, increase access to and action on testing for radon, and
protect staff and children from radon exposure.
ATSDR has awarded COVID-19 supplemental funding to the National Environmental Health Association (NEHA)
and the Children’s Environmental Health Network (CEHN) to support safe and appropriate disinfection practices
13ATSDR FY 2022 Congressional Justification
in ECE facilities during the COVID-19 pandemic. ATSDR uses its relationships with NEHA and CEHN, built through
normal CSPECE programmatic work, to ensure that environmental health staff, ECE facility owners, and other
interested parties are empowered with information to protect young children from both COVID-19 infection and
potentially hazardous cleaning product exposures.
ATSDR manages a national network of Pediatric Environmental Health Specialty Units (PEHSUs), located in each
federal region across the United States, to advise parents and reproductive and pediatric healthcare providers
on protecting and caring for children potentially exposed to harmful chemicals. Regional PEHSU units are
available to respond to requests for information, offer advice on environmentally related health effects for
pregnant women and children, and provide education to healthcare providers, other health professionals, and
community members. PEHSUs play a vital role because most healthcare professionals do not receive proper
training to recognize, manage, treat, and prevent environmentally related conditions in children and pregnant
women. Childhood, from early development through puberty, is a highly vulnerable period for exposure to
environmental toxicants such as lead, mold, pesticides, air pollution, and many other contaminants.
The PEHSU network has produced the Pediatric Environmental Health Toolkit, a web-based reference that
provides everyday environmental interactions for children and steps clinicians and parents can take to decrease
harmful exposure. Additionally, with a focus on childhood cancer and asthma, PEHSU partners continue to add
new stories to evolve A Story of Health—a multimedia eBook that explores how our environments interact with
our genes to influence health across the lifespan. Each story features the latest scientific research about disease
origin and helpful facts about disease prevention.
Uniquely positioned around the U.S. and nationally known as an expert resource in children and women’s
environmental health, ATSDR’s PEHSU and other partners engaged early in the COVID-19 response to deliver
timely education and disseminate guidance on safely disinfecting the home during the pandemic and other
guidance on chemicals of public health concern. Supplemental COVID-19 funds are helping make this guidance
more widely available to communities and the public and will also be adapted to reach other environments with
similar needs such as schools and large gatherings. ATSDR and our PEHSU partner, the American College of
Medical Toxicology, are providing guidance on school re-openings during COVID-19.
Geospatial Research, Analysis, and Services Program (GRASP) and COVID-19
ATSDR’s GRASP engages in geospatial science and GIS research, analysis, support, training, and technology
projects with CDC/ATSDR and among the wider public health community to better understand issues specific to
health concerns. GRASP has worked on over 70 projects responding to the COVID pandemic, many of which are
still active.
To address data needs for the COVID-19 response, GRASP developed a COVID Data Tracker (CDT) Dashboard
using technology and data from multiple organizations to increase the understanding of the novel coronavirus,
target behaviors and populations that have increased risk, explore the impact and recovery of the existing
healthcare system, and to provide timely information to the public. In one week of the response, the Dashboard
received nearly 8 million views, and the CDT has recorded an estimated 110 million views overall since it was
launched in April 2020.
GRASP has also built upon existing programs to respond to COVID-19. In 2007, GRASP partnered with emergency
response planners at ATSDR and CDC's National Center for Environmental Health (NCEH) to develop the Social
Vulnerability Index (SVI), a resource to increase the public health community’s ability to use data, tools, and
communication to identify socially vulnerable populations at-risk of infectious disease related health outcomes,
better prepare for emergencies, and for use in its hazardous waste site work. SVI uses U.S. Census tract data to
characterize the social vulnerability of every U.S. community and ranks each community on 15 social factors,
including poverty, lack of vehicle access, and crowded housing. From FY 2019 to FY 2020, there was a 262%
increase in SVI page views. In 2020, the SVI has been used to create a Pandemic Vulnerability Index (PVI) to map
14ATSDR FY 2022 Congressional Justification
populations that are more vulnerable to the spread of COVID-19. The PVI is linked to the CDT Dashboard. GRASP
continues to use new data and technology to improve the utility of the information for public health decision
making. ATSDR’s COVID Data Tracker Dashboard, 1 PVI tool, 2 and SVI tool 3 are readily available to officials to help
make timely public health decisions.
Increased investment in geospatial analyses will improve CDC/ATSDR’s ability to respond to public health events
timely and effectively and explore environmental factors that may influence the progression of infectious
disease and other health outcomes. With additional funding in FY 2022, ATSDR’s GRASP would increase its
overall GIS and geospatial analysis activities—improving technology, enhancing science in environmental
modeling, and providing support to states. Some of these activities include:
• Improving technology with the goal of creating an Environmental Health Atlas, a reporting and
visualization online platform to enable partners and the public from the community to the global level to
examine the relationship between health and the environment.
• Developing a comprehensive environmental sampling data system to manage, store, and share data to
improve data quality, ensure consistency in data used for analysis, and ensure scientists use the same
common data.
• Expanding GRASP’s capacity in air dispersion modeling and groundwater modeling to enhance ATSDR’s
construction of complex exposure pathways in communities.
• Developing an Activity Space Index integrating mobile phone data, synthetic population data, and
remote sensing images to enable ATSDR scientists to better understand exposure that occurs where
people work, learn, play, and worship.
• Expanding the SVI to include an SVI Toolkit designed to promote its use among partners and be
potentially implemented at educational institutions.
• Building GIS capacity within state and local health departments for the development of GIS science,
analysis, technology and visualization of public health research and practice. This would inform decision
making and allow enhance health departments’ response to environmental and public health
emergencies.
Land Reuse and Development
Brownfields and land reuse sites are areas that may be contaminated with chemicals from past or current uses.
When these properties are redeveloped with community health in mind, they can become community assets,
capable of generating new revenues and preventing significant medical costs related to acute and chronic
contaminant exposure.
ATSDR provides scientific and programmatic expertise for incorporating health considerations into land
redevelopment and reuse decisions. The agency has developed an action model and a site tool that can be used
to analyze sampling data in order to identify when levels may be unsafe. In FY 2022, ATSDR will continue to
provide expertise and assistance to communities and local agencies directly. For example, when residents of
Baraboo, Wisconsin were interested in redeveloping an old industrial area along the Baraboo River, ATSDR
worked with the Wisconsin Department of Health Services to evaluate environmental hazards to health. ATSDR
recommended actions to protect people from exposure to environmental contaminants, such as covering sites
with vegetation to prevent exposure to polychlorinated biphenyls (PCBs). Outcomes included the clean-up of
environmental hazards, the conversion of vacant buildings, and a $3,000,000 increase to the city’s tax base.
1
https://covid.cdc.gov/covid-data-tracker
2
https://covid.cdc.gov/covid-data-tracker/#pandemic-vulnerability-index
3
https://svi.cdc.gov/data-and-tools-download.html)
15ATSDR FY 2022 Congressional Justification
Tribal Environmental Health
ATSDR collaborates with its tribal partners to identify and evaluate environmental health concerns and
empower tribes to make informed decisions that benefit their people and their communities. For example,
members of the Yakutat Tlingit Tribe, fearing health effects from dioxin exposure, stopped harvesting clam and
crab for food in the Ankau Saltchuk and closed their native culture camp for 14 years. Alaska’s Environmental
Public Health Program partnered with ATSDR to assess cancer and non-cancer risks from eating dioxin-
contaminated seafood, conduct risk communication and health education in the community, and conduct a
survey to evaluate the initiative’s effectiveness. The initiative proved successful when a year later, the majority
of the community resumed harvesting seafood.
As part of the Choose Safe Places for Early Care and Education Program (CSPECE), the Wisconsin Department of
Health Services (DHS) contracted with local and tribal health departments to supplement their statewide CSPECE
program with education adapted to localities to best serve early care and education (ECE) stakeholders with
services that fit their needs. Local and tribal health departments worked in their areas with providers to
educate, conduct one-on-one environmental assessments, and provide resources to assess and protect children,
such as environmentally friendly cleaning supplies, radon test kits, and carbon monoxide detectors. Over 200
families and providers were provided education and resources to protect children from common environmental
health concerns.
State-of-the-Art Science
The Comprehensive Environmental Response, Compensation, and Liability Act (CERCLA) requires ATSDR to
maintain toxicological databases, disseminate scientific information, and conduct medical education. ATSDR
currently maintains scientific data health information on 184 profiles and has developed 459 Minimal Risk Levels
(MRLs), which are health guidance values used to make public health decisions. Healthcare and environmental
professionals around the world use ATSDR’s suite of toxicological materials—ToxProfiles™, ToxFAQs™, and
ToxGuides™—to make decisions about cleaning up sites, responding to emergencies, and reducing the toxic
effect for people exposed to hazardous substances. In FY 2020, ATSDR finalized and published 17 ToxProfiles™.
In addition, ATSDR scientists are working to identify private wells that may be contaminated with per- and
polyfluoroalkyl substances (PFAS).
Funding State Cooperative Agreements
ATSDR’s state cooperative agreement program (APPLETREE) funds 28 states to detect, respond, and prevent
harmful exposures in communities, focusing on the core functions outlined above. In FY 2022, ATSDR will
continue to fund all 28 states. Funding health departments increases local knowledge and improves efficiency as
state-based public health officials are able to travel to sites and respond to local issues more quickly. ATSDR
provides technical assistance and support for state experts to investigate community health concerns and
implement state-level policies and practices to protect people from harmful exposures. For example, ATSDR
partnered with EPA and the Arkansas Department of Health (ADH) to successfully identify chemical hazards in
residential neighborhoods near the former Hope Iron and Metal site in Hope, Arkansas. Children living near the
site were at risk for exposure to hazardous chemicals such as antimony, cadmium, and lead. ADH provided
health education to residents on how to protect themselves from the chemical hazards and tested blood lead
levels of children living in the area. Ultimately, ATSDR/ADH recommendations led to the removal of the
contaminated soil to prevent further exposure of the residents.
16ATSDR FY 2022 Congressional Justification
ATSDR Partnership to Promote Local Efforts to Reduce Environmental Exposure (APPLETREE) Grants1
(dollars in millions)
FY 2020 FY 2021 FY 2022
Final Level Enacted Level President's Budget
Number of Awards 28 28 28
- New Awards 28 0 0
- Continuing 0 28 28
Awards
Average Award $0.421 $0.421 $0.421
Range of Awards $0.212-$0.856 $0.212-$0.856 $0.212-$0.856
Total Awards $11.800 $11.800 $11.800
1
These funds are not awarded by formula.
17ATSDR FY 2022 Congressional Justification
ATSDR State Funding FY 2020-2022
FY 2022 FY 2022
FY 2020 FY 2021 President’s +/-
Final Enacted Budget FY 2021
Alabama $0 $0 $0 $0
Alaska $423,449 $423,449 $423,449 $0
Arizona $0 $0 $0 $0
Arkansas $0 $0 $0 $0
California $512,206 $512,206 $512,206 $0
Colorado $352,306 $352,306 $352,306 $0
Connecticut $572,985 $572,985 $572,985 $0
Delaware $0 $0 $0 $0
District of Columbia $0 $0 $0 $0
Florida $546,301 $546,301 $546,301 $0
Georgia $252,622 $252,622 $252,622 $0
Hawaii $0 $0 $0 $0
Idaho $222,010 $222,010 $222,010 $0
Illinois $5,123,534 $5,123,534 $5,123,534 $0
Indiana $0 $0 $0 $0
Iowa $0 $0 $0 $0
Kansas $0 $0 $0 $0
Kentucky $0 $0 $0 $0
Louisiana $335,191 $335,191 $335,191 $0
Maine $0 $0 $0 $0
Maryland $0 $0 $0 $0
Massachusetts $800,753 $800,753 $800,753 $0
Michigan $508,631 $508,631 $508,631 $0
Minnesota $606,688 $606,688 $606,688 $0
Mississippi $0 $0 $0 $0
Missouri $448,808 $448,808 $448,808 $0
Montana $2,840,098 $2,840,098 $2,840,098 $0
Nebraska $0 $0 $0 $0
Nevada $0 $0 $0 $0
New Hampshire $389,452 $389,452 $389,452 $0
New Jersey $539,394 $539,394 $539,394 $0
New Mexico $339,937 $339,937 $339,937 $0
New York $556,029 $556,029 $556,029 $0
North Carolina $395,592 $395,592 $395,592 $0
North Dakota $0 $0 $0 $0
Ohio $501,277 $501,277 $501,277 $0
Oklahoma $0 $0 $0 $0
Oregon $550,967 $550,967 $550,967 $0
Pennsylvania $578,613 $578,613 $578,613 $0
Rhode Island $444,790 $444,790 $444,790 $0
South Carolina $0 $0 $0 $0
South Dakota $0 $0 $0 $0
Tennessee $511,441 $511,441 $511,441 $0
Texas $542,938 $542,938 $542,938 $0
Utah $251,816 $251,816 $251,816 $0
Vermont $0 $0 $0 $0
Virginia $0 $0 $0 $0
Washington $497,868 $497,868 $497,868 $0
West Virginia $0 $0 $0 $0
Wisconsin $578,356 $578,356 $578,356 $0
Wyoming $0 $0 $0 $0
18ATSDR FY 2022 Congressional Justification
FY 2022 FY 2022
FY 2020 FY 2021 President’s +/-
Final Enacted Budget FY 2021
Total Resources $20,376,620 $20,376,620 $20,376,620 $0
1
This table is a compilation of ATSDR grant programs ATSDR's Partnership to Promote Local Efforts To Reduce Environmental Exposure, TS20-2001,
93.240/93.136; Early Detection of Certain Medical Conditions Related to Environmental Health Hazards, TS19-1902, 93.534; and Pediatric Environmental
Health Specialty Units, TS19-1901, 93.161 and represents all funding within a jurisdiction (including funding to local, tribal, and other grantees). For a more
comprehensive view of grant and cooperative agreement funding to grantees by jurisdiction, visit
http://wwwn.cdc.gov/FundingProfiles/FundingProfilesRIA/.
19ATSDR FY 2022 Congressional Justification
(page intentionally left blank)
20ATSDR FY 2022 Congressional Justification
AGENCY FOR TOXIC SUBSTANCES AND DISEASE REGISTRY PERFORMANCE
Performance Measures for Long Term Objective: Protect Americans from harmful exposures by recommending and
taking responsive public health actions
Most Recent Result and FY 2021 FY 2022 FY 2022
Measure
Target Target Target +/-FY 2021
14.2.1 Number of
toxicological profiles
FY 2020: 17
for substances
Target: 9 9 9 Maintain
hazardous to human
(Target Exceeded)
health published
(Output)
14.B Number of
requests ATSDR and
cooperative agreement
partners have
FY 2020: 747
responded to from
Target:700 715 715 Maintain
environmental
(Target Exceeded)
agencies, health
agencies, policy makers
and community
members (Output)
14.C Number of public
health assessments
and health FY 2020: 61
consultations issued by Target: 115 119 119 Maintain
ATSDR and cooperative (Target Not Met)
agreement partners
(Output)
14.L Number of health
FY 2020: 21,138
professionals trained
Target: 36,000 36,000 36,000 Maintain
on environmental
(Target Not Met)
health topics (Output)
Performance Trends: ATSDR investigates exposures to harmful substances in communities and recommends
actions to protect people’s health. ATSDR effectively protects Americans from dangerous exposures by
recommending and taking responsive public health actions, and meeting or exceeding annual targets.
Each year, ATSDR receives more than 500 requests for public health assessments, consultations and technical
assistance from the Environmental Protection Agency, state and local governments, and the public. The number
of products and community services that ATSDR provides aligns with the varying number of requests for
assistance that ATSDR receives each year and the resources available. Between FY 2014 and FY 2020, ATSDR
responded on average to over 500 requests annually for public health assessments, consultations, and technical
assistance from stakeholders and community members nationwide, exceeding performance targets (Measure
14.B). The FY 2022 target will maintain with ATSDR responding to at least 715 requests from environmental
agencies, health agencies, policy makers, and community members per year.
ATSDR prioritizes its site work, focusing resources on producing quality assessments that address the highest
priority public health problems. Through FY 2016, ATSDR consistently exceeded performance targets for the
number of public health assessments and health consultations completed (Measure 14.C). Despite the travel
restrictions and other challenges due to the COVID-19 pandemic, ATSDR was able to conduct 61 public health
assessments and health consultations in communities across the U.S. in FY 2020. These activities assessed the
21ATSDR FY 2022 Congressional Justification
health risks of over 200,000 people potentially exposed to harmful substances. It is anticipated that ATSDR will
complete 119 health consultations and public health assessments in FY 2022, keeping steady with anticipated
resources and FY 2020 levels.
ATSDR provides important information to families, local community leaders, and health care providers on
potential health risks from environmental hazards and steps they can take to protect families and patients in
their communities. Although the COVID-19 pandemic presented logistical complications and challenges due to
increased burden on health professionals, in FY 2020 ATSDR and funded partners educated over 21,000 health
professionals on ways to diagnose and treat conditions related to hazardous exposures (Measure 14.L), and
directly provided health education about preventing harmful exposures and other environmental health topics
to nearly 60,000 community members ATSDR continues to focus on pediatric environmental health and
proposes targets based on that focus. FY 2022 targets remain level with FY 2020 to reflect similar resources as
previous years.
Through the toxicological profiles (ToxProfiles™), and accompanying educational materials, ATSDR provides key
scientific information for health and environmental professionals around the world to make decisions about
cleaning up hazardous waste sites, responding to emergencies, and treating people exposed to harmful
substances. ATSDR maintains 184 toxicological profiles containing scientific data and public health information
and has developed 459 minimum risk levels (MRLs), which are health guidance values used to make health
decisions. ATSDR has met or exceeded the target for toxicological profiles (Measure 14.2.1). The toxicological
profile development program anticipates similar resources and performance to previous years and has kept
targets level for FY 2022.
22ATSDR FY 2022 Congressional Justification
FY 2019 DISCONTINUED MEASURES TABLE
Measure ID 14.2.3: Protect Americans from harmful exposures by recommending and taking responsive public health
actions (Outcome)
FY Target Result
2020 Discontinued N/A
2019 N/A N/A
91 %
2018 80 %
(Target Exceeded)
85 %
2017 80 %
(Target Exceeded)
77 %
2016 Set Baseline
(Baseline)
ATSDR will retire this measure because of changes to the information management systems used to collect data
and because the measure has nearly reached its maximum performance.
23BUDGET EXHIBITS
(page intentionally left blank)
ATSDR FY 2022 Congressional Justification

                                   APPROPRIATIONS LANGUAGE
                             Agency for Toxic Substances and Disease Registry
                             Toxic substances and environmental public health

For necessary expenses for the Agency for Toxic Substances and Disease Registry (ATSDR) in carrying out
activities set forth in sections 104(i) and 111(c)(4) of the Comprehensive Environmental Response,
Compensation, and Liability Act of 1980 (CERCLA and section 3019 of the Solid Waste Disposal Act,
[$78,000,000] $81,750,000: Provided, That notwithstanding any other provision of law, in lieu of performing a
health assessment under section 104(i)(6) of CERCLA, the Administrator of ATSDR may conduct other
appropriate health studies, evaluations, or activities, including, without limitation, biomedical testing, clinical
evaluations, medical monitoring, and referral to accredited healthcare providers: Provided further, That in
performing any such health assessment or health study, evaluation, or activity, the Administrator of ATSDR shall
not be bound by the deadlines in section 104(i)(6)(A) of CERCLA: Provided further, That none of the funds
appropriated under this heading shall be available for ATSDR to issue in excess of 40 toxicological profiles
pursuant to section 104(i) of CERCLA during fiscal year 2022, and existing profiles may be updated as necessary

(Department of the Interior, Environment, and Related Agencies Appropriations Act, 2021.)

Analysis of Changes

No significant changes requested for FY 2022.

                                                             26
ATSDR FY 2022 Congressional Justification
AMOUNTS AVAILABLE FOR OBLIGATION
FY 2022
FY 2020 FY 2021 President's
Final Enacted Budget
Discretionary Appropriation:
Enacted $76,691,000 $78,000,000 $81,750,000
ATB Rescission N/A N/A N/A
Subtotal, adjusted Appropriation $76,691,000 $78,000,000 $81,750,000
Mandatory and Other Appropriations: $0 $0 $0
Subtotal, adjusted Mandatory Appropriation $76,691,000 $78,000,000 $81,750,000
Recovery of prior year Obligations $251,215 $0 $0
Unobligated balance start of year $22,771,996 $7,404,794 $6,915,850
Unobligated balance expiring $307,300 $0 $0
Unobligated balance end of year ($7,404,794) ($6,915,850) ($5,631,024)
Total Obligations $90,365,773 $77,179,944 $63,284,825
27ATSDR FY 2022 Congressional Justification
SUMMARY OF CHANGES
(dollars in thousands) Dollars FTEs
FY 2021 Enacted (Program Level) $78,000 228
FY 2022 President's Budget (Program Level) $81,750 228
Net Change $3,750 0
FY 2021 FTE FY 2021 FTE FY 2022
Enacted Change +/-
FY 2021
Increases:
$78,000 --- $3,750
Total Increases --- $78,000 --- $3,750
Decreases:
ATSDR --- $0 --- $0
Total Decreases $0 --- $0
Built-In:
1. Annualization of 2021 Pay Raise --- --- --- $0
2. FY 2022 Pay Increases $0
3. Changes in Day of Pay --- --- --- $0
4. Rental Payments to GSA and Others --- --- --- $0
Total Built-In --- $0 --- $0
Absorption of Current Services $0
Total --- --- --- $0
Total Increases (Program Level) --- $78,000 0 $3,750
Total Decreases (Program Level) --- $0 0 $0
NET CHANGE – Program Level 228 $78,000 0 $3,750
28ATSDR FY 2022 Congressional Justification
AUTHORIZING LEGISLATION
(dollars in thousands) Enabling FY 2022
Legislation Allocation FY 2020 FY 2021 President’s
Enabling Legislation Citation Status Methods Final Enacted Budget
ATSDR
Sections 104(i) and 111(c)(4)of the Permanent Direct Federal/ $76,691 $78,000 $81,750
Comprehensive Environmental Response, Indefinite Intramural,
Compensation and Liability Act of 1980 (42 Contracts,
U.S.C. 9604(i)* and 42 U.S.C. 9611*); The Competitive
Defense Environmental Restoration Program Grants/
(10 U.S.C. 2704); Section 3019 of the Solid Cooperative
Waste Disposal Act (42 U.S.C. 6939a); The Agreements
Clean Air Act, as amended (42 U.S.C. 7401 et
seq), Section 2009 of the Social Security Act
(42 U.S.C. § 1397h), P.L. 1114-148, P.L. 115-
141
Note: Expired/Expiring authorization of appropriations noted with *
29ATSDR FY 2022 Congressional Justification
APPROPRIATIONS HISTORY
Budget Estimate to House Senate
Fiscal Year Congress Allowance Allowance Appropriation
2010 76,792,000 76,792,000 76,792,000 76,792,000
2011 76,337,000 ----- 76,337,000 76,638,000
2012 76,337,000 74,039,000 76,638,000 76,215,000
2013 76,300,000 76,300,000 72,228,000
2014 76,300,000 -- -- 74,691,000
2015 74,691,000 -- -- 74,691,000
2015 20,000,000 -- -- 20,000,000
2016 74,691,000 -- -- 74,691,000
2017 74,691,000 74,691,000 74,691,000 74,691,000
2018 62,000,000 72,780,000 74,691,000 74,691,000
2019 62,000,000 74,691,000 74,691,000 74,691,000
2020 62,000,000 79,691,000 74,691,000 76,691,000
2021 62,000,000 79,000,000 76,691,000 78,000,000
2022 81,750,000 -- -- --
30(page intentionally left blank)
SUPPLEMENTAL TABLES
(page intentionally left blank)
ATSDR FY 2022 Congressional Justification

                                         OBJECT CLASS TABLE – DIRECT
                                                                                                         FY 2022    FY 2022
                                                                         FY 2020            FY 2021   President’s        +/-
(dollars in thousands)                                                      Final           Enacted       Budget    FY 2021
Personnel Compensation:
         Full-Time Permanent(11.1)                                        $19,610           $19,945      $21,407     $1,462
         Other than Full-Time Permanent (11.3)                             $1,177            $1,197       $1,248        $51
         Other Personnel Comp. (11.5)                                       $607              $618         $644         $26
         Military Personnel (11.7)                                         $3,335            $3,392       $3,551      $159
         Special Personal Service Comp. (11.8)                                 $0                $0           $0         $0
                      Total Personnel Compensation                        $24,730           $25,152      $26,850     $1,699
Civilian personnel Benefits (12.1)                                         $7,468            $7,596       $7,769      $173
Military Personnel Benefits (12.2)                                          $287              $292         $300          $8
Benefits to Former Personnel (13.0)                                            $0                $0           $0         $0
                                   Subtotal Pay Costs                     $32,485           $33,039      $34,918     $1,879
Travel (21.0)                                                               $409              $416         $420          $4
Transportation of Things (22.0)                                               $19               $20          $20         $0
Rental Payments to GSA (23.1)                                                  $0                $0           $0         $0
Rental Payments to Others (23.2)                                               $6                $6           $6         $0
Communications, Utilities, and Misc. Charges (23.3)                           $22               $23          $23         $0
NTWK Use Data TRANSM SVC (23.8)                                                $0                $0           $0         $0
Printing and Reproduction (24.0)                                               $4                $4           $4         $0
Other Contractual Services (25):                                          $22,870           $23,260      $24,497     $1,237
      Advisory and Assistance Services (25.1)                              $9,274            $9,432       $9,934       $502
      Other Services (25.2)                                                $1,968            $2,001       $2,108       $106
      Purchases from Government Accounts (25.3)                           $14,101           $11,352      $11,546    $12,160
      Operation and Maintenance of Facilities (25.4)                           $7                $7           $7         $0
      Research and Development Contracts (25.5)                                $0                $0           $0         $0
      Medical Services (25.6)                                                  $0                $0           $0         $0
      Operation and Maintenance of Equipment (25.7)                         $270              $275         $289         $15
      Subsistence and Support of Persons (25.8)                                $0                $0           $0         $0
      Consultants, other and misc. (25.9)                                      $0                $0           $0         $0
Supplies and Materials (26.0)                                               $164              $166         $168          $2
Equipment (31.0)                                                           $1,154            $1,174       $1,186        $12
Land and Structures (32.0)                                                     $0                $0           $0         $0
Investments and Loans (33.0)                                                   $0                $0           $0         $0
Grants, Subsidies, and Contributions (41.0)                               $19,559           $19,893      $20,508       $615
Insurance Claims and Indemnities (42.0)                                        $0                $0           $0         $0
Interest and Dividends (43.0)                                                  $0                $0           $0         $0
Refunds (44.0)                                                                 $0                $0           $0         $0
                                       Subtotal Non-Pay Costs             $44,206           $44,961      $46,832     $1,871
                                       Total Budget Authority             $76,691           $78,000      $81,750     $3,750
Average Cost per FTE
Civilian FTEs                                                                  193              198          198          0
Civilian Average Salary and Benefits                                          $150             $148         $157       $8.6
        Percent change                                                         N/A              -1%           6%         7%
Military FTEs                                                                   28               30           30          0
Military Average Salary and Benefits                                          $129             $123         $128         $6
       Percent change                                                          N/A              -5%           5%       9.6%
Total FTEs                                                                     221              228          228          0
        Average Salary and Benefits                                           $147             $145         $153         $8
        Percent change                                                         N/A              -1%           6%         7%

                                                                   34
ATSDR FY 2022 Congressional Justification
SALARIES AND EXPENSES
FY 2022 FY 2022
FY 2020 FY 2021 President’s +/-
(dollars in thousands) Final Enacted Budget FY 2021
Personnel Compensation:
Full-Time Permanent(11.1) $19,610 $19,945 $21,407 $1,462
Other than Full-Time Permanent (11.3) $1,177 $1,197 $1,248 $51
Other Personnel Comp. (11.5) $607 $618 $644 $26
Military Personnel (11.7) $3,335 $3,392 $3,551 $159
Special Personal Service Comp. (11.8) $0 $0 $0 $0
Total Personnel Compensation $24,730 $25,152 $26,850 $1,699
Civilian personnel Benefits (12.1) $7,468 $7,596 $7,769 $173
Military Personnel Benefits (12.2) $287 $292 $300 $8
Benefits to Former Personnel (13.0) $0 $0 $0 $0
Subtotal Pay Costs $32,485 $33,039 $34,918 $1,879
Travel (21.0) $409 $416 $420 $4
Transportation of Things (22.0) $19 $20 $20 $0
Rental Payments to Others (23.2) $6 $6 $6 $0
Communications, Utilities, and Misc. Charges (23.3) $22 $23 $23 $0
Printing and Reproduction (24.0) $4 $4 $4 $0
Other Contractual Services (25): $22,870 $23,260 $24,507 $1,247
Advisory and Assistance Services (25.1) $9,274 $9,432 $9,934 $502
Other Services (25.2) $1,968 $2,001 $2,108 $106
Purchases from Government Accounts (25.3) $11,352 $11,546 $12,160 $614
Operation and Maintenance of Facilities (25.4) $7 $7 $7 $0
Research and Development Contracts (25.5) $0 $0 $0 $0
Medical Services (25.6) $0 $0 $0 $0
Operation and Maintenance of Equipment (25.7) $270 $275 $289 $15
Subsistence and Support of Persons (25.8) $0 $0 $10 $10
Supplies and Materials (26.0) $164 $166 $168 $2
Subtotal Non-Pay Costs $23,493 $23,894 $25,148 $1,254
Rental Payments to GSA (23.1) $0 $0 $0 $0
Total, Salaries & Expenses and Rent $55,978 $56,933 $60,067 $3,133
Direct FTE 221 228 228 0
35ATSDR FY 2022 Congressional Justification
DETAIL OF FULL-TIME EQUIVALENT EMPLOYMENT (FTE)1
FY 2020 FY 2021 FY 2022
Civilian CC Total Civilian CC Total Civilian CC Total
Agency for Toxic Substances and Disease 193 28 221 198 30 228 198 30 228
Registry
Direct 193 28 221 198 30 228 198 30 228
Reimbursable - - - - - - - - -
1
ATSDR FTE only.
36ATSDR FY 2022 Congressional Justification
ATSDR FULL TIME EQUIVALENTS FUNDED BY THE AFFORDABLE CARE ACT
(dollars in millions)
ACA 2012 2012 2013 2013 2014 2014 2015 2015 2016 2016 2017 2017 2018 2018 2019 2019 2020 2020 2021 2021 2022 2022
Sec. Total FTEs Total FTEs Total FTEs Total FTEs Total FTEs Total FTEs Total FTEs Total FTEs Total FTEs Total FTEs Total FTEs
ACA Program 1, 2
Medical Monitoring in Libby,
10323 $0.0 2.0 $0.0 2.5 $4.0 1.1 $4.0 0.9 $4.0 0.9 $4.0 0.9 $4.0 0.9 $4.0 0.9 $4.0 0.9 $4.0 0.9 $4.0 0.9
MT
Total $0.0 2.0 $0.0 2.5 $4.0 1.1 $4.0 0.9 $4.0 0.9 $4.0 0.9 $4.0 0.9 $4.0 0.9 $4.0 0.9 $4.0 0.9 $4.0 0.9
1
Excludes employees or contractors who: Are supported through appropriations enacted in laws other than PPACA and work on programs that existed prior to the passage of PPACA; Spend less than 50% of their time on
activities funded by or newly authorized in ACA; or who work on contracts for which FTE reporting is not a requirement of their contract, such as fixed price contracts.
2
CDC tracks total contract costs for ACA activities in the Affordable Care Act Object Class Table but does not track individual contract staff.
37ATSDR 2022 Congressional Justification
DETAIL OF POSITIONS1,2,3
FY 2022
FY 2020 FY 2021 President's
Final Enacted Budget
Executive Level
Executive level I - -
Executive level II - -
Executive level III - -
Executive level IV - -
Executive level V - -
Subtotal - -
Total-Executive Level Salary - -
Total - SES 1 0 0
Total - SES Salary $20,815 $0 $0
General Schedule
GS-15 25 19 16
GS-14 78 75 66
GS-13 93 74 67
GS-12 32 21 19
GS-11 5 6 6
GS-10 2 2 2
GS-9 14 9 8
GS-8 0 0 0
GS-7 2 1 1
GS-6 0 0 0
GS-5 0 0 0
GS-4 0 0 0
GS-3 0 0 0
GS-2 0 0 0
GS-1 0 0 0
Subtotal 251 207 185
Total - GS Salary $23,122,220 $23,409,963 $23,213,301
Average ES level
Average ES salary
Average GS grade 13.0 13.0 13.0
Average GS salary $92,120 $113,092 $125,477
Average Special Pay Categories
Average Comm. Corps Salary2 $108,297 $145,641 $149,357
Average Wage Grade Salary3
1
Includes special pays and allowances.
2
This table reflects "positions" not full-time equivalent(s) (FTEs).
3
There are no Wage Grade employees in ATSDR.
38You can also read