HEALTH FOR A LIFETIME - OBESITY PREVENTION PLAN State of Oklahoma - Oklahoma.gov
←
→
Page content transcription
If your browser does not render page correctly, please read the page content below
HEALTH FOR A LIFETIME

                     State of Oklahoma
  State Department   OBESITY PREVENTION PLAN
  of Health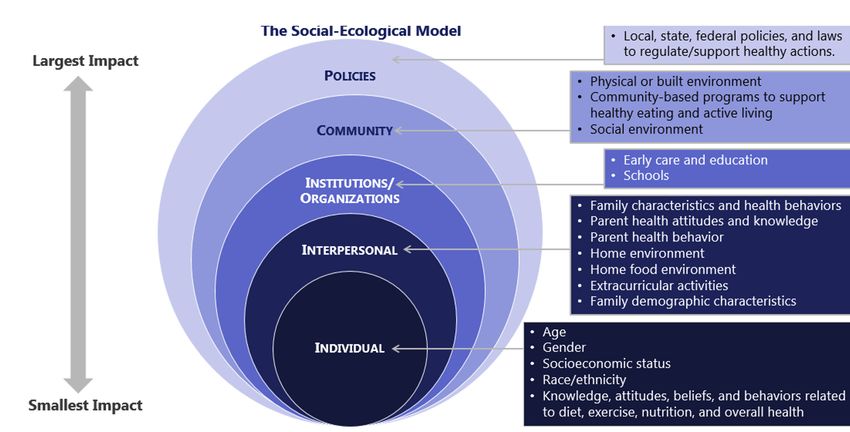
Health for a Lifetime | Obesity Prevention Plan
                                                                       Oklahoma State Department of Health

          INTRODUCTION

With a 4.6% increase in obesity from 34.8% to 36.4% in the past two years, Oklahoma
remains one of the most obese states in America. In 2020, Oklahoma had the 9th highest
obesity prevalence in the nation and is among the top-ten most obese states according to
America’s Health Rankings(1). Across the nation, 31.9% of the adult population are considered
obese compared to 36.4% of adults in Oklahoma. Overall, Oklahoma has approximately
1 million adults that are obese. Additionally, 32.3% of Oklahoma’s children ages 10-17 are
overweight or obese compared to the national average of 32.1%. Recently, there has been
improvement in the low income 2-to-5 year old population, but as a state more needs to be
done.

     Behaviors such as consumption of calorie-rich foods, diets high in fat,
     physical inactivity, and excessive alcohol consumption in addition to genetics,
     stress, and poor emotional health contribute to a person’s risk for obesity.
     Furthermore, obesity increases a person’s risk of serious health conditions
     including hypertension, type 2 diabetes, heart disease, stroke, sleep apnea and
     breathing problems, some cancers, and mental illness such as depression and
     anxiety. As a result, obesity and related conditions have contributed to medical
     expenditures exceeding $1 billion a year in Oklahoma(2).

     To address the high prevalence of obesity among the Oklahoma population,
     The Oklahoma State Department of Health (OSDH) along with more than 200
     partners from a variety of agencies worked together to create a state plan
     of action to address obesity in Oklahoma. The plan is organized by lifespan,
     ranging from the prenatal period to older adults, focusing on a comprehensive
     approach to obesity prevention and treatment during each lifespan category.
     This plan will be used to guide partnership work moving forward, but can also
     be used by professionals or individuals across the state to align programs and
     policies with the larger movement to create a more effective synergy of efforts.

                                                                                       Introduction        2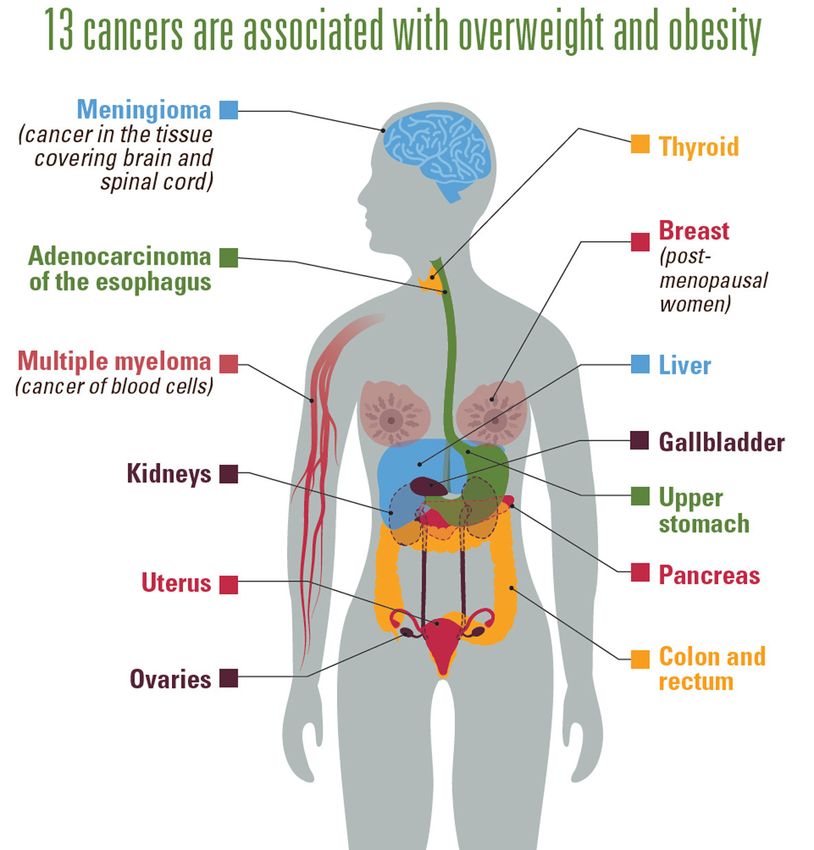
Health for a Lifetime | Obesity Prevention Plan
                                                              Oklahoma State Department of Health

COMMUNITY INVOLVEMENT

Community members and local stakeholders from across the state
worked together to identify barriers to health, as well as opportunities
for improvement in health services and the environmental factors
promoting health. Electronic surveys, community listening sessions, and
comment cards were used to identify findings and areas of improvement.
In addition, sub-committees were developed to organize the plan by
lifespan, ranging from birth to older adults. A stakeholder analysis was
conducted and over 200 stakeholders were convened to develop the goals
and objectives within this plan.

FINDINGS / AREAS OF IMPROVEMENT          SUBCOMMITEES

                                           Early Childhood (0-5)
  Built Environment

                                           School Age (5-18)

  Lack of Resources
                                           Adults (18-64)

                                           Older Adults (55+)
  Social Influences
                                           All Ages

  Health and Safety Concerns

                                                                  Community Involvement           3
Health for a Lifetime | Obesity Prevention Plan
                                                                               Oklahoma State Department of Health

               OVERVIEW
               DETERMINING OBESITY

               Body Mass Index
               The measurement of overweight and obesity most commonly used is
               Body Mass Index (BMI). BMI measures the weight to height ratio of both
               adults and children but does not measure body fat directly. Having a
               high BMI can indicate high body fat that may lead to health problems. A
               person is considered to be overweight or obese if their weight is higher
               than what is considered to be a healthy weight for a given height.

                                                .              .
                                 .              .              .

               BMI Limitations
               While BMI is easy to use and can provide some indication of a person’s
               weight status, it is inherently limited. For example, it is possible for a
               very lean and muscular individual with little body fat to weigh more
               than others of the same height due to the weight of increased muscle.
               As a result, some individuals who have a healthy amount of fat tissue
               would be inaccurately categorized as overweight or obese using BMI
               measurements. Body composition instruments such as skin calipers to
               measure skinfold thickness, bod pods, and DEXA machines are more
               precise at measuring the ratio of fat versus lean tissue, but are more
               costly, not widely available, and require training to use.

               Adult BMI
               In adults, a BMI of 25 to 29.9 is considered to be overweight and a BMI
               of 30 or greater is considered to be obese. In contrast, below 18.5 is
               considered to be underweight and 18.5 to 24.9 is normal.

BMI              Weight Status

Below 18.5       Underweight
                                                    BMI            Weight(lb) X 703
18.5 - 24.9      Normal/Healthy Weight       Body Mass Index
                                                                   (Height in inches)2

24.0 - 29.9      Overweight

30.0 & Above     Obese

                                                                             Overview: Determining Obesity         4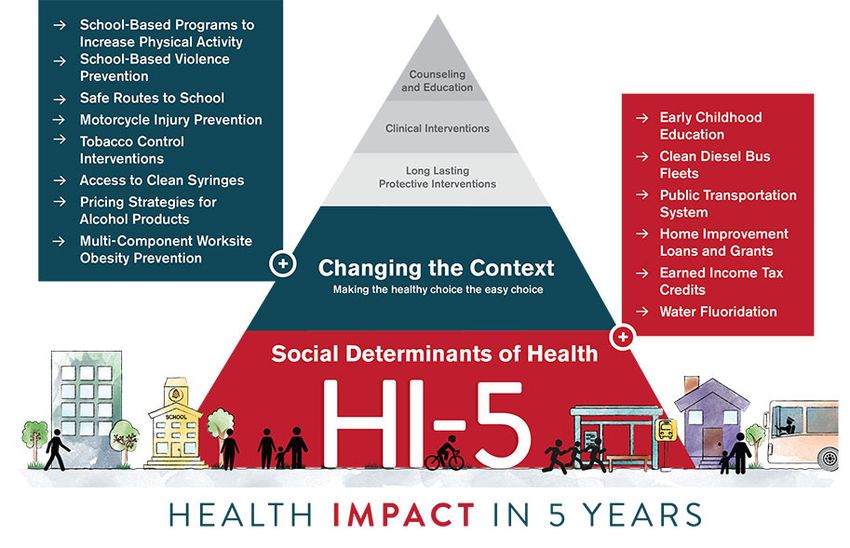
Health for a Lifetime | Obesity Prevention Plan
                                                                                                                                                                               Oklahoma State Department of Health

                                     Adults may calculate BMI using a table such as the one below. To
                                     calculate BMI, find the appropriate height in the left-hand column labeled
                                     “Height”. Move across to the right until you find the appropriate weight.
                                     The number at the top of the column is the BMI at that height and weight.

                                     For example, a person who is 64 inches tall and weighs 128 pounds has a
                                     BMI of 22. This person is considered to be of normal weight. In contrast, a
                                     person who is 64 inches tall and weighs 151 pounds has a BMI of 26 and is
                                     considered to be overweight.

                                                                                               BODY MASS INDEX TABLE

                          Normal                           Overweight                                             Obese                                                                Extreme Obesity

BMI         19    20     21     22     23     24     25    26     27     28     29     30    31     32     33     34    35     36     37     38       39   40   41   42 43   44   45     46   47   48   49   50   51   52   53   54

Height
(inches)                                                                                                 Body Weight (pounds)

58          91    96 100 105 110 115 119 124 129 134 138 143 148 153 158 162 167 172 177 181 186 191 196 201 205 210 215 220 224 229 234 239 244 248 253 258
59          94    99 104 109 114 119 124 128 133 138 143 148 153 158 163 168 173 178 183 188 193 198 203 208 212 217 222 227 232 237 242 247 252 257 262 267
60          97 102 107 112 118 123 128 133 138 143 148 153 158 163 168 174 179 184 189 194 199 204 209 215 220 225 230 235 240 245 250 255 261 266 271 276
61         100 106 111 116 122 127 132 137 143 148 153 158 164 169 174 180 185 190 195 201 206 211 217 222 227 232 238 243 248 254 259 264 269 275 280 285
62         104 109 115 120 126 131 136 142 147 153 158 164 169 175 180 186 191 196 202 207 213 218 224 229 235 240 246 251 256 262 267 273 278 284 289 295

63         107 113 118 124 130 135 141 146 152 158 163 169 175 180 186 191 197 203 208 214 220 225 231 237 242 248 254 259 265 270 278 282 287 293 299 304
64         110 116 122 128 134 140 145 151 157 163 169 174 180 186 192 197 204 209 215 221 227 232 238 244 250 256 262 267 273 279 285 291 296 302 308 314

65         114 120 126 132 138 144 150 156 162 168 174 180 186 192 198 204 210 216 222 228 234 240 246 252 258 264 270 276 282 288 294 300 306 312 318 324
66         118 124 130 136 142 148 155 161 167 173 179 186 192 198 204 210 216 223 229 235 241 247 253 260 266 272 278 284 291 297 303 309 315 322 328 334

67         121 127 134 140 146 153 159 166 172 178 185 191 198 204 211 217 223 230 236 242 249 255 261 268 274 280 287 293 299 306 312 319 325 331 338 344
68         125 131 138 144 151 158 164 171 177 184 190 197 203 210 216 223 230 236 243 249 256 262 269 276 282 289 295 302 308 315 322 328 335 341 348 354
69         128 135 142 149 155 162 169 176 182 189 196 203 209 216 223 230 236 243 250 257 263 270 277 284 291 297 304 311 318 324 331 338 345 351 358 365
70         132 139 146 153 160 167 174 181 188 195 202 209 216 222 229 236 243 250 257 264 271 278 285 292 299 306 313 320 327 334 341 348 355 362 369 376
71         136 143 150 157 165 172 179 186 193 200 208 215 222 229 236 243 250 257 265 272 279 286 293 301 308 315 322 329 338 343 351 358 365 372 379 386
72         140 147 154 162 169 177 184 191 199 206 213 221 228 235 242 250 258 265 272 279 287 294 302 309 316 324 331 338 346 353 361 368 375 383 390 397

73         144 151 159 166 174 182 189 197 204 212 219 227 235 242 250 257 265 272 280 288 295 302 310 318 325 333 340 348 355 363 371 378 386 393 401 408
74         148 155 163 171 179 186 194 202 210 218 225 233 241 249 256 264 272 280 287 295 303 311 319 326 334 342 350 358 365 373 381 389 396 404 412 420

75         152 160 168 176 184 192 200 208 216 224 232 240 248 256 264 272 279 287 295 303 311 319 327 335 343 351 359 367 375 383 391 399 407 415 423 431
76         156 164 172 180 189 197 205 213 221 230 238 246 254 263 271 279 287 295 304 312 320 328 336 344 353 361 369 377 385 394 402 410 418 426 435 443

Source: Adapted from Clinical Guidelines on the Identification, Evaluation, and Treatment of Overweight and Obesity in Adults: The Evidence Report.

                                                                                                                                                                             Overview: Determining Obesity                       5
Health for a Lifetime | Obesity Prevention Plan
                                                                         Oklahoma State Department of Health

BMI Children and Adolescents
For children and adolescents, BMI is calculated differently than with adults. Age and sex growth
charts are used to determine BMI. This is due to the body fat changes with age and the
sex-specific body fat differences in boys and girls.

In the example below, a 10-year-old boy and a 15-year-old boy both have a BMI-for-age of 23.
One of the children is considered to be obese, while the other is not. The 10-year-old boy would
be in the obese category (95th percentile or greater). The 15-year-old boy would be in the
healthy weight category (5th percentile to less than 95th percentile).

                                                                       Overview: Determining Obesity         6
Health for a Lifetime | Obesity Prevention Plan

CHILDREN’S HEALTH DATA                                                       Oklahoma State Department of Health

              CHILDREN’S HEALTH DATA
    OBESITY & OVERWEIGHT                                                 OK       STATUS            US
                                 (3)
    AGES 2-4 OBESITY PREVALENCE1                                        13.8%                      14.4%
                                       (4)
                                       2
    AGES 10-17 OBESITY PREVALENCE                                       18.7%                      16.2%
                                                   (4)
                                                   2
    AGES 10-17 OVERWEIGHT PREVALENCE                                    13.6%                      15.9%
                                             (5)
                                             3
    HIGH SCHOOL OBESITY PREVALENCE                                      17.6%                      17.1%
    HIGH SCHOOL OVERWEIGHT PREVALENCE3
                                                         (5)
                                                                        18.1%                      16.1%

    PHYSICAL ACTIVITY                                                    OK       STATUS            US
    AGES 6-17 PARTICIPATE IN PHYSICAL ACTIVITY FOR AT
                                                                        23.0%                      20.6%
    LEAST 60 MINUTES EVERY DAY2
                                (4)

    HIGH SCHOOL AGE PHYSICALLY ACTIVE AT LEAST 60
                       (5)                                              29.2%                      23.2%
    MINUTES EVERY DAY3

    NUTRITION                                                            OK       STATUS            US
    HIGH SCHOOL AGE ATE FRUIT OR DRANK 100% FRUIT
                                                                        20.3%                      28.9%
    JUICES TWO OR MORE TIMES PER DAY3(5)
    HIGH SCHOOL AGE ATE VEGETABLES THREE
                                                                         9.4%                      14.0%
    OR MORE TIMES PER DAY3
                          (5)

    BUILT ENVIRONMENTS                                                   OK       STATUS            US
    CHILDREN LIVE IN NEIGHBORHOODS WITH SIDEWALKS OR
                    (4)                                                 55.6%                      75.4%
    WALKING PATHS2
    CHILDREN LIVE IN NEIGHBORHOODS WITH A PARK OR
                (4)                                                     62.8%                      74.9%
    PLAYGROUND2
    CHILDREN LIVE IN NEIGHBORHOODS WITH RECREATION
                              (4)                                       25.3%                      48.0%
    CENTER, COMMUNITY CENTER2
    CHILDREN LIVE IN NEIGHBORHOODS WITH A LIBRARY2
                                                 (4)
                                                                        44.3%                      66.9%
                                                               4
                                                               (6)
    OKLAHOMA NEIGHBORHOODS WITH SIDEWALK                                48.6%                       N/A
    OKLAHOMA NEIGHBORHOODS WITH SIDEWALK THAT ARE
                                                                        51.1%                       N/A
    VERY WELL MAINTAINED4
                        (6)

    ACCESS TO HEALTHY FOODS / HEALTHCARE                                 OK       STATUS            US
    CHILDREN IN HOUSEHOLDS THAT COULD ALWAYS AFFORD
                                 (4)                                    61.2%                      69.8%
    TO EAT GOOD NUTRITIOUS MEALS2
                                           (7)
    PERCENTAGE OF FOOD INSECURE CHILDREN5                               20.5%                      14.6%
    OKLAHOMANS WHO STRONGLY AGREE THAT EASY TO
                                               4                        29.6%                        N/A
    PURCHASE HEALTHY FOODS IN NEIGHBORHOOD(6)
    OKLAHOMANS WHO STRONGLY AGREE THERE IS LARGE
    SELECTION OF HIGH QUALITY FRESH FRUITS AND                          23.0%                        N/A
    VEGETABLES IN NEIGHBORHOOD4(6)
    CHILD CURRENTLY COVERED BY HEALTH INSURANCE OR
                                                                        90.7%                      93.1%
    HEALTH COVERAGE PLANS2(4)

                                                                           Overview: Determining Obesity         7
Health for a Lifetime | Obesity Prevention Plan
Oklahoma State Department of Health
OVERVIEW
SCOPE OF THE PROBLEM
Across the nation obesity is one of the leading causes of preventable life-
years lost among adult Americans(8). However, obesity impacts humans all
across the lifecycle. Oklahoma, as well as many states across the nation,
has seen a steady increase in rates of obesity over the past two decades. At
times, Oklahoma has seen its rate of increase surpass many other states,
consistently leaving Oklahoma as one of the most obese states in the
country. Future projections place Oklahoma on the path to becoming the
most obese state in the United States by 2030 if the course is not altered
through obesity prevention and reduction strategies(9).
Impacts
The impacts of obesity are serious and costly. According to the CDC, obesity is
associated with poor mental health outcomes, reduced quality of life and an increased
risk for developing chronic conditions such as hypertension, type 2 diabetes, heart
disease, stroke, sleep apnea and breathing problems, some cancers, and mental
illnesses such as depression and anxiety(10). Additionally, the impact of obesity
reaches beyond an individual, extending also to statewide health care costs, business
productivity, and the nation’s defense readiness(11).
OBESITY COST OKLAHOMA
$1.72 BILLION
IN MEDICAL EXPENDITURES Overview: Scope of the Problem 8Health for a Lifetime | Obesity Prevention Plan
Oklahoma State Department of Health
Sleep Apnea Alzheimer’s Disease
Stroke Heart Disease
Liver Disease
Lung Disease
Gallstones or Type 2 Diabetes
Gallbladder Disease
Pancreatitis
Hypertension
Chronic vein
disease
Osteoarthritis
Gout
4 BEHAVIORS
POOR DIET TOBACCO USE EXCESSIVE SEDENTARY
ALCOHOL USE LIFESTYLE
5 CHRONIC CONDITIONS
Approximately 72
Oklahomans died each
day in 2019 from a CARDIOVASCULAR
DISEASE
CANCER DIABETES ALZHEIMER’S LUNG
DISEASE DISEASE
4-5-61 chronic
disease or about one Four unhealthy behaviors influence five chronic diseases
Oklahoman every that account for about 61% of all deaths in Oklahoma.
20 minutes.
Overview: Scope of the Problem 9Health for a Lifetime | Obesity Prevention Plan
Oklahoma State Department of Health
13 Cancers Associated with Overweight & Obesity
Being overweight or obese increases the risk for
developing certain types of cancer due to excess body
fat and the impact it has on:
▶ Immune system function and inflammation
▶ Levels of certain hormones (insulin and estrogen)
▶ Regulation of cell growth
▶ Proteins that influence how the body uses hormones
Overview: Scope of the Problem 10Health for a Lifetime | Obesity Prevention Plan
Oklahoma State Department of Health
Many Oklahomans experience very poor health outcomes. Our state ranks 49th in the
nation for deaths due to cardiovascular disease, 48th in deaths due to cancer, and 42nd for
premature death(12). When looking specifically at deaths due to heart disease and stroke,
Oklahoma exceeds the national average.
HEALTH OUTCOMES - OKLAHOMA(6)(13) OKLAHOMA STATUS USA
LIFE EXPECTANCY
MALE LIFE EXPECTANCY 73.2 76.3
FEMALE LIFE EXPECTANCY 78.3 81.4
OVERALL LIFE EXPECTANCY 75.7 78.8
ADULT OBESITY PREVALENCE 36.4% 31.9%
CHILDHOOD OBESITY PREVALENCE (WIC 2-4 YEARS) 13.8% 14%
PHYSICAL ACTIVITY (PA) PREVALENCE (ANY/LAST 30 DAYS) 71.4% 77.6%
AEROBIC PA (150 MINS/WEEK) 37.3% 50.1%
MINIMAL VEGETABLE CONSUMPTION PREVALENCE * 21.5% 21.2%
MINIMAL FRUIT CONSUMPTION PREVALENCE* 48.4% 39.3%
DIABETES PREVALENCE 13.0% 10.6%
HYPERTENSION PREVALENCE 37.8% 32.3%
CARDIOVASCULAR DISEASE (AGE-ADJUSTED DEATH RATE) 300.3 224.4
CANCER (AGE-ADJUSTED DEATH RATE) 171.1 144.1
LEGEND
BETTER THAN NATIONAL OUTCOME
± 0.5 FROM NATIONAL OUTCOME *ConsumedHealth for a Lifetime | Obesity Prevention Plan
Oklahoma State Department of Health
Obesity rates are generally higher for certain population groups than others. African-
Americans and American Indians tend to have higher rates of obesity than Caucasians
and other races, and several health conditions and chronic diseases reflect similar ethnic
differences. The most consistent upstream social determinant of obesity is socio-economic
status. In 2020, the highest prevalence of obesity was 42.2% among those with a household
income less than $15,000 while college graduates continue to have the lower prevalence of
obesity (32.7%) compared to other educational levels. Additionally, adults 45-54 years of age
have the highest prevalence of obesity.
RACE / ETHNICITY EDUCATION
CAUCASIAN 35.5% LESS THAN
35.4%
HIGH SCHOOL
AFRICAN HIGH SCHOOL
42.1% OR G.E.D 39.0%
AMERICAN
AMERICAN SOME 36.9%
42.7%
INDIAN COLLEGE
34.3% COLLEGE 32.7%
HISPANIC
GRADUATE
INCOME AGE
LESS THAN 18-24 24.1%
42.2%
$15,000
$15,000 ̶ 25-34 37.3%
$24,999 36.5%
35-44 41.8%
$25,000 ̶
39.0% 45-54 45.1%
$49,999
$50,000 ̶ 55-64 42.3%
38.5%
$74,999
65+ 29.8%
$75,000 + 34.9%
Overview: Scope of the Problem 12Health for a Lifetime | Obesity Prevention Plan
Oklahoma State Department of Health
FROM EARLY CHILDHOOD TO ADULTHOOD, OBESITY IS
A PROBLEM ACROSS THE HUMAN LIFESPAN.
18.7%
Oklahoma (2019-20) 13th
16.2%
United States (2019-20)
In 2019-20, seventy-eight thousand or 1 out of 5 of Oklahoma’s children ages 10-17 were
obese(4). This is concerning because children with obesity are more likely to have obesity as
adults and further increase the severity of adult obesity in Oklahoma. Oklahoma has seen a
decrease in WIC participants ages 2-5 years who are obese.
APPROXIMATELY
1 MILLION
OKLAHOMA ADULTS
WERE OBESE IN 2019
That’s about 1 out of every 3 adults.
Overview: Scope of the Problem 13Health for a Lifetime | Obesity Prevention Plan
Oklahoma State Department of Health
Contributing Factors
The complexity of obesity, with its many contributing factors, makes finding solutions more
challenging than just telling people to “eat less and move more”. Obesity is a complex issue
with many contributing factors. In general, obesity occurs when caloric intake exceeds
caloric expenditures resulting in the body storing the excess calories as fat. While genetics
may contribute to an increased risk of weight gain, most contributing factors (e.g., poor diet,
sedentary lifestyle, excessive alcohol use) are within an individual’s control.
OKLAHOMA ADULTS Poor Diet
21.5%
Consumed The 2020–2025 Dietary Guidelines for Americans advise
vegetables less
than one time incorporating more fruits and vegetables into U.S. residents’
per day diets as part of healthy dietary patterns. Adults should
OKLAHOMA YOUTH consume 1.5–2 cup-equivalents of fruits and 2–3 cup-
Consumed
equivalents of vegetables daily. A healthy diet supports
9.4% vegetables 3+
times/day past 7
days
healthy immune function and helps to prevent obesity,
type 2 diabetes, cardiovascular diseases, and some cancers;
having some of these conditions can predispose persons to
OKLAHOMA ADULTS more severe illness and death from COVID-19(14).
48.4%
Consumed fruit
less than one
time per day
FRUIT AND VEGETABLE
OKLAHOMA YOUTH RECOMMENDATIONS
20.3%
Consumed fruit
2+ times/day
past 7 days AGES DAILY AMOUNT DAILY AMOUNT
2-3 1 CUP 1 CUP
CHILDREN
4-8 1 - 1 1/2 CUPS 1 1/2 CUPS
9-13 1 1/2 CUPS 2 CUPS
GIRLS
14-18 1 1/2 CUPS 2 1/2 CUPS
9-13 1 1/2 CUPS 2 1/2 CUPS
BOYS
14-18 2 CUPS 3 CUPS
19-30 2 CUPS 2 1/2 CUPS
WOMEN
31-50 1 1/2 CUPS 2 1/2 CUPS
51+ 1 1/2 CUPS 2 CUPS
19-30 2 CUPS 3 CUPS
MEN 31-50 2 CUPS 3 CUPS
51+ 2 CUPS 2 1/2 CUPS
Overview: Scope of the Problem 14Health for a Lifetime | Obesity Prevention Plan
Oklahoma State Department of Health
Sedentary Lifestyle OKLAHOMA ADULTS
Additionally, only 37.3% of Oklahoma adults and 29.2%
37.3%
Participated
of children participate in adequate amounts of physical in 150 mins or
activity(13). Lack of physical activity and an overall sedentary more of aerobic
PA per week.
lifestyle are also contributing factors to obesity. Physical
inactivity increases the risk of heart disease, diabetes, stroke,
high blood pressure, osteoporosis, certain cancers, as well as OKLAHOMA YOUTH
contributes to stress.
29.2%
Active 60min
everyday during
the past 7 days.
Physical activity is bodily movement caused by your muscles. It’s intentionally done and
increases the number of calories you burn. When balanced with the recommended
daily caloric intake, engaging in physical activity will help people maintain a healthy
body weight. Physical activity decreases fat around the waist and total body fat, slowing
the development of abdominal obesity. Weight lifting, push-ups, and other muscle-
strengthening activities build muscle mass, increasing the energy that the body burns
throughout the day-even when it’s at rest-and making it easier to control weight. Weight
bearing exercises build bone mass and reduce the risk for osteoarthritis. Physical activity
reduces depression and anxiety, and this mood boost may motivate people to stick with
their exercise regimens over time.
Physical Activity Recommendations(15)
PRESCHOOL (3-5 YEARS) CHILDREN AND TEENS
(6-17 YEARS)
PA everyday throughout the day
60 minutes or more moderate to
vigorous intensity PA each day.
ADULT (18-64 YEARS) OLDER ADULT (65+ YEARS)
At least 150 minutes each week of At least 150 minutes each week of
moderate intensity activity and 2 moderate intensity activity and 2
days a week activities to strengthen days a week activities to strengthen
muscles. muscles.
Activities to improve balance
Overview: Scope of the Problem 15Health for a Lifetime | Obesity Prevention Plan
Oklahoma State Department of Health
The Social-Ecological Model
Many factors influence our health from our social ties to where we live to our access to
healthy food. All these factors, and many more, are interrelated and combine to create our
individual lived experiences. They are also influenced by social norms; the environment
in which we live, work, learn, and play; and public policies. The social-ecological model is
one framework for understanding the multifaceted and interactive effects of the personal
and environmental factors that determine behaviors and ultimately health outcomes. The
model shows how various factors influence our diets, physical activity patterns, tobacco use,
and ultimately health outcomes.
Overview: Scope of the Problem 16Health for a Lifetime | Obesity Prevention Plan
Oklahoma State Department of Health
OPPORTUNITIES FOR OKLAHOMA
TO THRIVE
It can be discouraging that Oklahoma is on the path to becoming the most obese state
in the United States by 2030(9). This projection will not come to fruition if evidence-based,
cross-sectoral approaches are taken. The state obesity plan was carefully developed to
incorporate interventions that can address the conditions in the places where people live,
learn, work, play, and pray. These conditions are referred to as the Social Determinants of
Health (SDoH). Healthy People 2030 organizes the SDoH into 5 domains(16):
ECONOMIC STABILITY
EDUCATION ACCESS and QUALITY
HEALTH CARE ACCESS and QUALITY
NEIGHBORHOOD and BUILT ENVIRONMENT
SOCIAL and COMMUNITY CONTEXT
Addressing the SDoH requires that public health organizations work across sectors to
improve health. Public-private partnerships are key in achieving some of the overarching
goals of Healthy People 2030 including creating social, physical, and economic environments
that promote attaining the full potential for health and well-being for all(17). The National
Center for Chronic Disease Prevention and Health Promotion establishes that health
departments are uniquely positioned to drive progress by addressing the following
determinants; built environment, community-clinical linkages, food and nutrition security,
social connectedness, and tobacco-free policy(18).
A key issue in the economic stability domain is addressing food insecurity. Oklahoma
has some of the worst food insecurity rates in the nation(19). Reducing food insecurity and
increasing healthy food consumption is incorporated across this plan. Reducing food deserts
in high priority areas, increasing food insecurity screenings and connection to resources,
increasing access to summer meals, and increasing healthy donations from corporations
to charitable programs are just some of the objectives within this plan that seek to offer
sustainable solutions to address hunger and reach those who are most vulnerable.
The state obesity plan is a 5-year plan
to prevent and reduce obesity in Oklahoma.
Stakeholders took careful considerations
to craft objectives which could have the
highest impact. The CDC HI-5 initiative
highlights non-clinical, community-wide
approaches that have evidence reporting
positive health impacts, results within five
years, and cost effectiveness and/or cost
savings over the lifetime of the population
or earlier(20). The CDC HI-5 interventions can
prevent or reduce several health conditions
at once. Oklahoma’s state obesity plan
incorporates school-based programs to
increase physical activity, safe routes to
schools, multi-component worksite obesity
prevention, and early childhood education.
These specific strategies are proven to
have the biggest impact on health over
the next 5 years.
17Health for a Lifetime | Obesity Prevention Plan
Oklahoma State Department of Health
GOALS AND OBJECTIVES
The objectives outlined in the plan aim to take a comprehensive approach to combating
obesity. There is a call for coordination with healthcare systems to increase resources and
education for providers in an effort to more effectively work with patients on managing
weight status. The plan focuses on providing adequate access to all Oklahomans across the
state and also highlights improvements to the environments in which most Oklahomans
spend most of their time. This includes early care and education locations, schools,
worksites, and the communities in which people live, work, and play.
While personal responsibility will always be a component of weight management, the plan
aims to identify environmental changes which will make it easier for all Oklahomans to
choose to be healthier, and to encourage healthy habits and behaviors. This plan also aims
to put resources and education in the hands of Oklahomans so the decisions they make
can be well informed, but also supported by the environment in which they live with the
ultimate goal of creating a state of health!
Individuals representing over 70 agencies came together to develop a vision and mission,
as well as specific goals and objectives to be undertaken by partners across the state. Each
objective was identified as an area of need, and a Coordinating Agency was designated
to ensure the objective was actionable, and coordinate group effort to work toward
completion of the objective. In addition, there were proposed agencies that would be a
good fit to be Partners in Implementation, due to their area of work and expertise, and
those agencies would be invited to work towards the objective if they were not already
present in the planning process. These objectives were then pared down into a priority plan
comprised of high readiness or high impact strategies, which would be the focus of work,
while contributing to the larger plans set forth. This plan will be used to guide partnership
work moving forward, but can also be used by professionals or individuals across the state
to align programs and policies with the larger movement to create a more effective synergy
of efforts.
VISION
Enhance the well-being of all Oklahomans.
MISSION
Improve sustainable access to a healthy environment by empowering statewide
collaboration through evidence-based practices and innovation.
HIGH LEVEL GOALS
Decrease childhood obesity rates by 3% by 2026
Decrease adult obesity rates by 1% by 2026
Goals and Objectives 18Health for a Lifetime | Obesity Prevention Plan
Oklahoma State Department of Health
ALL AGES
INCREASE ACCESS TO CARE FOR ALL OKLAHOMANS
By 2025, increase by 3 the number of fully recognized organizations certified in the National
Diabetes Lifestyle Change Program.
By 2026, increase by 10% the number of participants in a fully recognized National Diabetes
Lifestyle Change Program in Oklahoma.
By 2026, decrease the uninsured percent in Oklahoma from 14.3% (2019) to below 10%.
By 2026, increase reimbursement for obesity treatment options within Medicaid.
By 2026, increase reimbursement for obesity treatment options within Healthchoice.
By 2026, establish 20 telehealth pods with Rural Digital Navigators in public libraries located
in rural areas.
INCREASE THE UTILIZATION OF AVAILABLE DATA
By 2024, create a statewide physical activity, nutrition, and obesity treatment programmatic
registry.
By 2024, create a statewide BMI data registry.
INCREASE BUILT ENVIRONMENT INFRASTRUCTURE WHICH PROMOTES SAFE BIKING AND WALKING
By 2024, adopt 1 state-level Complete Streets Policy.
By 2025, have a dedicated amount of state funding appropriated for active transportation
infrastructure.
By 2024, have 1 adopted planning and/or design guidance document adopted by a
statewide planning organization or Oklahoma Municipal League or Oklahoma Chapter of
the American Planning Association.
By 2025, initiate and begin implementation for 8 or more complete streets plans in a
community that did not have a plan prior to Jan 1, 2022.
By 2025, enhance 14 existing parks per year with new environmental structures to promote
physical activity (e.g. shade structures, walking trails, multi-use courts, etc.).
IMPROVE THE NUTRITION ENVIRONMENT IN COMMUNITIES ACROSS OKLAHOMA
By 2024, work collaboratively at the food bank level on incorporating Healthy Eating
Research nutrition guidelines and cultural preferences among both of Oklahoma’s food
banks.
By 2024, work at the state and local level to support changes through policy and practice to
build community support, increase access, create culturally supportive environments, and
build demand for Healthy Eating Research nutrition guidelines and Supporting Wellness
at Pantries (SWAP) stoplight system at Oklahoma food banks and within their partner
programs.
By 2024, pass 1 state level policy to incentivize affordable healthy food options.
By 2026, reduce by 2 the number of food desert tracts in Oklahoma.
By 2026, increase by 12 the number of retail stores applying for the Healthy Food Financing
Program.
By 2025, increase the number of healthy concession stands in public areas such as
community recreational centers.
By 2022, increase by 5% the number of people utilizing clinic food incentive referral
programs to farmers markets.
Goals and Objectives 19Health for a Lifetime | Obesity Prevention Plan
Oklahoma State Department of Health
INCREASE THE LIKELIHOOD THAT PERSONS LIVING IN LOW-INCOME HOUSEHOLDS (AT OR BELOW
185% OF THE FEDERAL POVERTY LEVEL) WILL MAKE HEALTHY FOOD AND PHYSICAL ACTIVITY
CHOICES.
By 2023, increase by 5% the number of schools that participate in an interactive education
program to promote healthy eating with a parental in-direct education component such as
(Body Adventures, Eagle Adventure, Farm to You, and etc.).
By 2023, increase by 2% the number of SNAP or FDPIR recipients/eligibles participating in
SNAP-Ed direct education.
By 2023, increase by 5% the provided food resource management strategies in classes
offered to individual/families living in low-income households.
By 2023, increase by 5% the number of EBT accepting farmers markets, food hubs, and farm
stands.
By 2023, increase by 5% the number of community initiatives focusing on policy, system or
environment changes to improve access to healthy food for individuals/families living in
low-income households.
INCREASE SCREENINGS AND REFERRALS FOR ALL AGES
By 2026, ensure that at least one SNAP Application Assistance Partner and/or site is serving
each county in Oklahoma.
By 2024, increase the number of organizations/sites that screen for food insecurity and
initiate closed-loop referrals to the SNAP Application Assistance Hotline.
By 2026, increase utilization of the Oklahoma SNAP Application Assistance Hotline for
Grocery Assistance referrals across all counties by 20% to reduce food insecurity and related
health outcomes.
By 2026, 200 healthcare delivery sites will screen for food insecurity and/or Social
Determinants of Health needs annually at a minimum based on presentation for care.
By 2026, 80% of all patients with reported food insecurity or SDoH needs will be provided
referrals to food resources including SNAP and food pantries.
INCREASE FREE SOCIAL SUPPORT PROGRAMMING TO IMPROVE NUTRITION AND INCREASE
PHYSICAL ACTIVITY
By 2026, develop 1 health communication plan or central hub which educates the public on
free social support programming available across the state.
By 2026, increase free social support programming which is inclusive of nutrition and/or
physical activity.
By 2023, expand Let’s Get Moving programming to one additional community.
By 2026, 70 public libraries will have ongoing health literacy programs and projects which
are inclusive of nutrition education and/or physical activity components.
Goals and Objectives 20Health for a Lifetime | Obesity Prevention Plan
Oklahoma State Department of Health
EARLY CHILDHOOD
IMPROVE THE QUALITY OF CARE TO PREVENT AND/OR TREAT OBESITY IN CLINICS CARING
FOR CHILDREN
By 2022, identify a minimum of 2 partners with expertise in pediatric obesity to provide
training in pediatric obesity assessment and management to pediatric primary care
clinicians and dietitians.
By 2025, offer 20 trainings in pediatric weight management to pediatric primary care
practices.
By 2024, increase the number of counties with pediatric clinicians and dietitians
participating in tele-education on pediatric weight management.
By 2024, establish two full time, multidisciplinary child and adolescent obesity treatment
programs that provide the full scope of obesity treatment services as recommended in
current professional guidelines.
By 2024, increase by 10% the number of pediatric primary care practices joining the Healthy
Steps network.
IMPROVE THE EARLY CARE ENVIRONMENT SUPPORTS FOR APPROPRIATE PHYSICAL ACTIVITY
& NUTRITION
By 2022, increase to 700 the number of Certified Healthy Excellent ECE centers and homes.
By 2024, incorporate Certified Healthy ECE into QRIS criteria.
By 2024, all licensed child care programs that participate in the Reaching for the Stars
program will adopt at least one new practice to promote healthy weight.
By 2026, 40 licensed child care and education programs in high risk areas will have
participated in the GoNAPSACC program.
INCREASE BREASTFEEDING RATES
By 2025, increase by 3 the number of birthing hospitals with International Board Certified
Lactation Consultants (IBCLCs).
By 2025, increase by 10 the number of IBCLC’s.
By 2025, increase by 5 the number of IBCLCs representing minorities/BIPOCs.
By 2025, contacts with the breastfeeding hotline will represent 80% of Oklahoma birthing
hospitals.
By 2025, increase by 15% contacts to the breastfeeding hotline.
By 2025, Increase by 5 the number of Baby Friendly Hospitals with a particular focus on
rural and tribal hospitals.
By 2025, increase by 10% the number of Breastfeeding Friendly Businesses with a particular
focus on rural and tribal communities.
Goals and Objectives 21Health for a Lifetime | Obesity Prevention Plan
Oklahoma State Department of Health
INCREASE NUTRITION EDUCATION PROVIDED TO WOMEN OF CHILDBEARING AGE, DURING THE
PRENATAL PERIOD, AND TO THE PARENTS OF CHILDREN AGED 0-5
By 2025, increase by 50% the number of OB/GYN and Family Practice Physicians that
receive ongoing education regarding the correlation between prenatal nutrition and
childhood obesity.
By 2025, increase by 50% the number of providers seeing patients during the prenatal
period and those providers seeing patients during childbearing years and providing
education to patients regarding the impact of prenatal nutrition on the developing fetus as
related to the development of childhood obesity.
By 2026, lower childhood obesity rates in children 2-5 years of age enrolled in the WIC
program by offering nutritious food options, nutrition education, and nutrition counseling
opportunities to WIC participants beginning during the prenatal period and extending
through 5 years of age.
By 2024, home visitation programs will increase by 10% the number of nutrition service
referrals and initiation of services.
INCREASE MESSAGING TAILORED TO CAREGIVERS OF PRE-SCHOOL AGE CHILDREN PROMOTING
A HEALTHY WEIGHT AND HEALTH PROMOTING BEHAVIORS
By 2024, develop 1 health communication plan specifically tailored towards caregivers of
pre-school age children and nutrition and physical activity health behaviors.
By 2024, home visitation programs will increase by 10% the number of families setting
physical activity goals.
Goals and Objectives 22Health for a Lifetime | Obesity Prevention Plan
Oklahoma State Department of Health
SCHOOL AGE
IMPROVE THE QUALITY OF CARE TO PREVENT AND/OR TREAT OBESITY IN CLINICS CARING
FOR CHILDREN
By 2025, increase by 22 the number of counties with health care providers served by
innovative educational programming in the management of overweight and obesity in
children and adolescents.
By 2025, treatment of obesity in adolescents and children will be incorporated into the
Continuing Medical Education of pediatricians and related providers in Oklahoma.
By 2024, establish two full time, multidisciplinary child and adolescent obesity treatment
programs that provide the full scope of obesity treatment services as recommended in
current professional guidelines.
By 2025, offer 20 trainings in pediatric weight management to pediatric primary care
practices.
INCREASE THE UTILIZATION OF AVAILABLE DATA
By 2024, create a statewide physical activity, nutrition, and obesity treatment programmatic
registry.
By 2024, create a statewide BMI data registry.
By 2024, have a dedicated amount of funding appropriated for 1 confidential and sensitive
nutrition and physical activity assessment training for schools.
IMPROVE THE NUTRITIONAL ENVIRONMENT IN OKLAHOMA SCHOOLS
By 2024, increase by 10% the number of public school districts utilizing the Smarter Lunch
Room Checklist.
By 2024, all students are offered at least 20 minutes from the time they are seated to
consume their lunch and at least 10 minutes for breakfast.
INCREASE THE PERCENT OF CHILDREN IN AREAS WITH 50% OR GREATER FREE AND REDUCED-
PRICE MEAL ELIGIBILITY (HIGH-NEED AREAS) WITH ACCESS TO NUTRITION PROGRAMS
YEAR-ROUND
By 2026, increase the percentage of youth accessing summer food through either Seamless
Summer, Summer Food Service Program, and/or Tribal Summer EBT.
By 2024, have 100% of counties with an implemented summer feeding program.
By 2026, increase afterschool meals and/or the number of organizations offering afterschool
meals in high-need areas.
By 2026, each high-need county has at least one open meal site each month of the year.
INCREASE THE AMOUNT OF MODERATE TO VIGOROUS PHYSICAL ACTIVITY TIME IN OKLAHOMA
SCHOOLS
By 2024, pass 1 state level policy requiring recess be provided prior to the school lunch
period.
By 2024, develop, promote, and conduct web-based and/or in-person professional
development trainings around implementing recess before lunch.
By 2024, increase PE compliance by 15%, without increasing class size.
By 2024, have mandated and funded PE, or equivalent, requirement of 1 semester per year
in secondary schools.
By 2026, increase by 4% the number of schools implementing a joint use policy.
By 2025, increase the number of communities with safe routes to school
policies and/or implementation of safe routes to school. Goals and Objectives 23Health for a Lifetime | Obesity Prevention Plan
Oklahoma State Department of Health
INCREASE THE NUMBER OF SCHOOLS IMPLEMENTING SOCIAL EMOTIONAL LEARNING STRATEGIES
By 2025, 65% of school districts in Oklahoma will demonstrate knowledge of the importance
of systemic SEL implementation.
By 2025, 40% of school districts in Oklahoma will demonstrate dedication to SEL by
implementing the OSDE SEL competencies.
INCREASE THE NUMBER OF SCHOOLS IMPLEMENTING THE WHOLE SCHOOL, WHOLE COMMUNITY,
WHOLE CHILD MODEL
By 2026, increase the number of school administrators and other school personnel
obtaining the WSCC micro-credential to 200.
By 2025, increase by 5%, the number of Certified Healthy Excellent schools.
INCREASE HEALTH EDUCATION IN SCHOOLS
By 2021, enact 1 state level policy to ensure age-appropriate health education is taught in all
Oklahoma schools.
By 2023, funding for the development of an open access Skills Based Health Education
curriculum for all grade bands will be identified.
By 2023, funding for school based health staff to receive Professional Development for Skills
Based Health Education will be identified.
INCREASE MESSAGING TAILORED TO ADOLESCENTS PROMOTING A HEALTHY WEIGHT AND HEALTH
PROMOTING BEHAVIORS
By 2022, develop 1 health communication plan specifically tailored toward adolescents and
nutrition and physical activity health behaviors. (ensuring at risk and state care children are
involved in the process).
INCREASE HEALTH PROMOTION EFFORTS AMONG VULNERABLE ADOLESCENT POPULATIONS
By 2025, direct service state agencies are actively enrolling eligible transitioning youth in
SNAP, Soonercare, and Community Nutrition Education Program within 6 months of their
transition.
By 2024 develop a means of tracking and verifying transitioning youth enrollment in
nutrition and nutrition education programming.
By 2026, credential at least 1,000 wellness coaches to help promote a culture of wellness
and provide wellness services to children and families in the behavioral health system.
Goals and Objectives 24Health for a Lifetime | Obesity Prevention Plan
Oklahoma State Department of Health
ADULTS
INCREASE THE HEALTH PROMOTING ENVIRONMENT OF EMPLOYERS ACROSS OKLAHOMA
By 2022, increase by 20% the number of Certified Healthy Excellent Businesses with a
particular focus on disparate populations.
By 2024, pass 1 state level policy that incentivizes employers to adopt and implement
comprehensive workplace wellness policies.
By 2026, 100 businesses will be trained in the CDC’s Work@Health program.
INCREASE HEALTH PROMOTING PARTNERSHIPS AND COMPONENTS WITHIN THE FOOD SYSTEM
By 2026, expand Double up Oklahoma to 18 additional communities (100% increase)
designated as high need and/or Low Income Low Access.
By 2026, have a dedicated amount of in-state, recurring funding for Double Up Oklahoma
to increase access to fresh produce for SNAP participants.
By 2025, one innovative private/public partnership increasing access to healthy foods in
areas of low-income and low-access will be identified.
By 2026, increase healthy donations from corporate partners to food assistance programs.
INCREASE CAPACITY WITHIN THE HEALTH CARE SYSTEM TO PREVENT AND TREAT OBESITY
By 2023, healthcare partners will conduct a total of 4 nutrition education classes for
healthcare providers to increase capacity to engage Oklahomans in obesity prevention and
treatment.
By 2023, all counties have at least one designated “obesity medicine clinic” to provide a
dedicated assessment of obesity.
By 2025, increase to three the number of professional medical education schools offering
comprehensive, multidisciplinary curricula in obesity medicine.
By 2026, increase by 18 the number of health care providers with the American Board of
Obesity Medicine’s Obesity Medicine Certification.
By 2026, provide at least 50 community organizations, health practitioners, schools, and
health agencies training related to the impact of food and nutrition security on obesity
and the strategies, tools, and resources available to protect/improve food security in their
communities.
REDUCE WEIGHT STIGMA AND DISCRIMINATION
By 2025, reduce the stigma around weight through Continuing Education Credits (CECs) for
current providers around addressing stigma.
By 2023, incorporate weight stigma and associated mental health needs into the
Community Health Worker training curriculum.
By 2026, increase targeted, unbiased interventions to individuals with obesity and their
families by providing diabetes education, resources, and technical assistance to Certified
Community Behavioral Health Centers, Counseling and Mental Health Centers, and
Comprehensive Community Addiction Recovery Centers.
By 2026, ensure that the prevention of weight based victimization, weight bias, and weight
stigma is included in the action planning across educational related objectives within the
state obesity plan.
Goals and Objectives 25Health for a Lifetime | Obesity Prevention Plan
Oklahoma State Department of Health
OLDER ADULTS
IMPROVE THE QUALITY AND AVAILABILITY OF HEALTH CARE FOR OLDER ADULTS
By 2026, increase Medicaid enrollment among adults aged 55-64.
By 2023, an educational session on “medical (pharmacotherapy) and surgical (bariatric
surgery) treatments of obesity in older adults” will be implemented in CME courses of
primary care providers (PCP), and be presented to at least 50% of PCPs every year.
INCREASE SCREENINGS AND REFERRALS FOR OLDER ADULTS
By 2023, increase by at least 2 the number of health care clinics utilizing a food insecurity
screening in the intake/EHR process and providing additional resources for those who
screen as food insecure.
By 2026, increase the number of health care providers utilizing a physical activity screening
in the intake/EHR process and providing information on how to get more physically active.
IMPROVE THE NUTRITION ENVIRONMENT IN COMMUNITIES ACROSS OKLAHOMA
By 2025, increase by 3 the number of senior targeted Community Nutrition Education
Program class providers in Oklahoma.
By 2025, conduct an analysis on senior nutrition sites in Oklahoma to identify opportunities
to increase nutrition education within meal sites.
By 2026, implement 2 new community gardens in high need areas.
By 2026, increase access to and utilization of Older American Act programming.
INCREASE PHYSICAL ACTIVITY OPPORTUNITIES FOR OLDER ADULTS
By 2026, Increase by 2 the number of “Age Friendly Communities”.
By 2024, Increase by 8 the number of organizations that offer evidence based physical
activity programs designed for seniors.
By 2024, increase to 60 the number of public libraries hosting older adult focused (tai chi,
SAIL) physical activity events at least once per week.
By 2024, Increase by 25% the number of OHAI trained exercise leaders.
Goals and Objectives 26Health for a Lifetime | Obesity Prevention Plan
Oklahoma State Department of Health
PARTNERS
AARP Oklahoma Commission on Children and
Absentee Shawnee Tribal Health System Youth
American Heart Association Oklahoma Department of Libraries
Ardmore Institute of Health Oklahoma Health Care Authority
Association of Central Oklahoma Governments Oklahoma Hospital Association
Big Brothers Big Sisters of Oklahoma Oklahoma Institute for Child Advocacy
Blue Zones Project Durant Oklahoma Nutrition Information and
Blue Zones Project Pottawatomie County Education (ONIE) Project
Boys & Girls Clubs of Oklahoma County Oklahoma Municipal League
Building Healthy Military Communities Oklahoma Lactation Consultant
CDC Foundation Association (OKLCA)
Chickasaw Nation Oklahoma Partnership for Expanded
City of Oklahoma City Learning
Coalition of Oklahoma Breastfeeding Advocates (COBA) Oklahoma Partnership for School
Comanche County Memorial Hospital Readiness
Community Food Bank of Eastern Oklahoma Oklahoma Primary Care Association
The Cooper Institute Oklahoma State Department of Education
EODD Area Agency on Aging Oklahoma State Medical Association
Guiding Right Oklahoma State University
Health Alliance for the Uninsured OSU Extension
HealthChoice OSU – Community Nutrition Education
Healthy Schools Oklahoma Programs (CNEP)
Hunger Free Oklahoma Oklahoma Tribal Engagement Partners
Institute for Quality Communities Oklahoma State University Family Health
INTEGRIS Health and Nutrition Clinic
Latino Community Development Agency Education (ONIE) Project
Lynn Institute Oklahoma State Department of Health
MyHealth Access Network OU Health
Mercy Hospital OU Health Science Center
Oklahoma Department of Mental Health and University of Oklahoma
Substance Abuse Services OUHSC/Oklahoma Healthy Aging Initiative
Office of Management and Enterprise Services (OHAI)
Oklahoma Foundation for Medical Quality Palomar
OK Department of Transportation Potts Family Foundation
OK Institute for Child Advocacy Regional Food Bank of Oklahoma
Oklahoma State Department of Agriculture Smart Start
OKC Community Foundation SoonerStart
OKC-County Health Department Southwest Oklahoma Regional
Oklahoma Department of Human Services (OKDHS) Transportation Planning Organization
Oklahoma 4-H Youth Development Sunbeam Family Services
Oklahoma Alliance of YMCAs Tobacco Settlement Endowment Trust
Oklahoma Association for Health, Physical Education, Tulsa Health Department
Recreation, and Dance (OAHPERD) The Indian Nations Council of Governments
Oklahoma Breastfeeding Resource Center (OBRC) Tulsa Planning Office
Oklahoma Center for Nonprofits Tulsa YMCA
Oklahoma City Indian Clinic University of Central Oklahoma
Oklahoma City Planning Department YMCA - Greater OKC
27Health for a Lifetime | Obesity Prevention Plan
Oklahoma State Department of Health
REFERENCES
1) United Health Foundation. (2021). America’s Health Rankings analysis of America’s Health
Rankings composite measure. America’s Health Rankings. Retrieved [April, 2022], from https:/www.
americashealthrankings.org/explore/annual
2) Wang, Y. C., Pamplin, J., Long, M. W., Ward, Z. J., Gortmaker, S. L., & Andreyeva, T. (2015). Severe obesity in
adults cost state medicaid programs nearly $8 billion in 2013. Health Affairs, 34(11), 1923-1931.
3) WIC Participant and Program Characteristics (WICPPC) survey. The data are gathered in April of even-
numbered years, and analyzed by the CDC. Centers for Disease Control and Prevention. National Center for
Chronic Disease Prevention and Health Promotion, Division of Nutrition, Physical Activity, and Obesity Data,
Trend and Maps. https://www.cdc.gov/nccdphp/dnpao/data-trends-maps/index.html. Trend data available
from 2000-2018.
4) 2019-2020 National Survey of Children’s Health (NSCH) data query. Data Resource Center for Child and
Adolescent Health supported by the U.S. Department of Health and Human Services, Health Resources and
Services Administration (HRSA), Maternal and Child Health Bureau (MCHB). The data are gathered annually.
Trend data available from 2016 -2020.
5) Oklahoma State Department of Health (OSDH), Center for Health Statistics, Health Care Information, Youth
Risk Behavior Survey 2019, on Oklahoma Statistics on Health Available for Everyone (OK2SHARE). Accessed at
https://www.health.state.ok.us/. The data are gathered in odd-numbered years. Trend data available from
2003-2019.
6) Oklahoma State Department of Health (OSDH), Center for Health Statistics, Health Care Information,
Behavioral Risk Factor Surveillance System 2020, on Oklahoma Statistics on Health Available for Everyone
(OK2SHARE). Accessed at https://www.health.state.ok.us/. The data are gathered annually. Trend data
available from 2011-2020.
7) Map the Meal Gap 2021. Child Food Insecurity in The United States in 2019. https://map.feedingamerica.org/
county/2019/child
8) United Health Foundation. (2020). America’s Health Rankings analysis of CDC, Behavioral Risk
Factor Surveillance System. America’s Health Rankings. Retrieved [April, 2022], from https://www.
americashealthrankings.org/explore/annual/measure/Sedentary/state/U.S.
9) Ward, Z. J., Bleich, S. N., Cradock, A. L., Barrett, J. L., Giles, C. M., Flax, C., & Gortmaker, S. L. (2019). Projected
US state-level prevalence of adult obesity and severe obesity. New England Journal of Medicine, 381(25),
2440-2450.
10) Centers for Disease Control and Prevention. (2022b). Overweight and Obesity. Division of Nutrition, Physical
Activity, and Obesity, National Center for Chronic Disease Prevention and Health Promotion. Retrieved [April,
2022], from https://www.cdc.gov/obesity/basics/causes.html?CDC_AA_refVal=https%3A%2F%2Fwww.cdc.
gov%2Fobesity%2Fadult%2Fcauses.html
11) Centers for Disease Control and Prevention. (2019). Unfit to Serve. Division of Nutrition, Physical Activity, and
Obesity. Retrieved [April, 2022], from https://www.cdc.gov/physicalactivity/downloads/unfit-to-serve.pdf
12) Centers for Disease Control and Prevention, National Center for Health Statistics. National Vital Statistics
System, Mortality 1999-2020 on CDC WONDER Online Database, released in 2021. Data are from the Multiple
Cause of Death Files, 1999-2020, as compiled from data provided by the 57 vital statistics jurisdictions
through the Vital Statistics Cooperative Program. Accessed at http://wonder.cdc.gov/ucd-icd10.html
13)Oklahoma State Department of Health. (2020). Health Care Information. Center for Health Statistics.
Retrieved [April, 2022], from https://oklahoma.gov/health/data-and-statistics/center-for-health-statistics/
health-care-information.html
14) Lee SH, Moore LV, Park S, Harris DM, Blanck HM. Adults Meeting Fruit and Vegetable Intake
Recommendations — United States, 2019. MMWR Morb Mortal Wkly Rep 2022;71:1–9. DOI: http://dx.doi.
org/10.15585/mmwr.mm7101a1
28Health for a Lifetime | Obesity Prevention Plan
Oklahoma State Department of Health
REFERENCES
15) United States Department of Health and Human Services. (2018). Physical Activity Guidelines for Americans
2nd edition. Retrieved [April, 2022], from https://health.gov/sites/default/files/2019-09/Physical_Activity_
Guidelines_2nd_edition.pdf
16) U.S. Department of Health and Human Services. (n.d.) Social Determinants of Health. Healthy People 2030
https://health.gov/healthypeople/objectives-and-data/social-determinants-health
17) United States Department of Health and Human Services. (n.d.) Healthy People 2030 Framework. Healthy
People 2030. Retrieved [April, 2022], from https://health.gov/healthypeople/about/healthy-people-2030-
framework
18) Centers for Disease Control and Prevention. (2022). National Center for Chronic Disease Prevention and
Health Promotion (NCCDPHP). Retrieved [June, 2022], from https://www.cdc.gov/chronicdisease/programs-
impact/sdoh.htm
19) Feeding America. (2020). Map the Meal Gap 2020. Retrieved [April, 2022], from https://www.feedingamerica.
org/sites/default/files/2020-06/Map%20the%20Meal%20Gap%202020%20Combined%20Modules.pdf
20) Centers for Disease Control and Prevention. (2022a). Health Impact in 5 Years. Office of the Associate
Director for Policy and Strategy. Retrieved [April, 2022], from https://www.cdc.gov/policy/hst/hi5/index.html
This publication was issued by the Oklahoma State Department of Health (OSDH), an equal opportunity employer and provider. A digital file has
been deposited with the Publications Clearinghouse of the Oklahoma Department of Libraries in compliance with section 3-114 of Title 65 of the
Oklahoma Statutes and is available for download at www.documents.ok.gov. | Issued June 2022
29You can also read