Denialism, Politics and the Covid-19 pandemic in Brazil: an empirical analysis on observational data - DIAL
←
→
Page content transcription
If your browser does not render page correctly, please read the page content below

DOCUMENT DE TRAVAIL                                                                DT/2022-03

         Denialism, Politics and the
        Covid-19 pandemic in Brazil:
           an empirical analysis
           on observational data

Marta CASTILHO
Valéria PERO
Mireille RAZAFINDRAKOTO
François ROUBAUD
João SABOIA

                                              UMR LEDa
 Place du Maréchal de Lattre de Tassigny 75775 • Paris •Tél. (33) 01 44 05 45 42 • Fax (33) 01 44 05 45 45
        DIAL • 4, rue d’Enghien • 75010 Paris • Tél. (33) 01 53 24 14 50 • Fax (33) 01 53 24 14 51
                                E-mail : dial@dial.prd.fr • Site : dial.ird.fr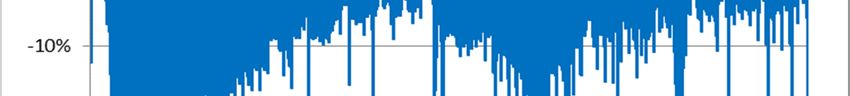
Denialism, Politics and the Covid-19 pandemic in Brazil:
                                an empirical analysis on observational data
       Marta Castilho*, Valéria Pero*, Mireille Razafindrakoto§ *, François Roubaud§ *, João Saboia*
                 * Instituto de Economia da Universidade Federal do Rio de Janeiro - Brazil
                           §
                             Institut de Recherche pour le Développement - France

Abstract
Brazil is among the countries most affected by Covid-19 in terms of number of confirmed cases and deaths. This
happens in a national context marked by a denialist positioning of the federal government in combating the pandemic.
This study examines, along with other socioeconomic, health and demographic factors, how the political orientation of
municipalities is related to the Covid-19 mortality rate. Using several sources of municipal data, a negative binomial
model is applied, contemplating the two waves of the pandemic. Subsequently, two other econometric models were
estimated in order to analyse two different transmission channels through which political factors impact on the Covid-
19 mortality rate: one associated with non-pharmacological measures to combat Covid-19 (the mobility of people) and
another associated with pharmacological measures (the vaccination). Among the factors analysed, the most striking
result concerns the ‘Bolsonaro effect’: the estimations show that mortality rates are higher in the municipalities where
the president had the most expressive vote in the 2018 elections. This relationship persists over time in the most recent
period. The results regarding population mobility confirm that this is one of the main transmission mechanisms of
Covid-19 fatalities. Indeed, the Bolsonaro’ score in the 2018 election is also shown to be significantly and positively
correlated with the population mobility in particular when the pandemic reached its most critical levels. Finally, the
denialist position at the top of the Federal Government does not seem to compromise the complete vaccination rate of
the population beyond the first months after the beginning of the campaign. This result suggests to some extent the
increasing awareness of the president's supporters of the risks involved and the effectiveness of vaccines against Covid-
19. But above all, it reflects apparently the success of the National Immunization Program in Brazil, based on a long
tradition, recognized at the international level.
Keywords: Brazil; Bolsonaro effect; Covid-19; Social distancing; Political Factors; Mobility; Mortality; Public Policies;
Socioeconomic Inequalities; Vaccination.
JEL Classification: I14, I18, I38, 017, P16, 054
Résumé
Le Brésil est un des pays les plus touchés par la Covid-19 que ce soit en termes de cas et de décès. Cette hécatombe
s’est déroulée dans un contexte où le gouvernement fédéral a adopté une attitude négationiste dans la lutte contre la
pandémie. Cet article se propose de voir dans quelle mesure l’orientation politique au niveau des municipalités joue sur
la mortalité due à la Covid-19, à côté d’autres facteurs socioéconomiques, démographiques et de santé. Un premier
modèle économétrique couvrant l’ensemble des deux vagues (2020-2021), elles-mêmes décomposées en sous-
périodes, et mobilisant de nombreuses sources de données, est estimé. Dans un second temps, deux autres modèles
visent à explorer deux principaux canaux de transmission (pharmaceutique et non pharmaceutique) à travers lesquels
les facteurs politiques sont susceptibles d’avoir joué sur la mortalité : la distanciation sociale et la vaccination. Le
principal résultat est la mise en évidence d’un ‘effet Bolsonaro’ : les estimations montrent que la mortalité croit avec les
scores du président aux élections de 2018, toutes choses égales d’ailleurs. Cette relation est robuste et persiste tout au
long de la pandémie, L‘effet Bolsonaro’ est également à l’œuvre sur la mobilité au quotidien. Plus les municipalités sont
favorables au président et moins la population a limité ses déplacements. Le non-respect du confinement prôné par le
président est un candidat privilégié pour expliquer la hausse de la mortalité. En revanche, nous n’identifions pas d‘effet
Bolsonaro’ sur la vaccination au-delà des quelques mois ayant suivi le début de la campagne. Ce résultat peut
s’expliquer par la prise de conscience des partisans du président des risques encourus et de l’efficacité des vaccins
contre la Covid-19. Mais il semble surtout témoigner de la longue tradition du Brésil dans ce domaine, reconnue à
l’échelle internationale, et de la marque du succès du Programme national de vaccination.
Mots-clés: Brésil; Covid-19 ; Distanciation sociale ; Effet Bolsonaro ; Facteurs politiques ; Inégalités socioéconomiques ;
Mobilité ; Mortalité ; Politiques publiques ; Vaccination.

                                                                                                                          1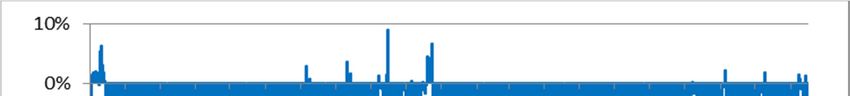
1. INTRODUCTION
The Covid-19 pandemic arrived in Brazil shortly after Carnival 2020. After the notification of a first
case in São Paulo on February 25th, the pandemic spread rapidly across capital cities. Measures to
prevent the spread of the virus were adopted from mid-March. But the number of cases exceeds the
first thousand on the last day of the month.
Although there are still many unknown aspects of the disease, its characteristics have made it clear
that in addition to health and demographic determinants (such as comorbidities, age, hospital
network, among others), socioeconomic characteristics also contributed to the incidence of the
Covid-19 and the occurrence of deaths (Razafindrakoto et al, 2021). Factors associated with
colour/race, housing and working conditions appear in several studies as determinants. In several
countries, non-whites were more affected by Covid-19 - in Brazil, Indians, browns and blacks were
more affected than whites. Working conditions - especially informality - may favour the incidence of
the disease due to the need to work face-to-face and to use precarious means of transport. Housing
conditions may facilitate contagion and make it difficult to apply containment measures and distance
between family members. The level of education is also related to incidence, which can be explained
by the level of information people have about the disease, but also by the possibility of teleworking.
In addition to these considerations, there is a growing perception that political factors may have an
impact on countries' performance in managing the pandemic. In fact, studies on this subject, applied
mainly to the United States and Brazil, associate population’s behaviour regarding the pandemic to
the governments’ discourse and action. These factors have influence on the perception of risk by
people, and then impact on the degree of compliance with the pandemic mitigation measures.
Previous studies have already shown that political leaders’ actions and discourses may influence
support for public policies as well as individuals behaviour in representative democracies (Ajzenman
et al., 2020). In the case of health policies in particular, Greer et al. (2021) state that the few existing
works before the outbreak of Covid-19 linked certain political regimes with long-term health
indicators such as infant mortality. In the USA, where the outbreak of the pandemic occurred at a
time of strong political polarization, several studies analysed the relationship between the political
profile of counties and the attitude of their respective population towards the pandemic. Barrios and
Hochberg (2020) show that interest in the pandemic and compliance with mobility restrictions are
lower in counties where Trump won in the 2016 presidential election. They draw attention to the fact
that for the same message, the interpretation can vary according to the source of the information
and/or the political affiliation of the people giving the information. For the USA, several other
studies confirm the difference in behaviour and risk perception according to ideological or partisan
orientation.1
Brazil, similarly to the USA, was hit by the pandemic in a context of political polarization, having at
the head of the federal government a president with a denialist posture,2 characterized by the
rejection of scientific evidence, by questioning the efficacy of lockdown measures in fighting the
pandemic. President Bolsonaro's first response was to downplay the seriousness of the virus,
referring to the disease as ‘little flu’ and discouraging social distancing and other measures adopted
by subnational (states and municipalities) governments (Razafindrakoto and Roubaud, 2021). His

1
 See, for example, Allcott et al (2021), and Kushner Gadarian, Goodman and Pepinsky (2020).
2
  Fonseca, Natrass and Bastos (2021) undertake a systematic analysis of the president's discourse throughout the
pandemic in order to study his denialist posture.

                                                                                                              2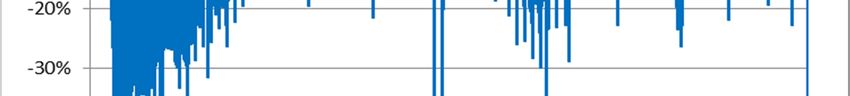
argument was that the economic consequences would be worse than the health effects. The Brazilian
federal government's actions in combating the pandemic were marked by the absence of coherent
policies and coordination between the various governmental entities. On the one hand, this resulted
in delays and disorganisation in the implementation of measures. On the other hand, the population
became confused: some people no longer understood or questioned the measures adopted by the
municipalities or the states. When analysing Bolsonaro's ‘negationist’ posture, Fonseca et al. (2021)
point out that subnational governments ended up taking the lead in fighting the pandemic crisis, not
without facing the president's resistance to their actions and initiatives. Nonetheless, the president's
denialism spread to other levels of government, in general, in states where governors are politically
aligned with the president (Touchton et al., 2021). As we will see below, the central government's
denialist stance seems, however, to have had less effect on Brazilians' decision to vaccinate, which
may be related to the success of the National Immunization Program (NIP) or to different attitudes of
voters who seek vaccination even to maintain the "freedom to come and go" so vaunted by the
president's supporters.
Various academic papers in political sciences and public health point out Bolsonaro responsibility in
the catastrophic management of the pandemic. Lasco (2020), comparing Bolsonaro, Duteurtre and
Trump responses to the outbreak of the pandemic, forged the concept of “medical populism”,
characterized by the following features: simplification of the pandemic by downplaying its impacts
or touting easy solutions or treatments, spectacularization of the responses to crisis, forging divisions
between the ‘people’ and dangerous ‘others’, and making medical knowledge claims to support the
above. Ortega and Orsini (2020) argue that the lack of public health governance can best be
described as governance without (central) government based on ‘strategic ignorance’. The role of
social media, misinformation and fake news is also key on this topic (Biancovilli, Macszin and
Jurberg, 2021; Calvo and Ventura, 2021; Gramacho et al., 2022; for or more general discussion at the
global level: De Angelis et al., 2021).

One of the pioneer works to analyse the influence of the President’s behaviour on the evolution of
the pandemic in Brazil was Argentieri Mariani et al. (2020). The authors perform an econometric
analysis of the Covid-19 contamination rate in municipalities where Bolsonaro won more than 50%
of the total votes in the first round of the 2018 election, comparing their situation before and after the
demonstrations of 15 March 2020.3 The authors show that the municipalities where the
demonstrations occurred recorded more hospitalizations and deaths than the others. The authors
believe that this effect is due both to people crowding into the demonstrations and to more "lax"
attitudes towards social distancing according to the rhetoric and position of the president.
Ajzenman et al. (2020) assess also to what extent the president's rhetoric, at the beginning of the
pandemic in 2020, impacted social distancing (measured by a mobility indicator calculated from
daily mobile phone information). The results show that in pro-Bolsonaro municipalities (identified
by 2018 election results), people's mobility consistently increases in the week following the
president's actions and speeches to minimise the impacts of the pandemic and discourage compliance
with social distancing. This effect is stronger in municipalities with a significant local media

3
 Pro-government demonstrations were held in 250 of the 1,050 municipalities that recorded at least one case of Covid-
19 before April 15, 2020.

                                                                                                                   3
presence, a large number of Twitter accounts and a high proportion of evangelicals (a significant
base of Bolsonaro’s support).
Rache et al. (2021) rely on a descriptive analysis to put forward a positive correlation between voting
for Bolsonaro and Covid-19 deaths during the first quarter of 2021. Xavier et al (2022) find a
positive relationship between political orientation - alignment with the president’s position - and
Covid-19 mortality, from municipal data, controlling for inequality, relationship between regions and
quality of health services.
Razafindrakoto et al. (2021) analyses a wide range of determinants of the incidence and number of
deaths of Covid-19, including the ‘Bolsonaro effect’, i.e., the political orientation, measured by the
result of the first round of the 2018 presidential election. The study adopts an approach by
municipalities, considering the multiple determinants of the disease (health, demographic and
socioeconomic), with a more rigorous treatment of the political factor, because the estimation of its
effect occurs controlling the influence of other factors. In line with the national and international
literature on the influence of the political aspect in the evolution of the pandemic, the ‘Bolsonaro
effect’ was one of the factors that proved to be more robust in explaining the pandemic.
This article is an extension of the work presented above and sheds additional light on the political
factors’ influence on the pandemic incidence in Brazil. It covers one and a half year of Covid-19,
allowing us to assess the extent to which explanatory factors have changed or not between May 2020
and October 2021. The analysis confirms that the political factor maintained its explanatory
importance in the different phases of the pandemic. More specifically, the ‘Bolsonaro effect’ resists
time and interaction with the other factors.
This study aims also at investigating the effectiveness of public policies and the mechanisms through
which political factors ultimately affect Covid-19 mortality rates. The main mitigation measures
adopted in the country, until the start of vaccination in 2021, were non-pharmacological (mask use
and social distancing, given that testing and other measures were almost non-existent). Therefore, the
analysis of people's mobility and its determinants can be interpreted as an indirect measure of the
effectiveness of the public policies adopted. Then, with the arrival of vaccines (pharmacological
means to combat the pandemic), we analyse the determinants of the vaccination rate by municipality
for more recent periods (from February to October 2021).
The next section sets the context in Brazil: the evolution of the pandemic and the main measures
adopted. The third section presents the methodology and the database used in the estimations.
Section 4 discusses the results and the last section concludes with some final considerations.

   2. THE BRAZILIAN CONTEXT

2.1 Covid-19 incidence, mobility and vaccination
Brazil is among the countries with the highest numbers of Covid-19 deaths, whether in absolute
terms or relative to its population. In absolute terms, only the US recorded (until October 2021) a
higher cumulative number of confirmed cases than Brazil (Table 1). Regarding the Covid-19
mortality rate, Brazil ranks eighth, behind Peru and six Eastern European countries. In terms of

                                                                                                     4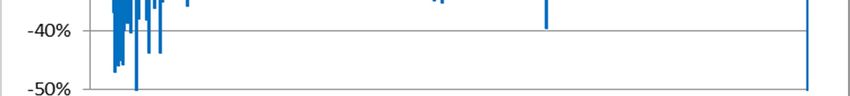
confirmed cases, underreporting4 - partly associated with low population testing - largely explains
the low incidence rate in some countries like in India in particular.
The evolution of the pandemic showed a first acute phase in the first semester of 2020, which lasted
for several months, followed by a deceleration between August and October (Figure 1). The
differentiated profile between the two curves is, in part, influenced by the underreporting that occurs
especially for the number of confirmed cases due to the extremely low volume of testing in the
country.

                 Table 1. International comparison of Covid-19 case, death, testing and vaccine statistics

                                                                                                                              Vaccination
                               Infection rate               Mortality rate                     Test rate       Vaccination
                 Confirmed                                                        Tests                                        complete        Population
                                (per million    Deaths      (per million                      (per million      complete
                   cases                                                     (in thousand)                                    Rate (% of     (in thousand)
                                   inhab)                     inhab.)                           inhab.)         (in 1,000)
                                                                                                                              population)

World            247 164 753           31 386   5 001 217              635             n.a.             n.a.      3 049 146           38,7       7 874 966
USA               46 007 342          138 195     747 189            2 244         628 319        1 887 325         191 679           57,6         332 915
Brazil            21 810 855          101 923     607 824            2 840             n.d.             n.d.        116 118           54,3         213 993
Índia             34 285 814           24 606     458 437              329         608 320              437         329 089           23,6       1 393 409
Mexico             3 807 211           29 227     288 365            2 214          10 895           83 637          60 566           46,5         130 262
Russia             8 377 984           57 418     234 194            1 605             n.d.             n.d.         47 602           32,6         145 912
Peru               2 201 796           66 002     200 246            6 003           5 934          177 884          15 694           47,0          33 359
Indonesia          4 244 358           15 358     143 405              519          31 236          113 026          73 699           26,7         276 362
United Kingdom     9 100 442          133 424     141 055            2 068         301 911        4 426 382          45 712           67,0          68 207
Italy              4 771 965           79 049     132 100            2 188         104 252        1 726 956          43 110           71,4          60 367
Colombia           5 002 387           97 577     127 281            2 483          26 752          521 834          21 399           41,7          51 266

Source: Our World in Data (https://ourworldindata.org/), extracted in 01/12/2021.
Notes: The table show the countries with the ten highest numbers of deaths. Figures are cumulative numbers until 31/10/2021.

In fact, the Brazilian ‘first wave’ took a little longer to accelerate, but it had a longer duration and the
number of confirmed cases and deaths never fell significantly. In the last months of 2020, the
number of cases and deaths rose again, but the acceleration regarding the so-called second wave
occurred from February, with a peak of infections and deaths in March and April 2021. The reached
levels in terms of daily new cases and deaths were much higher in the ‘second wave’ compared to
the ‘first wave’.5

4
  See Hallal et al. (2020). Under-reporting affects also death count, but in a much lesser extent. Brazil official data are
considered of relatively good quality. Modelling excess mortality for 2020 ad 2021, Wang et al. (2022) estimates the
under-reporting at 28%, one of the lowest rate in the world. Brazil still remains among the most affected country in the
world (5th rank). The last estimates provided by the WHO (2022) confirm this diagnosis. For the same period, the
underreporting is even lower (with 9.2%; Excess mortality vs Official data) and the correlation coefficient is 0.93.
5
  The number of daily deaths at the peak of the second wave was 150% higher than the corresponding figures in the
previous peak (4,148 deaths on 04/08/2021 compared to 1,595 deaths on 07/29/2020). These absolute figures must be
interpreted with caution since fluctuations may result from time lags in recording. However, globally the diagnostic hold
when we consider moving averages (see Figure 1).

                                                                                                                                                             5
Figure 1. Newly confirmed cases and daily deaths from Covid-19 in Brazil
90 000 3 500
80 000 3 000
70 000
2 500
Nb of deaths
60 000
New cases
50 000 2 000
40 000 1 500
30 000
1 000
20 000
10 000 500
- -
Casos novos por dia Obitos novos por dia
New cases per day Deaths per day
Source: Ministry of Health, Fiocruz. Authors' elaboration.
Note: Data considered are 7-day moving average of each variable.
Figure 2 reveals a sharp and massive drop in mobility in Brazil in March and April 2020. Then, a
gradual resumption of movements can be observed until reaching in August levels close to those of
February (pre-pandemic month). During the acceleration phase of the second wave, with the
implementation of social distancing measures by States and Municipalities plus the effect of the
reduction of economic activities, mobility decreased again.
Figure 2. Mobility of people (deviation compared to February 2020).
Note: Percentage difference of average mobility per municipality compared to February/2020.
Source: Facebook. Authors' elaboration.
The smaller drop in mobility in the second wave reflects the difficulty (observed also in
most Western countries) to impose restrictions similar to those adopted in the first months
of the pandemic. But it can be explained also by problems of coordination among different
levels of government and conflicts with the Federal Government. In addition, there was
delay in adopting measures to mitigate the economic impacts of Covid-19 on workers and
businesses.
62.2 Public policy to confront the pandemic
The main specificity of Brazil, regarding the management of the pandemic, has been President
Bolsonaro's attitude and speeches aimed at minimizing it, even denying its existence. This (anti)
health policy by default has used the full panoply of imaginable methods and rhetoric: denial,
conspiracy, contestation of scientific results, fake news, etc.6 The President has consistently denied
the seriousness of the pandemic and the effectiveness of the measures, whether pharmaceutical or
non-pharmaceutical, when the vaccines were developed. Table 2 shows some illustrative examples of
Bolsonaro denialist declarations over the period.
Table 2. Declarations by President Bolsonaro on denial of the pandemic
Death, confirmed cases Date
"Depois da facada, não vai ser uma gripezinha que vai me derrubar, não "; 03/2020
On the pandemic and "Pelo meu histórico de atleta, caso fosse contaminado pelo vírus, não precisaria me
the virus preocupar, nada sentiria ou seria acometido, quando muito, de uma gripezinha ou
resfriadinho, como bem disse aquele conhecido médico, daquela conhecida
televisão."
“está superdimensionado o poder destruidor desse vírus” 03/2020
“Muito do que tem ali é muito mais fantasia, a questão do coronavírus, que não é
isso tudo que a grande mídia propaga”
“Muitos pegarão isso independente dos cuidados que tomem , mas não podemos
entrar numa neurose, como se fosse o fim do mundo” 04/2020
"E daí? Lamento. Quer que eu faça o quê? Eu sou Messias, mas não faço milagre" 11/2020
“E agora tem essa conversinha de segunda onda” 12/2020
“Tudo agora é pandemia. Tem que acabar com esse negócio. Lamento os mortos,
todos nós vamos morrer um dia. Não adianta fugir disso, fugir da realidade, tem que
deixar de ser um país de maricas.”
03/2021
“Nós temos que enfrentar os nossos problemas, chega de frescura e de mimimi. Vão
ficar chorando até quando? Temos de enfrentar os problemas » ; “parece que só se
morre de Covid” no Brasil.
“Eu tive a melhor vacina: o vírus...” Sem efeito colateral”... 12/2021
Source: Various media. Authors' compilation.
The responsibility of policy measures to fight the pandemic in Brazil lies with different spheres of
government - municipal, state and federal. An effective action would require a convergence of the
visions of these three governmental bodies and, evidently, a coordination of the actions undertaken to
ensure complementarity and coherence.
However, the measures of social distancing were not only adopted in an uncoordinated way without
the support of the federal government, but they were also the target of attacks and criticism by the
president (Table 3). He even challenged them in court or encouraged events and demonstrations
against them.7 The actions of the two sub-national governments were often conflicting: in March
6
See the report “Boletim n°10, Direitos na Pandemia” établishd by Cepedisa (Centro de Estudos e Pesquisas de Direito
Sanitário - USP) in partnership with Conectas Direitos Humanos, January 2021.
7
Ajzenman et al. (2020), cited in the introduction, analyse the effects on the pandemic of early demonstrations of support
for the president.
72020, all states closed their schools and at least part of non-essential businesses, but the reopening of
the economy took place according to local plans (at the municipality level) with different measures
and timelines.8 The performance of local plans and the success of non-pharmacological interventions
were further undermined by the absence of an adequate testing and screening policy (Benitez et al.,
2020; Moraes, Silva and Toscano, 2020).
On the part of the Ministry of Health, the non-pharmacological measures were treated differently
according to the ministers who occupied the portfolio - 4 different ministers were in charge of the
Ministry of Health during the studied period. While the first health minister to face the pandemic
(Luiz Mandetta) tried to articulate the actions of different government bodies (hospitalization,
distancing, personal protective equipment, etc.), the minister who was in charge of the portfolio for
the longest time (Colonel Pazuello) did not encourage non-pharmacological measures, such as
distancing and use of masks. On the contrary - and in consonance with the speech of the President of
the Republic - he did not invest in awareness campaigns and stimulated the use of medicines and
treatments whose efficacy is contested by scientists.
Table 3. Declarations by the President Bolsonaro on non pharmaceutical measures
Non pharmaceutical measures: Lockdown, social distancing, masks
Social distancing “Muitos pegarão isso independente dos cuidados que tomem" ;
“A vida continua, não tem que ter histeria. Não é porque tem uma aglomeração de 03/2020
pessoas aqui e acolá esporadicamente [que] tem que ser atacado exatamente isso"
Masks wearing
eficácia quase nenhuma
“Vocês não pararam durante a pandemia. Vocês não entraram na conversinha mole 10/2020
Lockdown de ‘fica em casa’. Isso é para os fracos.”
"Sabia que o tio estava na praia nadando de máscara? Mergulhei de máscara também,
12/2020
Masks wearing para não pegar Covid nos peixinhos"
02/2021
Masks wearing “Começam a aparecer os efeitos colaterais das máscaras”
“Tem uns idiotas aí, o 'fique em casa'. Tem alguns idiotas que até hoje ficam em
Lockdown casa"
Lockdown "Eu tenho o poder de, numa canetada, fazer um lockdown no Brasil todo, mas isso 04/2021
não será feito."
Source: Various media; Authors' compilation.
In terms of vaccines, the government's actions reproduced the problems faced on other fronts in the
fight against Covid-19. They were characterized by negative campaigns, lack of coordination and
lack of transparency and lack of willingness to rely on science (Table 4).9 The vaccines procurement
8
Moraes, Silva and Toscano (2020) discuss the wide diversity of these plans in terms of format, technical criteria and
transparency, as well as the number of municipalities that adhere to the state plan.
9
Given the posture of the Federal Government and the suspected flaws in the handling of the Covid-19 pandemic, a
parliamentary committee of investigation (CPI) was established in April 2021 in order to investigate the federal
governement responsability on the spread of the pandemic in the country and, in particular, the worsening of the health
crisis in Amazonas.” . In October 2021, the CPI delivered its report. Bolsonaro was “proven to be primarily responsible
for the mistakes made by the federal government during the Covid-19 pandemic “ (Senado Federal, 2021). He was found
guilty of nine charges, among which crime of prevarication, charlatinism, and above all crime against humanity.
Paradoxically, his popularity was not significantly affected by this judgment.
8was late and insufficient. Besides, it has involved controversies and disputes with governors and
mayors of various regions. According to some epidemiologists, this is one of the explanatory factors
of the occurrence of the second wave. But, despite the late start and repeated problems with vaccine
supply (as attested by the low vaccination rate in October 2021; Table 1), the vaccination rate has
increased relatively rapidly in Brazil. This is due to the prior existence of a comprehensive primary
healthcare system (SUS) and a well-established immunisation programme (Bernardeau-Serra et al.,
2021). Indeed, the National Immunization Program (NIP), created in 1973, is noted as one of the
most successful immunization programs in the world, with remarkable vaccination capacity in terms
of geographical coverage and agility, having already proven capable of curbing other epidemics
(Fonseca et al., 2021).
Table 4. Declarations by President Bolsonaro on pharmaceutical measures
Pharmaceutical measures: vaccination, other medications
Chloroquine “Toma quem quiser, quem não quiser, não toma. Quem é de direita toma 05/2020
cloroquina. Quem é de esquerda toma Tubaína.”
Purchase of vaccine by :“Mandei cancelar, o presidente sou eu, não abro mão da minha autoridade” 10/2020
the Ministry of Health
Morte, invalidez, anomalia. Esta é a vacina que o Doria queria obrigar todos os 11/2020
Vaccination
paulistanos a tomá-la"
"O presidente disse que a vacina jamais poderia ser obrigatória. Mais uma que Jair
Vaccination 12/2020
Bolsonaro ganha."
“Se tomar e virar um jacaré é problema seu. Se virar um super-homem, se nascer 01/2021
Vaccination
barba em mulher ou homem falar fino, ela [Pfizer] não tem nada com isso”
“Isso é um abuso o que está acontecendo. Uma forma de blindar a Covid é a vitamina 03/2021
Vaccination
D. Então, você pega sol”
“Não há nada comprovado cientificamente sobre essa vacina aí” 04/2021
« canalha é aquele que é contra o tratamento precoce é não apresenta alternativa. Esse é um 05/2021
Chloroquine canalha »
Chloroquine “Tem idiota que a gente vê nas mídias sociais, na imprensa, né?... Vai comprar
vacina. Só se for na casa da sua mãe.” 10/2021
“Fui acometido de Covid. Procurei não me apavorar. Tomei um medicamento que
Chloroquine todo mundo sabe qual foi e no outro dia estava bom."
Vaccination "Defendi que os médicos brasileiros tivessem autonomia para receitar os remédios, 01/2022
uma decisão que pode ter salvado a vida de muitas pessoas"
Vaccination "vacinados [contra a Covid] estão desenvolvendo a síndrome da
imunodeficiência adquirida [Aids]"
(Ministério da Saúde) : não há demonstração de efetividade da vacina "em estudos
controlados e randomizados" nem de segurança "em estudos experimentais e
observacionais adequados"
Souces: various media; Authors’ compilation.
The federal government's actions were based primarily on two sets of emergency economic policy
measures to address the negative effects of the pandemic (Silva, 2020): i) fiscal measures to ensure
household income, support businesses and provide financial assistance to states and municipalities;
and ii) liquidity support and regulatory capital measures to ensure the stability of the financial system
and expand the supply of credit.10 Regarding measures to mitigate income loss (notably the
10
For this point, see Martins et al. (2020).
9Emergency Aid and the Emergency Benefit for Preservation of Employment and Income), despite
initial hesitation to adopt them in the two "waves" 11 and the concern with the fiscal issue, the actions
of the federal government were effective, having contributed to minimize, at least temporarily, the
impacts of the pandemic on the population and on the economy.
The Emergency Aid (Auxilio Emergencial, AE) was the main income guarantee mechanism for
workers, targeting informal workers in vulnerable situation.12 The value in the first 3 months
corresponded to about 60% of the minimum wage, a value that was halved in the last 4 months of
2020. The initial value resulted from a strong campaign by civil society and intense pressure from
Congress, forcing the federal government to introduce an emergency basic income with a value
equivalent to the triple initially proposed by the government. In 2021, the renewal of the programme
by the federal government faced strong resistance within the government itself. It ended up being
relaunched with a lower amount and directed only to the 2020 beneficiaries, without including
people who started to meet the criteria after mid-2020.
For formal workers, the Brazilian government launched an income guarantee programme in the form
of an Emergency Benefit for the Preservation of Employment and Income (BEM). Within this
programme, the federal government supplemented workers' wages proportionally to the reduction in
working hours they had to face. This benefit was extended until December 2020 and relaunched
again in April 2021, at the time of the second wave of the pandemic.
These two measures to guarantee income for workers were even more relevant given the situation in
the labour market, which has already suffered from the low dynamism in 2019. In the first months of
the pandemic, unemployment rate has not increased much, but an important share of workers exit
from the labour force, mainly from the informal sector, due to the restrictions of circulation in the
streets. The relaxation of social distancing measures brought, from mid-2020 onwards, a slight
economic recovery and the return of part of the workforce. However, perhaps the most notable
labour market figure in the first six months of the pandemic was the loss of 12 million jobs, reducing
the number of employed people from 94 to 82 million (Razafindrakoto and Roubaud, 2021).
In terms of income, the two aid programmes (AE and BEM) were successful in protecting the
income of low-income workers, despite programme design and implementation problems.13 On the
one hand, AE contributed to a significant reduction in poverty and inequality for a few months in
2020 (Neri, 2020). On the other, however, income inequality increased, since most of the jobs
destroyed were among those with lower pay - informal or not (Carvalho, 2020; Pero, Carusi and
Fontes, 2020).
11
The federal government has playdowned at different times the numbers of cases and the pandemic consequences, and
ultimately delayed or restricted the application of support measures. See, for example,
https://www1.folha.uol.com.br/mercado/2020/11/chance-de-nova-onda-de-covid-e-baixissima-diz-secretario-de-
guedes.shtml.
12
This aid is basically aimed at informal workers in vulnerable situation and is also accompanied by the extension of the
Bolsa Família Programme to another 1.2 million families. The target population is people aged 18 or over who meet the
following criteria : with total monthly per capita family income less than half minimum wage or total family income less
than 3 minimum wages; who did not receive any other social benefit (except Bolsa Família); with no formal employment
contract and taxable income which do not exceed R$28.560 in 2018.
13
By way of illustration, as of August 31, 2020, 67.2 million people benefited from the AE. Regarding the BEM, on July
31, 2020, 12.4 million work contracts had been signed within the program.
10The central government also introduced a Financial Assistance for States, Municipalities and the
Federal District, as subnational governments were hit hard by the combination of sharp falls in
revenue collection and increases in spending on hospitals and social security (Silva, 2020).
Despite the coverage of the SUS and its resilience in the face of low investments in recent years,14
the conditions for coping with the pandemic differed widely among the regions. Given the lack of
centralized coordination of actions and distribution of resources, the pandemic have spread in a
differentiated manner across regions. Spatial disparities in income and resources between the various
Brazilian regions, as well as between the countryside and the city, is well known and is also reflected
in the unequal supply of medical resources across the national territory (Hallal et al., 2020; Rocha et
al., 2021). In fact, given the differences in income of individuals, housing and working conditions,
hospital resources and even productive structure, it should not be expected that regions would be
affected in the same way by Covid-19.
3. DATA AND EMPIRICAL STRATEGY
The empirical analysis is based, first, on estimates of the relationship between political and
socioeconomic factors and the Covid-19 mortality rate. Second, we estimate also the relationship
between these factors and two possible transmission channels: the degree of confinement and the
vaccination rate of the population. The objective is to find out if the political factor is related to the
degree of mobility/movement of people on the streets and to the vaccination rate, thus influencing
the mortality rate. These estimates will be made for the period May 2020 to October 2021,15
capturing the two waves of the epidemic in Brazil.
The unit of analysis is the municipality. Information was collected and structured from various
sources for the 5,570 municipalities in Brazil. It is the smallest administrative entity for which
Covid-19 data are available for the whole country. Moreover, it allows capturing effects of collective
(or neighbourhood behaviour) and individual behaviour. Indeed, the estimated models consider a
broad spectrum of explanatory factors, aiming to be as exhaustive as possible about the types of
potential variables that can have a direct or indirect effect on the mortality rate. Finally, due to the
lack of coordination at the central level on Covid-19 policies, responsibilities for pharmacological
and non-pharmacological measures fell more heavily on states and municipalities, generating
different policy responses, with varying consequences on the death rate. For these three reasons, the
municipal approach is suitable and presents advantages.
However, this type of approach has its limitations and the results should be interpreted with due
caution. First, the analysis by municipalities cannot be interpreted in terms of individual risks. But at
least we know that a significant effect at the municipal level tends to be significant in terms of
individual probabilities. We can assume, then, that the individual and municipal approaches
generally converge in terms of signs. Second, the econometric models tested here can be used to
estimate the relationships between the mortality rate and different factors, corrected for structural
effects. However, as in most analyses of observational data, we identify correlations that do not
necessarily point to causality. For example, it is quite plausible that restriction measures were applied
more strictly in municipalities where mortality rates were already higher. It is therefore difficult to
14
For more details on the national coverage and configuration of the SUS, see Paim et. al. (2011) and Benitz et al.
(2020).
15
The first three months (February-April 2020) were excluded of the analysis because the number of observations was
too low.
11disentangle the actual impact of the restriction measures. Finally, the main problem may result from
potentially omitted variables, such as data on comorbidities, scope of non-pharmaceutical measures
(mask use, social distancing measures, etc.), among others. These different variables may be
correlated with other characteristics of the municipality (geographical location, income level, health
infrastructure, etc.) and, therefore, the correlation we observed in our model may be influenced by
these omitted variables.
But, although we do not identify actual causal relationships, the multiple regression framework we
adopted, considering information on all Brazilian municipalities, can help policymakers better
understand whether or not there is a conditional correlation of political and socioeconomic factors
with the Covid-19 mortality rate. This helps, at least, to rule out certain hypotheses about potential
causal mechanisms.
The mortality rate is modelled to identify the characteristics of municipalities affected by the
pandemic and the changes in patterns between May 2020 and October 2021.16 Considering the non-
normality of the data on number of deaths and the overdispersion of count data, the parameters are
estimated by a negative binomial (NB) model17 using the maximum likelihood method.
The model is applied in 6 quarters, characterised by different phases of the pandemic: the first wave
running from May to October 2020 and the second wave from November 2020 to October 2021.
• Q1 (May to July 2020): first wave - growth phase;
• Q2 (August to October 2020): first wave - deceleration phase;
• Q3 (November 2020 to January 2021): second wave (stability and beginning of a
growth phase at the end);
• Q4 (February to April 2021): second wave - growth phase
• Q5 (May to July 2021): second wave - start of deceleration and vaccination
• Q6 (August to October 2021): second wave - deceleration phase and increased
vaccination coverage with the 2nd dose.
The specification of the Covid-19 mortality rate models are as follows:
= ( + + + + ) (1)
Where:
represents the dependent variable - mortality rate (per 100,000 inhabitants in municipality i).
is the vector of variables of interest related to policy measures or political factors.
is the vector of socio-economic and health characteristics.
is the vector of direct transmission factors at the municipal level, arising from characteristics and
place of residence.
is the error term.
To analyse the results, we considered three groups of explanatory variables. The first group
includes the variables of interest, referring to political factors and implemented policies: i) the
percentage of votes for President Bolsonaro in the 1st round of the 2018 elections per municipality
16
It is worth mentioning that in the present paper the mortality rate was privileged in relation to the incidence rate
(number of confirmed cases) due to possible problems resulting from low testing and underreporting of cases. Hallal et
al. (2020) estimate that the underreporting of Covid-19 cases reached 70% in the first semester of 2020.
17
This model was also estimated in OLS specification, obtaining similar results and with the same order of magnitude.
12and ii) the vaccination rate (applied for the estimations in recent periods). The percentage of voters
intends to capture what we call the ‘Bolsonaro effect’, which reflects the portion of the population
that is aligned with the president's negationist stance. This population ends up adopting postures with
deleterious collective health effects, by not wearing masks or not respecting the confinement
measures, and also inhibits or disrupts the adoption of more restrictive measures by local
governments, which, as explained before, became the main responsible for the implementation of
policies to combat the pandemic. We also consider as a policy measure the municipal differences in
vaccination rates in the fight against Covid-19, both in the application of the 1st dose and the full
vaccination with the 2nd dose. It should be noted here that the introduction of the vaccination rate
may entails a reverse causality problem in model 1. Vaccination started in municipalities with higher
mortality rates, as was the case of Manaus. However, when we consider the 2nd dose of the vaccine,
controlling for the 1st dose is a way to purge the effect of one direction of the causality: from
mortality rate to the number of vaccines.
We could have considered also the mobility/confinement variable in the model specification.
However, we did not take it into account for two reasons. Firstly, this variable would have absorbed
at least part of the effect of the demographic characteristics or political factors we are trying to
measure. Indeed, as already stressed, mobility is potentially a channel or intermediate variable
through which the effect of the primary variables passes. And contrarily to the vaccination which
appears only in the three last quarters (variables effects without vaccination can then be captured
before), confinement have an influence since the beginning. Second, we face a reverse causality
issue. Mortality rate also influences the decision to stay at home, but in this case, there is no way to
control for it.
The second group is composed of control variables referring to the demographic and health
characteristics of individuals (gender, age, race, education and health status represented by life
expectancy and number of doctors per 100,000 inhabitants), socioeconomic (poverty rate measured
by the number of Emergency Aid (EA) beneficiaries in relation to the population, GDP per capita
and labour informality).
The third group comprises the factors related to the characteristics of the household dwelling and
location that may accelerate or reduce the transmission of the disease in the municipality: territorial
(population density, urban/rural location, living in slums and number of residents per room). In
addition to these classic variables, we also included an indicator of commuting and migration,
potential factors of virus dissemination.
We then devised an empirical strategy to relate these socio-political factors to two key transmission
mechanisms: (i) the degree of population confinement, which reflect of the adoption of and respect
for non-pharmacological measures, and (ii) the vaccination rate, a pharmacological measure to
control the disease. Our objective is to check if the effects observed for Covid-19 mortality rates in
the previous estimations are observed also for these two variables. It would indicate - at least for a
part of them - that non respect for social isolation measures and/or differences in vaccination rates
per municipality would be at the origin of deaths.
Considering people's commuting/mobility, the parameters were estimated from the ordinary least
squares (OLS) method for the equation specified below.
= + + + + (2)
13represents the average number of displacements per month relative to February 2020 (before the
pandemic) per municipality. The independent variables are defined similarly to specification (1) and
estimates were made for the same analysis periods.
Finally, we analysed the vaccination rate, as a way to measure the relationship between socio-
political factors and vaccination. To this end, we estimated a negative binomial model for the
socioeconomic determinants of the vaccination rate (percentage of vaccinated people in relation to
the population of the municipality). Model 3 regresses the vaccination rate of the 1st and 2nd dose by
municipality ( ) with the same explanatory variables as in the previous models:
= exp( + + + + ) (3)
As the start of vaccination occurred in January 2021 with very few cases, we ran model 3 from May
to October 2021. To better understand the behaviour over the period, estimates were made for the
quarters from February 2021 for first dose (Q4, Q5 and Q6) and from May for second dose of the
vaccine (Q5 and Q6).18
The data used come from various sources: demographic census, survey data, administrative records
and big data. Data on Covid-19 deaths and vaccination come from the multi-institutional programme
of the Ministry of Health. Organising and concatenating the independent variables involved
processing tens of millions of observations. We also used a dataset on non-pharmaceutical
interventions in Brazilian municipalities with Facebook Movement Range Maps to calculate the
indicator of confinement at the municipal level.19
4. RESULTS AND DISCUSSION
4.1. Mortality
Table 2 presents the estimated coefficient of model (1) for Covid-19 mortality rate in each quarter in
the period from May 2020 to October 2021, seeking to identify the main explanatory factors and
temporal patterns of the pandemic, allowing analysis of changes in the patterns of Covid-19
mortality rates over time.
We first analyse the coefficients of voting for Bolsonaro and then examine the other independent
factors, with emphasis on the significant ones. As highlighted in bold in Table 2 we focus on three
main variables, which results are more robust.
Voting for Bolsonaro. A noteworthy finding is that municipalities with a higher proportion of
Bolsonaro voters maintain a higher probability of higher Covid-19 mortality rates throughout the
period. The ‘Bolsonaro effect’ persists over time with positive and significant coefficients. As
previously commented, the affinity of the voters with the discourse of the president can influence the
infection rate in several ways. The little adherence of his voters to the distancing measures
(investigated below) has individual and collective effects on the mortality rate. Besides, it has
dissuasive effects on the local governors who are in charge of the implementation of the social
distancing measures.20 Our results converge and extend those found in other studies based on quasi-
18
It is worth saying that the number of observations in the first period considered for vaccination analysis is very small.
19
The definition of the variables of analysis and the data sources can be seen in Appendix Table A.1.
20
Touchton et al (2021) shows, in a survey of the implementation of non-pharmacological measures in the 27 states, that
governors' performance differed in terms of speed of response and restriction of measures depending on their political
alignment with the president.
14experimental approaches (Argentieri Mariani et al., 2020; Ajzenman et al., 2020) conducted in the
early stages of the pandemic. Moreover, they point to the fact that this effect remains despite
observed changes in other determinants of Covid-19 mortality over time, in line with the analyses
undertaken by Rache et al (2021) and Xavier et al. (2022).
Table 2. Evolution of factors associated with the Covid-19 mortality rate
Cumulative
Q1 Q2 Q3 Q4 Q5 Q6
data
Fev20-
Mai-July 2020 Aug-Oct 2020 Nov-Jan 2021 Fev-Apr 2021 May-Jul 2021 Aug-Oct 2021
Oct2021
Vote for Bolsonaro 0.836**** 1.370**** 1.242**** 1.108**** 0.615**** 0.436**** 1.302****
Poverty (AE) 2.123**** 2.287**** 2.957**** 2.142**** 1.640**** 2.169**** 1.993***
Age (log) 2.013**** 1.585*** 2.329**** 0.978** 1.980**** 2.524**** 1.595***
**** *** *** ****
Race (White) 0.0855 -0.762 -0.530 0.454 0.535 0.152 -0.521***
Sex (Male) -1.918*** -0.245 -0.446 -7.682**** -2.806** -2.171* 8.549****
Higher education 1.251 **
1 570 1 368 1 882 1 458 1 493 2 489
GDP/cap (log) 0.156**** 0.307**** 0.106** -0.0419 0.201**** 0.200**** -0.0238
Life Expectancy (log) 1.266**** -4.335**** 0.0851 1 473 0.394 1.597*** 8.562****
Nb. Doctors(/100k h) -0.00001 -0.00118 0.149 0.109 0.158 -0.217 -0.114
Density (log) -0.0228**** 0.154**** 0.0313 -0.152**** -0.0647**** -0.0166 -0.0346
**** **** **** ****
Area (Rural) -0.545 ****
-0.581 -0.699 -0.171 -0.353 -0.664 -0.703****
*** **** ****
Migration 0.411 ****
0.151 0.175 0.494 0.880 0.353 -0.142
**
Commuting 0.162 **
0.735 0.384 0.0939 0.165 0.128 0.375
Overcrowding 0.624**** 2.520**** 0.512** -0.128 0.746**** 0.178 -0.743***
Favela 0.507*** 2.056**** -0.0868 1.861**** 0.998*** -0.995**** -1.441***
**
Informal worker -0.0162 0.967 0.170 -0.245 0.0275 -0.367 -0.191
Vaccin. rate 1st dose 0.00392 0.00177 0.00907***
Vaccin. rate 2nd dose -0.00901*** -0.00695**
Constante -8.165**** 12.58** -6 922 -3 096 -5.712* -12.70**** -44.44****
/
Lnalpha -1.614**** 0.968**** 0.610**** 0.528**** -0.150**** -0.349**** 0.835****
N 5269 5269 5269 5269 5269 5228 5228
pseudo R2 0.040 0.014 0.007 0.010 0.018 0.021 0.020
AIC 62116.5 38519.0 42345.7 43445.2 53948.2 52849.3 38719.6
Sources: Ministry of Health, IBGE, TSE; authors’ calculations.
*
p < 0.10, ** p < 0.05, *** p < 0.01, **** p < 0.001
Note: Negative Binomial (NB) model.
Analysing the vaccination rate, we found a positive and significant coefficient for the first dose,
indicating that municipalities with higher rates of vaccination are those with higher mortality rates.
This reflects the fact that more persons are vaccinated where it is most needed. As regards the 2nd
dose of vaccination, the coefficient is negative and significant. Therefore, municipalities with a
higher percentage of the population with the 2nd dose are those with a lower Covid-19 mortality rate.
The complete vaccination scheme is negatively correlated with the mortality rate, suggesting its
already proven efficiency in combating the disease.
15Poverty. The higher the municipality's poverty rate, the more it is affected in terms of Covid-19
mortality. This effect is positive and significant for all the quarters analysed, but decreases over time.
This result is consistent with a growing number of studies in other countries (Brandily et al., 2021). It
is worth noting that the measure used for poverty consists of the percentage of the municipality's
population that was deemed eligible for Emergency Relief in 2020. So this variable is an updated
indicator of structural poverty which captures pre-Covid-19 social conditions.
GDP per capita variable has positive coefficients in the four periods where they are significant.
Richer municipalities were more affected by Covid-19 in terms of mortality rate. In fact, the
epidemic started in big cities (with the first cases registered in São Paulo) and spread faster in these
cities due to the intensity of social interactions (exchanges, population movements, diversity of
economic and social activities). Thus, as the poverty effect holds when controlling for GDP per
capita, our results suggest that the greater the inequalities in municipalities, the higher the mortality
rates.
Age. As expected, the variable age appears as a prominent explanatory factor for the Covid-19
mortality. Municipalities where the age profile of the population is older are, on average, more
affected in terms of Covid-19 deaths. Another variable with an expected result is Rural Area, for
which the coefficients always had the same negative sign and were significant in five periods. This
result indicates that municipalities with a higher proportion of residents in rural areas were less
affected.
Four variables deserve attention for presenting changes of sign or significance between the two
waves: Race, Life expectancy, density and favela population.
Race presents significant and negative coefficients in the first wave, indicating that municipalities
with a higher percentage of blacks have higher Covid-19 mortality rates. The coefficients became
positive in the following quarters, indicating that if at the beginning municipalities with a higher
percentage of whites had a lower probability of Covid-19 mortality, at the end of the period the
probability of death is greater for municipalities with a greater share of whites. This is a relevant
result because much of the existing work - especially those referring to 2020 and the first waves in
different countries - point to a significant race difference, with non-white populations being more
affected by the disease. The fact that the second wave was more intense in the Southern region,
where a large portion of the population is white, may explain to some extent this reversal over time.
It is worth noting that in the last period, with vaccination underway, the sign becomes negative and
significant again.
Life expectancy. At the beginning of the pandemic, municipalities with lower life expectancy are
more affected by Covid-19 mortality. It turns non-significant in the following quarters, and
significant and positive again at the end of the period. This may indicate that at the beginning, the
pandemic reached more the more fragile municipalities (in terms of health conditions) before
affecting mainly the less fragile in the second wave.
The municipalities with high population density were also more affected by Covid-19 during the
first wave. Then we observe a reversal of sign at the beginning of the second wave with a coefficient
which is no more significant afterwards. The evolution of this variable may reflect the evolution of
the pandemic. First, it has affected more strongly urban municipalities and cities with higher
population density before spreading throughout Brazil.
A higher proportion of people living in slums (favelas) in the municipality leads to more fatalities, in
line with the fact that it is more difficult to control the disease in these communities. However, the
16You can also read