Deloitte Kenya Budget 2022/23 Webinar - Accelerating growth in uncertain times April 2022
←
→
Page content transcription
If your browser does not render page correctly, please read the page content below
Deloitte Kenya
Budget 2022/23 Webinar
Accelerating growth in uncertain times
April 2022

Kenya National Budget 2022/23

       Program

0900        Opening Remarks:
            Joe Eshun

0910        Emerging Markets Outlook: Managing Director, Emerging Markets & Africa, Deloitte Africa
            Dr. Martyn Davies

0930        Economic Outlook: Deloitte East Africa Financial Advisory Leader
            Gladys Makumi

0945        Budget Overview & Direct Tax Measures: Deloitte East Africa Tax & Legal Leader
            Fredrick Omondi

1000        Indirect Tax Measures: Deloitte East Africa Indirect Tax Partner
            Lilian Kubebea

1010        Panel Discussion: Facilitator – Deloitte East Africa Risk Advisory Leader
            Julie Nyang’aya

1110        Questions & Answers

1130        Closing Remarks
            Anne Muraya

                                                                                                      Accelerating Growth in Uncertain Times
                                                                                                                                               2
Welcome & Introduction
Joe Eshun

                         3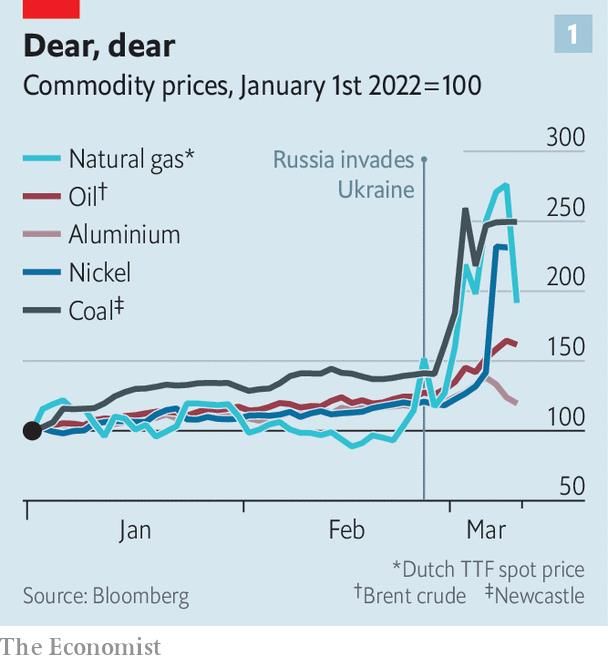
Kenya National Budget 2022/23

Accelerating Growth in Uncertain Times
                                         4
Kenya National Budget 2022/23

“
    What ramifications will our geopolitical
    environment (elections, COVID and the
    Ukraine-Russia war) continue to have
    on the Kenyan economy?

    How do we strike a balance between
    stimulating the economy, but also
    achieving fiscal sustainability?

                        Accelerating Growth in Uncertain Times
                                                                 5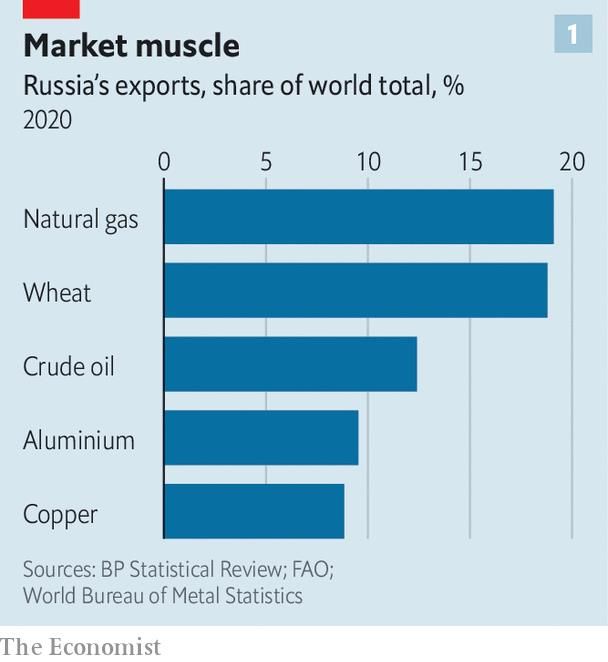
Emerging Market Outlook
Dr Martyn Davies, Managing Director, Emerging Markets, Deloitte

                                                                  6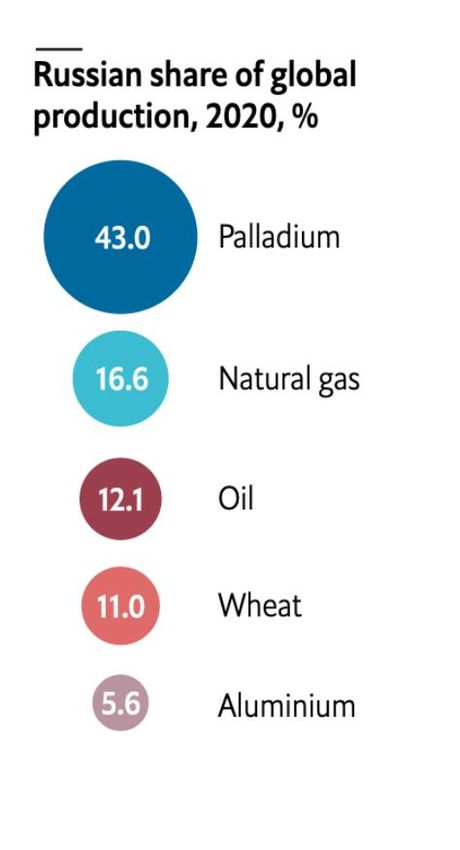
Kenya National Budget 2022/23

                      Macro Outlook
                    1. The baby bust (but not for Africa)

Due to relatively low fertility rates, the populations of Europe, North America, East/South-East Asia and Latin America are expected to stagnate or
even decline. In contrast, Africa’s high fertility rate will drive population growth on the continent and globally. It is expected that by 2050, about 1
in 4 people will live in Africa. Capital will increasingly seek investment opportunities in infrastructure to support Africa’s population growth.

Source: FT, The Guardian                                                                                                    Accelerating Growth in Uncertain Times
                                                                                                                                                                     7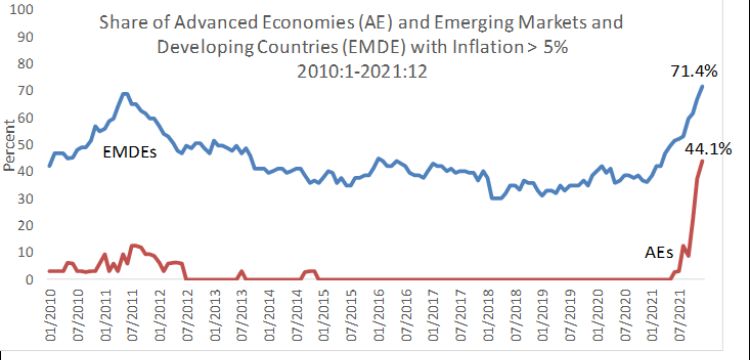
Kenya National Budget 2022/23

             Macro Outlook
             2. Peak China?
While China accounted for about one-third of global growth prior to the pandemic, China’s contribution to growth has slowed to one-quarter.
The country’s zero-Covid strategy and recent surge in cases may impact on China’s growth. Due a move away from trade towards self-reliance,
China is loosening its ties to other countries, notably seen in the decoupling of growth in China and other emerging markets.

Source: FT
                                                                                                                  Accelerating Growth in Uncertain Times
                                                                                                                                                           8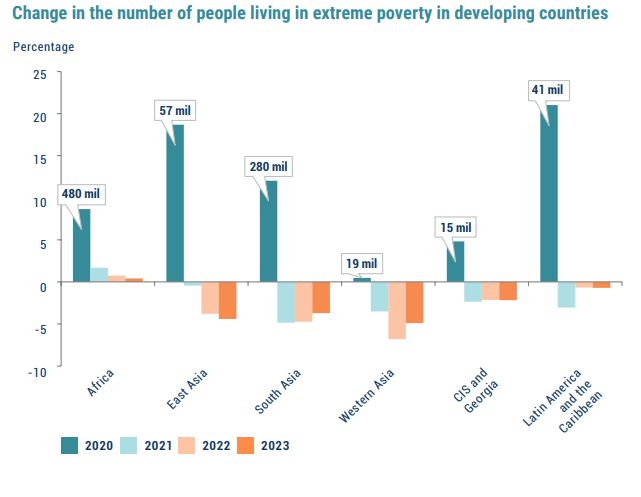
Kenya National Budget 2022/23

              Macro Outlook
              3. Debt trap
     During the pandemic, global debt levels saw a major uptick, driven by government borrowing. China and the US are among the 25 countries that
     have total debt above 300% of GDP – back in the mid-1990s no country had such high debt levels. These rising debt levels are likely to push many
     central banks to tighten their monetary policies. The IMF has warned about an emerging market debt crisis as capital outflows are expected to
     intensify due to potential interest rate hikes in major economies including the US.

                                                                                    General government gross debt (% of GDP),
                                                                                                  2010 & 2021

                                                                           Japan                                                                  256.9
                                                                                                                                   205.7
                                                                            Italy                                          154.8
                                                                                                                   119.2
                                                                              US                                      133.3
                                                                                                            95.1
                                                                              UK                               108.5
                                                                                                       74.3
                                                                            India                           90.6
                                                                                                     66.4
                                                                           Brazil                           90.6
                                                                                                    63.0
                                                                       Germany                         72.5
                                                                                                         82.5
                                                                           China                      68.9
                                                                                            33.9
                                                                     South Africa                    68.8
                                                                                            31.2
                                                                         Nigeria             35.7
                                                                                      9.4
                                                                    Saudi Arabia           29.7
                                                                                      8.4
                                                                          Russia        17.9
                                                                                      10.1
                                                                                                                                                       2021
                                                                                                                                                       2010

Source: IMF                                                                                                                         Accelerating Growth in Uncertain Times
                                                                                                                                                                             9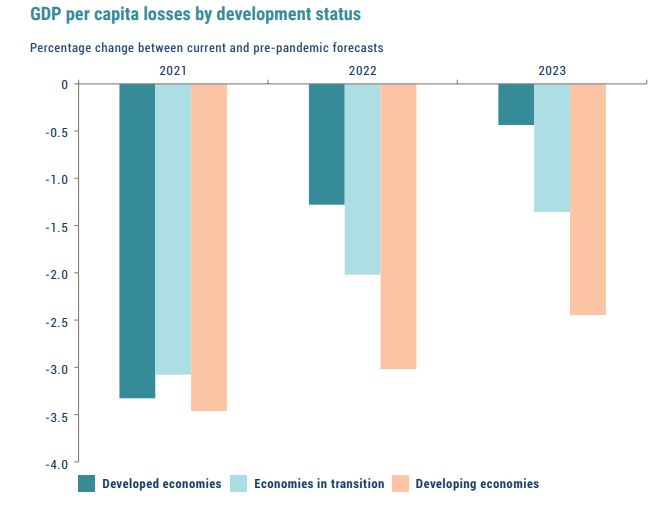
Kenya National Budget 2022/23

                              Macro Outlook
                        4. Inflation – bad news for emerging markets?
    Global supply chain disruptions, increase in commodity prices alongside rising demand as well as the Ukraine-Russia conflict has contributed to the
    rise in inflation across the globe.US inflation reached 7.9% in February 2022 – its highest level since 1982. This sharp increase in prices is expected
    to push the Fed to increase interest rates in 2022. Goldman Sachs, for instance, expects at least four rate hikes during the course of the year. While
    some emerging markets look better placed to deal with interest rate hikes in the US compared to a decade ago, a number of key markets including
    SA and Egypt remain vulnerable.
                                                                                                                                     Share of advanced economies (AE) and emerging markets and developing
                         Consumer inflation by country/region (%), 2019-2025f                                                            economies (EMDE) with inflation above 5%, Jan 2010-Dec 2021*
                      23.3%
                  21.2%
              19.0%
          13.5%

                                 11.8%
                             9.8%
                          8.2%

                                              8.0%

                                                                                                                         6.2%
                                                                  6.1%
                                                    5.5%

                                                                                     5.2%
                                                   5.1%
                                           4.8%
                                           4.8%

                                                               4.7%
                                                  4.6%

                                                                                                                      4.4%
                                         3.6%

                                                                                                                    3.4%
                                                                                                      3.1%

                                                                                                                   3.0%
                                                                                                     2.9%

                                                                                                                   2.9%
                                                                                                                   2.8%

                                                                                                                   2.8%
                                                                                                     2.7%
                                                                                  2.6%

                                                                                                    2.5%
                                                                      2.3%

                                                                                         2.3%

                                                                                                    2.3%
                                                                                                    2.3%
                                                                      2.2%

                                                                                         2.0%
                                                                                         2.0%
                                                            1.8%

                                                                     1.7%
                                                           1.2%

                                                                               1.2%

                                                                                                 0.9%
                                                                             0.3%

           Sub-Saharan                   North Africa              US            Eurozone               China        World
              Africa

                                           2019      2020      2021      2022f      2023f       2024f      2025f

Source: Bloomberg, Fitch Solutions, World Bank                                                                                                                                 Accelerating Growth in Uncertain Times
                                                                                                                                *The sample consists of 34 AEs and 109 EMDEs
                                                                                                                                                                                                                        10
Kenya National Budget 2022/23
Macro Outlook
5. Marginalisation of the Global South
The pandemic has led to a global loss in GDP/capita; however, developing countries are expected to feel the impact of the pandemic longer
than developed economies increasing the marginalisation of the Global South. Extreme poverty increased due to the pandemic; and while
the number of people in extreme poverty has started to decline in 2021, Africa will remain the only region in the world that will continue to
see an increase in the number of people living in extreme poverty in the short term.
Source: UN DESA Accelerating Growth in Uncertain Times
11Implications of the Ukraine- Russia conflict
Kenya National Budget 2022/23

                   Russia’s invasion of Ukraine triggered a surge in commodity prices

          Given Russia’s role as an important producer of a range of commodities, the fear about supply disruptions due to the invasion of the
          Ukraine and subsequent sanctions on Russia led to a surge in commodity prices. While these commodity price increase may lead to
          unexpected windfalls for commodity producing countries, they will further increase inflationary pressure in many markets.

                                                                                                            South Africa accounted for about
                                                                                                                33% of global palladium
                                                                                                                  production in 2020
Source: The Economist, Bloomberg                                                                                         Accelerating Growth in Uncertain Times
                                                                                                                                                                  13
Kenya National Budget 2022/23
Africa’s export dependency on Russia and Ukraine is limited
Overall, Russia and Ukraine are relatively insignificant trade partners of Africa. In 2020, both countries combined accounted for less
than 0.5% of all African exports. North Africa has the strongest and Middle Africa the weakest export exposure to Russia and Ukraine.
In 2020, agricultural products and crude materials were Africa’s key exports to Russia and Ukraine.
Export dependency on Russia and Ukraine, 2020
Africa's export basket to Russia, 2020
Beverages and Other
tobacco 10%
North Africa
Morocco
5%
Russia: 0.61% of total imports Crude materials,
inedible, except
Algeria
Libya
Egypt Ukraine: 0.17% of total imports fuels…
Machinery and
Eastern Africa transport
Mauritania Mali
Cape Niger equipment
Verde Sudan
Eritrea Russia: 0.34% of total Food and live
Islands Senegal Chad 10%
Gambia
Burkina imports animals
Djibouti
Guinea-Bissau Guinea Faso
66%
Benin
Nigeria Somalia
Ukraine: 0.17% of total
Togo
Ivory Ethiopia
Sierra Leone CAR South
Coast Ghana Sudan
imports
West Africa Liberia Cameroon
Equatorial Guinea Uganda Kenya
Russia: 0.19% of total imports Gabon DRC
Rwanda
Burundi
Africa's export basket to Ukraine, 2020
Ukraine: 0.27% of total Tanzania
Seychelles
Other
imports
Middle Africa 18%
Malawi
Comoros
Angola
Crude
Russia: 0.1% of total imports Zambia materials,
inedible, except
Ukraine: 0.02% of total Beverages and
Zimbabwe Mauritius fuels
imports Namibia tobacco
40%
Botswana 10%
Southern Africa Eswatini
Lesotho
Russia: 0.4% of total imports South
Chemicals and
Africa
related
Ukraine: 0.02% of total products, n.e.s.
Source: UNCTAD imports 12% Food and live animals Accelerating Growth in Uncertain Times
20% 14Kenya National Budget 2022/23
Africa’s import dependency on Russia and Ukraine is limited
In 2020, Ukraine and Russia combined accounted for 2.5% of all African imports. North Africa has the strongest and Southern
Africa the weakest exposure to Russian and Ukrainian imports.
Top 10 most import dependent on Russia, 2020
Import dependency on Russia and Ukraine, 2020 Imports from Russia (% of total)
1 Burkina Fasso 4.4%
North Africa
2 Congo Brazzaville 4.0%
Morocco
Russia: 2.4% of total imports 3 Senegal 4.0%
Algeria
Libya Ukraine: 1.6% of total imports 4 Egypt 3.8%
Egypt
5 Mauritania 3.5%
Eastern Africa 6 Morocco 3.0%
Cape
Mauritania Mali
Niger Russia: 1.0% of total imports 7 Cameroon 2.9%
Verde Sudan
Islands Senegal
Eritrea 8 Sudan 2.6%
Gambia
Chad
Ukraine: 0.4% of total imports
Guinea-Bissau
Burkina
Faso Djibouti 9 Togo 2.6%
Benin
Guinea
Nigeria Somalia
Ethiopia 10 Tunisia 2.3%
Togo
Sierra Leone Ivory South
Coast CAR
Ghana Sudan
West Africa Liberia Cameroon
Top 10 most import dependent on Ukraine, 2020
Equatorial Guinea Uganda
Russia: 1.9% of total imports Gabon DRC
Kenya
Imports from Ukraine (% of total)
Rwanda
Ukraine: 0.4% of total imports Burundi Seychelles 1 Libya 2.7%
Tanzania
2 Chad 2.4%
Middle Africa
Comoros 3 Egypt 2.4%
Malawi
Russia: 1.2% of total imports Angola
Zambia 4 Sudan 2.0%
Ukraine: 0.4% of total imports 5 Tunisia 1.7%
Zimbabwe Mauritius
Namibia 6 Mauritania 1.3%
Botswana
7 Eritrea 1.2%
Southern Africa Eswatini
8 Gambia 1.1%
Lesotho
Russia: 0.8% of total imports South 9 Senegal 1.1%
Africa
Source: UNCTAD Ukraine: 0.04% of total imports 10 Ethiopia 1.0%
Accelerating Growth in Uncertain Times
15Kenya National Budget 2022/23
Ukraine conflict could push food prices up in parts of the continent
While Russia and Ukraine are relatively insignificant suppliers of goods to Africa, they are important suppliers of wheat (~40%), maize
(~18%) and fertilisers (~12%). Supply shortfalls from Russia and Ukraine could have serious food security implications for a number of
countries on the continent. In the past, food insecurity and food price increases have been key sources of civil unrest in a number of
countries on the continent. Top 5 African countries most dependent on Russian
and Ukrainian exports, 2020
Africa's import dependency on Russia and Ukraine, 2020 Wheat
Benin 99%
Somalia 85% Russia
Egypt 60% 24% Ukraine
Congo Brazzaville 67% Rest of the world
Namibia 62%
Maize
Libya 2% 74%
Mauritania 46% 21% Russia
Tunisia 51% Ukraine
10.8% Sudan 33% 3% Rest of the world
Egypt 27%
29.5%
17.5%
0.7% Fertiliser
3.8%
2.7% 11.2%
0.8% 5.6% 0.0%
2.9% Congo Brazzaville 20% 4%
1.7% 0.2% 0.2%
Morocco Russia
Total imports Food (excl. Fuels Wheat Maize Oil seeds Fertilisers 34%
tea, coffee, Senegal 26% 16% Ukraine
cocoa, spices) Cameroon 54% Rest of the world
Mauritania 41% 13%
Russia Ukraine Rest of the world
Accelerating Growth in Uncertain Times
Source: UNCTAD 16The ARC-economy
Kenya National Budget 2022/23

         East Africa – ARC economy

                                                                                         East Africa Community’s trade with world

Population: 2.2 billion
                                                                                                                                            China
GDP: US$ 16.4 trillion                               Dubai                                                                             22%

Weighted GDP growth                                                        Mumbai
                                                                                    Rest of World
2019: 4.7%                                                                                          42%

2020: -5.8%                                        Djibouti

                                     Addis Ababa                                                                                                12% India
2021: 8.2%
                                        Nairobi

                                              Mombasa                                                                                  11%
                                              Dar es Salaam
                                                                                                             2%
                                                                                                              2%                             UAE
                                                                                                                      5%     5%
                                                                                                      Malasia
                                                                                                                                   Saudi Arabia
                                                                                                        Indonesia
                                                        Antananarivo                                                Japan

                                                              Port Louis

                                     Maputo                                         •     58% of imports coming into the EAC are from the Asia-Pacific
                                                                                          region, with China leading this charge with exports amounting
                                                                                          to US$7.1bn
                                                                                    •     The UAE alone accounts for 16% of the EAC’s exports

                                                                                                             Accelerating Growth in Uncertain Times
                                                                                                                                                       18
Economic Overview
Gladys Makumi, Financial Advisory Leader, Deloitte East Africa
1
9Kenya National Budget 2022/23
Global Outlook
The global economic growth forecast for 2022 has been revised down from 4.4% to 3.6% owing to the political uncertainty surrounding the
Russia-Ukraine conflict, which is also expected to result in rising commodity prices thus driving global inflation beyond 6% this year
World Economies
8.1%
6.5%
8%
5.9%
5.8%
5.7%
5.6%
5.2%
5.2%
4.6%
4.6%
4.4%
4.4%
4.3%
6%
3.9%
3.8%
3.7%
3.7%
3.6%
3.6%
3.4%
3.4%
2.4%
2.2%
2.3%
2.1%
4%
2%
GDP % growth
0%
-2%
(1.5%)
-4% (3.1%) (2.8%)
(3.5%) (3.8%)
-6%
(5.6%)
-8% (7.1%)
World US Latin America Europe Sub Saharan Africa Middle East and North China Asia & Australasia
Africa
2020 2021 2022F* 2022F**
*before Russia-Ukraine conflict, **after Russia-Ukraine conflict
01 The global economy is estimated to have grown by
5.9% in 2021 driven by the base effect of the 02 The ongoing conflict between Russia and Ukraine will
affect the global economy via three main channels:
financial sanctions, commodity prices and supply-
03 In view of the Russia-Ukraine conflict, global growth is
expected to slow to 3.6% in 2022. Growth in Europe, is now
expected to decline to 2.3% in 2022 from 5.7% in 2021.
contraction experienced in 2020, and the
chain disruptions, with the main impact coming from Growth forecasts for the US and China have not been
development of COVID-19 vaccines, which led to the
a sharp rise in commodity prices. The rise in revised owing to strong real GDP growth in recent months.
lifting of containment measures thereby encouraging
commodity prices is expected to fuel global inflation, The economic impact of the conflict will be felt mostly in
the resumption of economic activities.
which is expected to surpass 6% in 2022. Ukraine and Russia, which will both experience sharp
Source: Economist Intelligence Unit (EIU), International Monetary Fund (IMF) World Economic Outlook January 2022 recessions this year.
Accelerating Growth in Uncertain Times
20Kenya National Budget 2022/23
Africa Outlook
Africa’s GDP is estimated to have grown by 3.4% in 2021 underpinned by a rebound in commodity prices and a rollback of pandemic-
induced restrictions. Growth is expected to reach 4% in 2022 despite both global and political uncertainty
Northern African economies, being commodity exporters, are expected to benefit from
strong global demand and increased prices of hydrocarbons, metals and minerals and
other commodities in 2022.
Sub-Saharan African economies collectively registered a 3.7% growth in 2021, owing to
an increase in commodity prices and an easing of social restrictions. 2022 growth is
forecasted to reach 3.6%. However, the recovery remains insufficient to reverse the
pandemic-induced increase in poverty.
01 Travel and tourism face another difficult year in 2022
as economies with large tourism sectors—for
example, Botswana, Mauritius, Namibia, Kenya,
02 The Russia-Ukraine conflict presents an opportunity
for Africa's oil exporters who stand to gain from a
further increase in international oil prices, while the
03 Although economic growth in China (the region's
most important trade partner) is expected to slow
down to 4.8% in 2022 owing to a disruption in the
South Africa and Seychelles—will continue to be continent’s non-oil commodity exporters will receive housing sector and the resurgence of COVID-19
negatively affected by the restrictions on an uplift from the rising prices of food and industrial cases, it should still be sufficient to support demand
international travel. However, tourism is expected to raw materials. for Africa's exports.
pick up after an increase in global vaccination rates.
Accelerating Growth in Uncertain Times
Source: Africa Development Bank (AfDB), EIU, IMF 21Kenya National Budget 2022/23
East Africa Outlook
East African Economies are on track to return to pre-pandemic levels of growth as vaccinations continue to be rolled out and restrictions
on trade and travel are eased. Efforts to streamline previously cumbersome trade bottlenecks, are also set to bolster inter-country trade
GDP Growth Inflation
2020 2021e 2022F 2020 2021e 2022F
Kenya 0.6% 6.0% 4.5% 5.1% 6.1% 6.0%
Uganda (1.1)% 4.7% 5.8% 2.8% 2.2% 4.2%
Ethiopia
Tanzania 6.3% 5.0% 5.2% 3.0% 3.7% 5.0%
Ethiopia 6.1% 2.0% 3.3% 20.9% 26.7% 24.8%
Rwanda (3.4%) 9.6% 7.7% 9.9% (0.4%) 2.9%
Congo (Democratic
1.7% 5.7% 5.9% 14.6% 9.3% 7.0%
Uganda Republic)
Kenya GDP Growth
• East African economies made substantial rebounds in 2021, largely attributable to easing of both country-specific
Rwanda and inter-country COVID-19 restrictions. The East Africa regional economy is projected to grow by 4.9% in 2022 from
an estimated growth of 4.1% in 2021. Slow rollout of vaccination programs, the vulnerability of rain fed agriculture
to climate change effects and high debt levels limiting fiscal space pose downside risks to the forecast.
• The regional economy continues to be sustained by spending on large infrastructure projects, output in agriculture,
Tanzania increase in trade from regional economic development and direct foreign inflows especially in technology.
Inflation
• The EA countries, through their central banks have continued to manage inflation to remain within targeted bands
for most of the economies excluding Ethiopia.
• The countries, being net importers, continue to remain susceptible to global price movements thereby putting an
Source: EIU, Fitch Solutions upward pressure on regional prices in the short-term resulting in increased inflation.
Accelerating Growth in Uncertain Times
22Kenya National Budget 2022/23
Kenya Outlook
Kenya's economy is expected to continue in its recovery with a forecasted 4.5% growth in 2022, albeit a slow down from 6.0% in 2021.
The continued growth will be driven by strong private investment, a dynamic services sector and a rebound in the agriculture sector
Economic growth Sectoral growth 8.8% Exchange rate KES/USD
8%
6.0% 5.4% 2022F
6% 4.6% 4.4% 4.5%
4.5%
2021 114.3
4%
2%
0.6%
5.1%
2020 109.6
(1.4%) (2.0%)
0%
2020 2021e 2022F
(1.2%) 106.5
Agriculture Industry Service
GDP growth 2020 2021e 2022F
GDP growth in 2021 was largely driven by double digit GDP growth is expected to slow down to 4.5% in The shilling weakened to an average of KES
growth in the education and transport service sub- 2022, owing to the political uncertainty linked to the 109.6/USD in 2021 from an average of KES
sectors following the lifting of COVID-19 containment general elections to be held in August. Other 106.5/USD in 2020, driven by a wider current
measures, and a 5.4% growth in the industry sector. constraining factors in 2022 will be tighter fiscal account deficit and a downward drift in foreign
Inflation rose to 6.1% in 2021 from 5.6% in 2020, policy and a rise in domestic interest rates in exchange reserves since mid-2021. The shilling is
owing to the increased cost of oil and food, as well as response to global trends and inflationary pressures. expected to weaken further to KES 114.3/USD in
the withdrawal of the COVID-19 tax relief measures. However, government subsidies on fertilisers and 2022, exacerbated by the uncertainly linked to the
strengthening external demand are expected to general elections to be held in August 2022.
support a rebound in agriculture.
Source: EIU, Fitch Solutions, IMF
Accelerating Growth in Uncertain Times
23Kenya National Budget 2022/23
Kenya Outlook
Russia is a major global producer of oil, energy and agricultural commodities. Sanctions against Russia following its invasion of Ukraine
have led to increased global oil and commodity prices, which is bound to have negative effects on the Kenyan economy
Context
2014
Ukrainian President rejects an agreement with the Effects on the Kenya economy
European Union in order to establish closer
relations with Moscow. Mass protests throughout
Ukraine followed this decision and he was ousted as 01 Sanctions against Russia have resulted in a global shortage of oil supply thus
driving up fuel costs. Higher fuel costs directly affect the transport sector,
generation of electricity and other manufacturing processes.
president. Shortly after, in an act of retaliation,
2015 Russia invaded Ukraine and annexed Crimea. This
A peace accord – the Minsk II
agreement – is brokered to help end
also led to 2 pro-Russian regions Donetsk and
Luhansk to separate from Ukraine.
02 Kenya relies on imported wheat from Ukraine and Russia. The ongoing conflict
will restrict wheat exports to Kenya thereby leading to a rise in wheat flour and
bread prices. A tonne of wheat has increased by 30% from KES 25.3k in
the conflict. The agreement obliges December 2021 to KES 33k in March 2022. Wheat is the third most consumed
Ukraine to offer autonomy to the
food commodity in the country hence any price increase will directly be felt by
separatist regions while regaining full
control of its border with Russia in the
the citizens.
rebel-held territories.
03 Russia is the fourth-biggest buyer of Kenyan tea, having taken up produce worth
KES 6.2bn in the 11 months to November 2021. Tea is a key foreign exchange
earner for the country hence this could worsen the current account deficit and
2021
In October, Russia starts massing its military along the Ukrainian border in October raising fears reduce foreign exchange earnings.
regarding another Russian invasion. In December, Russia presents NATO and the US with a set of
written demands and security assurances that Ukraine would never join NATO and that NATO
withdraws its troops from across countries in eastern Europe. The US declines on these demands
04 The conflict could hurt the flow of foreign investors to the Nairobi Securities
Exchange (NSE) as investors rush to invest in more stable markets.
resulting in Russia’s invasion of Ukraine in a bid to stop Ukraine from joining NATO.
Accelerating Growth in Uncertain Times
24Kenya National Budget 2022/23
Kenya Outlook
The IMF Debt Sustainability Analysis in December 2021, classified Kenya’s public debt as sustainable but having a high risk of debt distress.
The ongoing economic recovery in 2022 is helping offset deteriorated solvency caused by continued budget deficits from previous years
coupled with the pandemic-induced economic contraction
Public Debt
2019 Adjusted 2020 KES 7.7 trn
9,000
Average forecast
70% KES 9.0 trn
68.2% 68% Total Debt as
8,000 Debt Ceiling
7,000
65.8% 66% at June 2021
64%
6,000 62.0%
62% • The increase in public debt can mainly be attributed to loan
5,000 59.4%
57.4% disbursements for budget support following the adverse
KES bn
3,697 60%
4,000 3,178 effects of COVID-19 pandemic on revenue collection,
2,786 58% financing of ongoing and new development programs and
3,000 2,113 2,479
2019 Pre COVID-19 Adjusted 2020 56% depreciation of the Kenya shilling in 2021.
2,000
Average 2020 forecast forecast 54%
• Until 2019, China was the leading creditor to Kenya before
1,000 52% being overtaken by the World Bank in 2020. Other major
2,294 2,568 3,023 3,516 4,015
- 50% creditors include International Sovereign Bond (ISB)
June-17 June-18 June-19 June-20 June-21 holders and a syndicate of Commercial Banks. These four
External debt Domestic debt Total debt as a % of GDP leading creditors accounted for 76.8% of total external debt
Source: National Treasury, Central Bank of Kenya as of June 2021.
• For the FY 2022/23 budget, the Government targets a net
financing mix of 32% external debt and 68% domestic debt
% of total debt June-17 June-18 June-19 June-20 June-21 to fund the 2022/23 fiscal deficits as the optimal debt
strategy that aims at minimising exchange rate risks
External debt associated with external debt.
52.1% 50.9% 52.0% 52.5% 52.1%
• The Government also plans to transition to a medium-term
Domestic debt 47.9% 49.1% 48.0% 47.5% 47.9% debt ceiling of 55% of GDP in present value terms and is
pursuing a strategy for its achievement before the general
elections in August.
Source: IMF, Central Bank of Kenya, EIU, National Treasury Accelerating Growth in Uncertain Times
25Kenya National Budget 2022/23
Tracking on the Big 4 Agenda
Vision 2030, Kenya’s long-term development blueprint, is being implemented through successive 5-year medium term plans. The
implementation of the Third Medium Term Plan (MTP III) 2018-2022 is designed on achieving the “Big Four” Agenda in order to support
higher economic growth, faster job creation, and reduce the cost of living for Kenyans
• Targets for the MTP III included:
— enhancing Food and Nutrition Security through construction of large-scale multi-purpose and smaller dams for irrigation projects,
— construction of food storage facilities; and
— implement programmes to support smallholder farmers to sustainably produce and market various commodities.
• As of November 2021, the following had been achieved:
— the implementation of the Agricultural Inputs Subsidy Programme for farm inputs, which has improved the production of main crops
Food Security such as maize, rice, coffee, tea and wheat through the provision of the subsidised fertiliser and seeds, enabling farmers to earn more
incomes and make Kenya more food secure;
— the restructuring of the Kenya Tea Development Agency (KTDA) has streamlined and improved operations in the sector, setting the
price of tea on an upward trajectory, while the revival of the Kenya Meat Commission (KMC) has supported local value addition for beef
by providing a ready market for livestock; and
— the Government through the National Expanded Irrigation Programme has increased food production through construction, expansion
and rehabilitation of irrigation schemes across counties e.g. the expansion of Galana Kulalu farm acreage from 52,000 to 100,000, the
Lower Nzoia Irrigation Project; and the rehabilitation of Bura Irrigation Scheme.
• The target for the MTP III was to provide at least 500k affordable new houses to Kenyans by 2022.
• As of November 2021, the construction of 1,370 affordable housing units, 462 social housing units, 540 National Police and Prisons Services
housing units and 670 civil servants’ houses benefiting over 800 civil servants had been achieved.
• In order to improve access to land for housing, the Government also issued over 4.5 million titles under the National Land Titling
Programme. Going forward, the construction of 25,965 affordable housing units in Starehe (3,360), Shauri Moyo (4,470), Kibera Zone B
Affordable housing (4,435) and Mukuru, Meteorological site (13,700) is set for commencement.
Source: National Treasury Accelerating Growth in Uncertain Times
26Kenya National Budget 2022/23
Tracking on the Big 4 Agenda
Since the onset of the Big Four Agenda, the Government has made deliberate efforts to implement various policies in order to promote
dynamic, inclusive and sustainable development
• The targets for the manufacturing sector under the MTP III include:
— Supporting value addition; and
— raising the manufacturing sector’s share to 15% of GDP by 2022.
• As of November 2021, the following had been achieved:
— the modernisation of RIVATEX East Africa Limited led to increased textile and apparel production, and the creation of job opportunities
through linkages with cotton farmers.
Manufacturing — provision of tax incentives in order to spur growth in the leather sector to meet the growing domestic and external demand; and
— the manufacturing sector comprised 7.4% of GDP in Q3 of 2021, down from 8.1% in Q3 of 2018.
• The main MTP III target was achieving universal health coverage by implementing programmes that increase health insurance coverage,
increase access to quality healthcare services and offer financial protection to people when accessing healthcare.
• As of November 2021, the following had been achieved:
— through the ‘Linda Mama’ programme and other health interventions relating to reproductive health, there has been improved skilled
Universal Health Coverage birth attendance from 67% in FY 2018/19 to 78.3% in FY 2020/21;
— following the successful rollout of the UHC programme pilot phase, utilisation of health services across the country increased, with over
(UHC) 1.6 million additional hospital visits made during the 12-month period of the pilot phase;
— the Government provided health insurance cover for the elderly and severely disabled in society under the Health Insurance Subsidy
Programme and launched the biometric registration for the UHC scheme to capture the biometric data; and
— there has also been an increased ICU bed capacity from 108 to 651 and improved oxygen generation capacity in public health facilities
from 3m litres/day in March 2020 to 32m litres/day as of October 2021 in order to address the challenges caused by COVID-19
pandemic.
Source: National Treasury, Visio 2030 Kenya Accelerating Growth in Uncertain Times
27Budget Overview
Fred Omondi, Tax & Legal Leader, Deloitte East Africa
2
8Kenya National Budget 2022/23
Budget Overview
FY22/23 Budgetary allocation Budgetary allocation – FY 19/20 to FY 22/23
2,500.0 2,500 2,349
2,201.0 2,201
1,919 1,963
2,000.0 2,000
1,500
1,500.0
KES Bn
1,000
697 667 712
1,000.0 614
715.5 363 370
500 317 317
500.0 370.0
-
56.0 KES Bn KES Bn KES Bn KES Bn
- Budget
Source: FY 22/23 2019/20 2020/21 2021/22 2022/23
Policy Statement Recurrent Development County allocation Equalization fund
expenditure expenditure Recurrent expenditure Development expenditure County allocation Equilization fund
Recurrent expenditure continues to take the largest share of the budget at 67%. As has been the trend over the years, the Kenyan budget has increased from
KES 3.0 Trillion in FY 21/22 to KES 3.3 Trillion for FY 22/23.
Development expenditure and county allocation take a minority share of 22%
and 11%, respectively, contrary to the provisions of the Public Finance The government will be prioritizing implementation of MTP III programs, the
Management Act Section 15 (2) (a) which requires that development Economic Recovery Strategy and the “Big Four” Agenda. However, there may
expenditure should be allocated a minimum of 30% of the national budget. be challenges as the FY 22/23 budget will be implemented during an
electioneering year and at a time when the economy is recovering from the
There is need for Kenya to control recurrent expenditure in order to realize real adverse effects of the COVID-19 pandemic but facing new headwinds.
growth. Key areas like the bloated public service and debt servicing may hinder
growth if not addressed.
Accelerating Growth in Uncertain Times
* Medium Term 2022 Budget Policy Statement, November 2021 29Kenya National Budget 2022/23
Revenue Trends
FY 2022/23 Projected Revenue Sources Trend in tax revenues
Income tax VAT Excise duty Import duty 1,200 2,500
1,000
2,000
15%
800
1,500
KES Bn
KES Bn
7% 600
1,000
49% 400
500
200
29% - -
2017/18 2018/19 2019/20 2020/21 2021/22* 2022/23*
Income tax VAT Excise duty Import duty Total tax revenue
In keeping with prior years, income tax is expected to be the main revenue 1. There is an upward trend in the revenue collections over the last five years
generator with a projection of KES 997 Billion in FY 22/23, accounting for from KES 1.3 Trillion in the financial year 2017/18 to projected revenue
approximately 49% of the total projected tax revenue. collections of KES 2.0 Trillion in FY 2022/23. It represents an 18% growth over
projected tax collections for FY21/22.
VAT is projected to achieve the highest growth in revenues at 23%, followed 2. The projected increase in tax revenues can be attributed to the expected
by import duty at 22%, with excise duty trailing at 14%. economic recovery post COVID-19, tax increases especially excise and import
duty, KRA’s intensified compliance and enforcement efforts, fast-tracking
dispute resolution, Voluntary Tax Disclosure Program (VTDP), continued
automation of tax administration, among other initiatives.
3. This projected growth in tax revenues is likely to be negatively impacted by
economic vulnerabilities.
Accelerating Growth in Uncertain Times
30Direct Tax Measures
Fred Omondi, Tax & Legal Leader, Deloitte East Africa
3
1Kenya National Budget 2022/23
Corporate Tax
Cash donations to any charitable organisation to be deductible
• All entities that donate cash to charitable organizations to deduct the donation from their taxable income.
• Currently only donation to charitable organisations that are registered under either the Societies Act or the
Non-Governmental Organisations Coordination Act are allowable for tax deductions.
Gains accruing to non-residents on transactions involving derivatives to be taxable
• Gains accruing to non-residents from transactions involving financial derivatives in Kenya to be taxable in
Kenya.
Exemption of microfinance institutions from the interest limitation rule
• Microfinance institutions licensed under the Microfinance Act to be exempted from the interest
restrictions based on a ratio of earnings before interest, taxes, depreciation and amortization in
determination of their taxable income (EBITDA).
Accelerating Growth in Uncertain Times
32Kenya National Budget 2022/23
International Tax
• Kenya signed the Mutual Administrative Assistance in Tax Matters (MAC) with Global
Forum on Transparency and Exchange of Information on Tax in July 2020.
• In the Budget Statement, the CS proposes to amend the Income Tax Act to require MNEs
with operations in Kenya to report the activities within Kenya and other jurisdictions to
the Commissioner General (CG) for KRA.
• This proposal seeks to expand the scope of the entities that are required to report to the
CG. Currently, the reporting is only required where the ultimate parent company is a
resident in Kenya for tax purposes. For purposes of implementing the Country by Country
(CbC) Reporting, the Cabinet Secretary published draft regulations in 2021.
Country by Country • The proposal will enable the KRA to have visibility of financial and related information thus
promoting greater tax transparency among the MNEs. Besides, CbC, the Kenyan
Reporting Compliance for all Government also implemented Common Reporting Standards (CRS) regime to enhance
multinationals operating in automatic exchange of financial account information.
Kenya.
• These changes are expected to increase compliance and reporting requirements for MNEs
in Kenya. The proposal is expected to seal tax revenue loopholes by granting the KRA
access to information of the MNEs operations.
Accelerating Growth in Uncertain Times
33Kenya National Budget 2022/23
Tax Administration
Taxpayers to deposit 50% of the disputed tax prior to filing an appeal after a TAT
decision
• A taxpayer who is aggrieved by the decision of the Tax Appeals Tribunal, to deposit 50% of the
disputed tax revenue in a special account at the Central Bank of Kenya as the taxpayer proceeds to
appeal the decision.
• Should the matter be ruled in the taxpayer’s favour, the deposit will be refunded within 30 days after
final determination of the matter in court.
• The stated aim of this proposal is to protect the disputed tax revenues considering that some tax
disputes take too long to be concluded, especially after judgement by the Tax Appeals Tribunal.
KRA to be allowed to block the disposal of registrable assets that may be used
as security for unpaid taxes
• Commissioner General for KRA empowered to direct the Registrar of ships, aircrafts, motor vehicles
and any other properties that may be used as security for unpaid taxes to restrict disposal or
transaction of these assets. Presently, the TPA only empowers the Commissioner General to direct
the Land Registrar to restrict the disposal of land belonging to taxpayers with tax arrears.
• The intention is to secure unpaid tax revenue due from taxpayers who may have assets other than
land, which the Commissioner can put a caveat or restriction to prevent transfer. Accelerating Growth in Uncertain Times
34Kenya National Budget 2022/23
Tax Administration
Objection decision to be issued within 60 days
• Commissioner to issue an objection decision within one cycle of 60 days from the date of receiving a
valid objection by a taxpayer.
• Currently, the Tax Procedures Act empowers the KRA to request for additional information from
taxpayers to facilitate determination of an objection on assessed tax.
• This potentially prolongs the determination of tax disputes as additional information can be
requested severally and any request for additional information provides the Commissioner with
additional 60 days to make a decision.
Draft National Tax Policy to be shared for input
• The Government has developed a draft National Tax Policy to guide tax administration. The policy will
soon be shared with stakeholders and peer review institutions for input.
• Further, the Government is developing a Medium-Term Revenue Strategy to boost tax revenues,
improve the tax system and link taxation to the country’s development needs over the medium term.
Accelerating Growth in Uncertain Times
35Indirect Tax Measures
Lillian Kubebea, Indirect Tax Partner, Deloitte East Africa
3
6Kenya National Budget 2022/23
Value Added Tax
Exemption of Plant and Machinery used in manufacturing of
pharmaceutical products
▪ Proposal to exempt the acquisition of plant and machinery for
use by manufacturers of pharmaceutical products.
Exemption for locally manufactured
Exemption of medical supplies from VAT passenger motor vehicles
▪ VAT exemption on medical oxygen ▪ Input and raw materials used in the
supplied to registered hospitals, urine manufacture of passenger motor
bags, adult diapers, artificial breasts, and vehicles to be exempt from VAT; and
colostomy or ileostomy bags for medical ▪ Proposal to also exempt from VAT the
use. purchase of locally manufactured
passenger vehicles.
Accelerating Growth in Uncertain Times
37Kenya National Budget 2022/23
Excise Duty
• Eggs for hatching imported by licensed
hatcheries upon recommendation by the
responsible CS;
• Neutral spirit used by registered
Exemption pharmaceutical manufacturers upon
of excise approval by the CG; and
Inflationary duty • Locally manufactured passenger motor
adjustment vehicles.
• Empower CG to exclude products from
inflation adjustment on consideration
Introduction of excise duty
of economic circumstances facing the
products. • Fees charged for advertisement
Excise duty increase of alcoholic beverages, betting
and gaming activities at 15%
• Various products with specific rates
excluding petroleum products by 10%
Change in excise duty on liquid nicotine
• Change in excise duty regime on
liquid nicotine products from
shillings per unit to KES 70 per
millilitre. Accelerating Growth in Uncertain Times
38Kenya National Budget 2022/23
Miscellaneous Fees and Levies Act
1. IDF and RDL exemption
• Exemption of IDF and RDL on inputs and raw materials used for manufacture of
pharmaceutical products.
2. Export levy
• Reduction of export levy on raw hides and skins from 80% or USD 0.52 per Kg to
50% or USD 0.32 per Kg
Accelerating Growth in Uncertain Times
39Other Measures
4
0Kenya National Budget 2022/23
Other measures
Public Procurement and Asset Capital Markets Act (Cap Insurance Regulations Unclaimed Financial
Disposal (Amendment) Bill, 485A) Assets Act (UFAA)
2021
• The Government • There is a proposal to • The Government • The Bill proposes to amend
proposes enactment of amend the Act to expand proposes to amend the the UFAA to provide for
the Public Procurement the scope of persons who regulations to require waiver of penalties, fines,
and Asset Disposal can act as investment motorcycles and three- and audit fees
(Amendment) Bill, 2021 advisors. wheeler motor vehicles • In addition, the Bill proposes
to obtain insurance for to introduce a 12 -month
• The bill is geared towards • The move is aimed at their passengers
allowing submission of allowing single director Voluntary Disclosure
the multiple awards companies and • This will cater for Program that will waive
where several bidders can partnerships to be compensation for penalties
be awarded the same licensed as investment damages occasioned by • The moved is aimed at
contract. advisors. motorcycle related encouraging reporting and
accidents. recovery of identified assets.
Accelerating Growth in Uncertain Times
41Kenya National Budget 2022/23
Other measures
Public Finance Management Kenya Revenue Authority to Statutory Instruments Act
Act be rebranded to Kenya
Revenue Service
• The Bill proposes to amend • The Statutory Instruments Act
the Act to replace the debt • The change of the name is is to be amended to exempt
ceiling with a debt anchor intended to rebrand the tax related Regulations under
of 55% of debt to GDP Authority and transform its various tax laws from the
public image thus enhance automatic 10 years expiry
• The move is geared towards tax compliance through period from the date of their
aligning Kenya’s debt improved public relations publication as provided under
management to and maintain a clear focus on the Statutory Instruments Act.
international best practice taxpayers’ needs.
but also provide more • Expiry of these instruments
headroom for borrowing. would negatively affect tax
administration and revenue
collection.
Accelerating Growth in Uncertain Times
42Panel discussion
Julie Nyang’aya, Risk Advisory Leader, Deloitte East Africa
4
34 4
Deloitte refers to one or more of Deloitte Touche Tohmatsu Limited (“DTTL”), its global network of member firms, and their related entities (collectively, the “Deloitte
organization”). DTTL (also referred to as “Deloitte Global”) and each of its member firms and related entities are legally separate and independent entities, which cannot
obligate or bind each other in respect of third parties. DTTL and each DTTL member firm and related entity is liable only for its own acts and omissions, and not those of each
other. DTTL does not provide services to clients. Please see www.deloitte.com/about to learn more.

  Headline Verdana Bold
Deloitte is a leading global provider of audit and assurance, consulting, financial advisory, risk advisory, tax and related services. Our global network of member firms and
related entities in more than 150 countries and territories (collectively, the “Deloitte organization”) serves four out of five Fortune Global 500® companies. Learn how
Deloitte’s approximately 345,370 people make an impact that matters at www.deloitte.com.

© 2022. For information, contact Deloitte Touche Tohmatsu Limited.
You can also read