DeepCyto: a hybrid framework for cervical cancer classification by using deep feature fusion of cytology images
←
→
Page content transcription
If your browser does not render page correctly, please read the page content below
MBE, 19(7): 6415–6434.
 DOI: 10.3934/mbe.2022301
 Received: 31 January 2022
 Revised: 21 March 2022
 Accepted: 05 April 2022
 Published: 24 April 2022
http://www.aimspress.com/journal/MBE

Research Article

DeepCyto: a hybrid framework for cervical cancer classification by
using deep feature fusion of cytology images

Swati Shinde*, Madhura Kalbhor and Pankaj Wajire

Department of Computer Engineering, Pimpri Chinchwad College of Engineering, Pune, Maharashtra,
India

* Correspondence: Email: swati.shinde@pccoepune.org.

Abstract: Cervical cancer is the second most commonly seen cancer in women. It affects the cervix
portion of the vagina. The most preferred diagnostic test required for screening cervical cancer is the
pap smear test. Pap smear is a time-consuming test as it requires detailed analysis by expert cytologists.
Cytologists can screen around 100 to 1000 slides depending upon the availability of advanced
equipment. Due to this reason Artificial intelligence (AI) based computer-aided diagnosis system for
the classification of pap smear images is needed. There are some AI-based solutions proposed in the
literature, still an effective and accurate system is under research. In this paper, the deep learning-based
hybrid methodology namely DeepCyto is proposed for the classification of pap smear cytology images.
The DeepCyto extracts the feature fusion vectors from pre-trained models and passes these to two
workflows. Workflow-1 applies principal component analysis and machine learning ensemble to
classify the pap smear images. Workflow-2 takes feature fusion vectors as an input and applies an
artificial neural network for classification. The experiments are performed on three benchmark datasets
namely Herlev, SipakMed, and LBCs. The performance measures of accuracy, precision, recall and
F1-score are used to evaluate the effectiveness of the DeepCyto. The experimental results depict that
Workflow-2 has given the best performance on all three datasets even with a smaller number of epochs.
Also, the performance of the DeepCyto Workflow 2 on multi-cell images of LBCs is better compared
to single cell images of other datasets. Thus, DeepCyto is an efficient method for accurate feature
extraction as well as pap smear image classification.

Keywords: cervical cancer; pap smear; artificial intelligence; deep features; PCA; artificial neural
network
6416

1. Introduction

 Cervical cancer is one of the major cancer after breast cancer and others among women as the
cause of death worldwide [1]. Most of the cases of cervical cancer are from low and middle-income
countries which have a low standard of living and low hygienic conditions [2]. Healthcare
infrastructure in low and middle-income countries is not too good, which compromises testing and
diagnosing the potential patients of cervical cancer. Cervical cancer can be treated and cured if detected
at an early stage but due to lack of infrastructure and cost for testing, low turnout is observed for
testing. Pap smear test is currently used as a primary screening tool for finding the presence of
precancerous cells [3]. However, the time required for getting the results of the pap smear test is long.
Pathologists are required to classify each cell from the slide which contains thousands of cells. The
slide with these many cells is viewed under a microscope and detection of precancerous or cancerous
cells remains subjective to the expertise of pathologists.
 Artificial Intelligent based medical imaging is being explored by researchers for diagnosing
several diseases more accurately [4,5]. Advancement in artificial intelligence, machine learning, and
deep learning technology in the area of healthcare and medical sciences provides assistance to
pathologists for the task of classifying the cells [6]. The model constructed using these techniques
gives a more accurate prediction based on the feature learning from a large amount of dataset. In this
paper, we have developed an approach with two workflows where we utilize the deep learning-based
features extraction using the pre-trained models and concatenate deep features to and apply Principal
Component Analysis (PCA) for getting the most important features so that data is resolved without
losing crucial traits of the dataset. The image feature obtained from PCA is then fed to multiple
classifiers for classification and then voting is done on the prediction of the classifiers to get a collective
decision for the classification of the data. In another workflow, we construct an artificial neural
network with nodes containing dropout layer, batch normalization, and fully connected dense layer
with softmax function, and then this model with concatenated deep features and artificial neural
network is compiled and used for prediction of input image data. In this approach we leverage the deep
features extracted from several pre-trained CNN models and flatten those deep features, keeping the
relevant feature intact. Before getting the features from Deep learning CNN models we augmented the
dataset to generate more images for better results, As the publicly available dataset for cervical cancer
does not contain enough images we augmented those images using rotation, shifting, rescaling,
shearing, flipping, and changing brightness. The deep features collected from pre-trained and
penultimate layers of the CNN are passed to the machine learning classifiers for classification tasks
and artificial neural network which is again trained.
 The overall workflow of this paper can be summarized as follows:
 1) A framework for optimal deep features selection of images using pre-trained Convolutional
Neural Network (CNN) classifiers.
 2) Deep features obtained from the penultimate layer of the convolutional neural network are
passed through a dense layer so that dimension can be reduced. These reduced dimensional features of
each convolutional neural network are concatenated to form a fusion of deep features to be called
image features.
 3) Since the deep features of the images extracted from the pre-trained CNN are large,
principal component analysis is used for taking out crucial features without losing the traits of

Mathematical Biosciences and Engineering Volume 19, Issue 7, 6415–6434.
6417

features. The resultant features subset reduces computations required and time for execution thus
ensuring faster convergence.
 4) The features are then passed to the machine learning classifiers for enhanced classification of
images in workflow 1. Scikit-learn, a popular python library is used for utilizing machine learning
classifiers namely: Support Vector Machine, Random Forest Classifier, Neural Network Classifier.
Comparative analysis of all the classifiers mentioned is done to find the best suitable classification
technique for the datasets available.
 5) The predictions obtained from the classifiers are then combined to take voting among them.
The Maximum voted class is considered as the predicted class.
 6) In workflow 2, an ensemble of convolutional neural networks of pre-trained models is
constructed and the features extracted from this ensemble model are passed to an artificial neural
network with a dropout layer and batch normalization with a fully connected layer of softmax function.
The artificial neural network model is compiled and trained to give predictions.
 7) The framework is assessed on open-access datasets by converting them into two classes
namely Normal and Abnormal cells. The dataset used is the Herlev Pap Smear cytology dataset,
Sipakmed Pap smear cytology dataset, and Liquid Based Cytology (LBC) pap smear dataset by
Guwahati Medical College and Hospital.
 The rest of the paper covers the literature survey, proposed methodology, dataset, and
performance evaluation of the proposed framework on the three mentioned datasets followed by the
conclusion of the paper.

2. Literature survey

 Previous studies show that feature extraction from images and choosing relevant features are
important steps for image classification problems. These steps impact the classification performance
significantly. There exist multiple methods for the extraction of handcrafted features from images [7].
But the handcrafted features cannot capture the spatial relationship among the pixels and researchers
have to decide which features are better for the applications at hand based on the experimentation. This
is because not all the feature extraction methods are well suited for all kinds of images. Also, the
handcrafted features give less classification performances. Nowadays deep learning models of CNN
are preferred as they are capable of feature extraction as well as classification. The drawback of these
models is that they need more data and are complex in architecture. This limitation is taken care of by
the transfer learning concept of deep learning, wherein the pre-trained models are made available to
alleviate the limitation of limited datasets.
 For cervical cancer classification, openly available datasets are limited in size. To overcome this
problem, the proposed framework DeepCyto uses the pre-trained models and customizes the dataset
into two classes to improve the quantity of per class samples. Table 1 refers to the authors and the
approaches they used for the classification of cervical cancer.
 The limitation of publicly available datasets related to pap smear images is addressed by using
pre-trained models which are already trained on large ImageNet datasets [8], fine-tuned and widely
used for different classification purposes. To increase the dataset, data augmentation is another
approach where we increase the size of the dataset by using different operations. However, the features
learned from similar-looking images would be similar to the original images. Therefore, we suggest
an ensemble of convolutional neural networks deep features to increase the quality of features obtained

Mathematical Biosciences and Engineering Volume 19, Issue 7, 6415–6434.
6418

from different implemented convolutional neural networks and use robust machine learning classifiers
for improving classification accuracy for our first approach and using newly constructed node of
artificial neural network with normalization and softmax function to improve classification in our
second approach.

 Table 1. Literature survey.

 Authors Dataset Method Description

 Md Mamunur Sipakmed pap smear Hybrid deep feature The author implemented an improved
 Rahaman et al. [9] fusion network version of the late fusion technique where
 they combined multiple features into a
 single feature vector.

 Hritam Basak et al. Herlev, Sipakmed Grey Wolf optimizer, The authors used a two-step feature
 [10] and Mendeley PCA and SVM reduction approach; PCA and Grey Wolf
 dataset Optimizer and did multi-class
 classification gaining accuracy up to 97%.

 Chankong et al. [11] Langerhans cell Artificial Neural They implemented different classifiers
 histiocytosis (LCH) Network for two-class and multiclass
 classification.

 William et al. [12] Herlev Pap Smear Fuzzy-C Means After extracting features from the image
 they used enhanced fuzzy-c means for
 classification.

 Byriel et al. [13] Herlev Pap Smear An adaptive network- The method used by the author performed
 based fuzzy inference good on binary classification but was not
 system good enough for multi-class

 Zhang et al. [14] Medical Liquid Fuzzy Clustering They used a dataset obtained from the
 Based Cytology means hospital and got an accuracy of 72-77%
 on the 7-class problem

 Marinakis et al. [15] Herlev Pap Smear Nearest neighbor They achieved the best accuracy of 98 on
 classifier fusion with the first nearest neighbor classifier with 2
 Genetic algorithm classes and 96 with 7 classes with the
 cross-validation technique.

 Zhang et al. [16] Herlev Pap Smear Deep convolutional Using a Deep convolutional neural
 neural network network the author suggested that they
 removed the need for segmentation and
 achieved an accuracy of around 98%

Mathematical Biosciences and Engineering Volume 19, Issue 7, 6415–6434.
6419

3. Methodology

3.1. Augmentation

 Image data augmentation is used to increase the image dataset by modifying and doing image
processing operations. By using data augmentation we generated multiple images with the help of
transformations and geometric operations, changing brightness and other augmentation techniques [17].
An input image is transferred to a data augmentation function where affine transformations [18] are
applied to each image. A random number is selected between the range provided for rotation, scaling,
translation, shearing, flipping horizontally as well as vertically. Rotation operation may rotate pixels
out of the image frame and make some empty place which is to be filled. For filling empty areas we
use padding. Along with these affine transformations, some Guassian blur is introduced [19]. Laplacian
and Gaussian Noise are added to the input image and images are also generated by changing the
contrast of the images. Other augmentation includes sharpening images by using canny filters. This
new batch of images is used for training. Other parameters and their values used for augmentations are
shown below in Table 2.

 Figure 1. Proposed model framework with two workflows.
Mathematical Biosciences and Engineering Volume 19, Issue 7, 6415–6434.
6420

 Table 2. Parameters of data augmentation.

 Parameter of Image Augmentation Values/Range
 Rotation −90 to 90 degree
 Scaling (0.5,0.9) on both axis
 Shear −2 to 2
 Zooming 0.15
 Horizontal Flip True
 Vertical Flip True
 Gaussian Blur Sigma = 1.22
 Hue and Saturation 0.5 to 1.5

3.2. Transfer learning

 Convolutional Neural Network learns features from the input image and finds out features
correlating with each other. Transfer learning is a technique where the pre-trained convolutional neural
network is utilized for training on a new dataset [20]. Training CNN from scratch can be a tedious task
where we need to have the high computational power and the time required to train on a new dataset
is also high. To train from scratch we need a high amount of data so that model learns features that are
important for prediction. But the amount of data available for cervical cancer pap smear images in
open-access is not large. So to overcome this we used transfer learning where models are trained on
the ImageNet dataset which consists of around 1.3 million images belonging to 1000 classes [16].
Some of the model layers are frozen while keeping some layers unfrozen. We train them on a new
image dataset leveraging most of both ImageNet dataset learned features and our dataset learned
features for making a pool of features powerful for more accurate prediction. We used four pre-trained
models namely XceptionNet [21], VGG16 [22], VGG19 [22], ResNet50 [23] which were already
trained on the ImageNet dataset. Most of the generic features that occur in most of the datasets are
already learned by these pre-trained models and for specific features, we train the model again on the
cervical cancer dataset. In this training, most of the layers are frozen and some layers are added for
fine-tuning which include a convolutional block and a fully connected layer. This model is trained for
learning new data-specific features with Adam optimizer [24].

3.2.1. XceptionNet

 The xception model has 71 layers. It is based on depthwise separable convolution. It has three
major parts namely Entry flow, Middle flow, and Exit flow. It is also termed as an extreme version of
Inception. It involves convolution of 1 × 1 followed by spatial convolution of n × n [21].

3.2.2. VGGNet

 The model with both 16 layers and 19 layers achieves around 93% top 5 test accuracy in the
ImageNet challenge. They have a large kernel with multiple 3 × 3 filters one after the other. In our
work, we fine-tuned both our dataset using Adam optimizer and Rectified Linear Unit (ReLU)
activation function. VGG19 has three additional convolutional layers than VGG16. Since they use

Mathematical Biosciences and Engineering Volume 19, Issue 7, 6415–6434.
6421

ReLU, both do not use Local Response Normalization (LRN) as it might increase training time making
it slow and also increasing memory consumption [22].

3.2.3. ResNet50

 It is 50 layers deep with 48 convolutional layers and 1 max pool and average pool layer each.
ResNet overcomes the problem of saturation and degrading of accuracy due to a large number of layers
additionally added. Authors of ResNet addressed this issue by deep residual learning technique referred
to as skip connection [23].

3.3. Deep feature extraction

 Feature extraction plays an important part in the classification of images since it helps the model
to predict output class [25]. Concatenating features obtained from the mentioned models and utilizing
them is an efficient approach. Concatenating features will help to make use of information gained
through multiple models and will contribute more to prediction than initial individual features. There
can be multiple ways to concatenate features obtained from the model like serially adding features
with respect to the vector dimension or parallel concatenating using some imaginary component. But
the shortcoming of such techniques is that the features obtained after concatenating like this lead to
loss of old feature values as new features are being created. In our approach, we concatenate the 1024
features from the dense layer of each model and pass it to the concatenate layer where it forms a vector
of 4096 dimensions. This 4096 dimension vector is extracted in the form of vectors as deep features to
be used on various classifiers like support vector machine, random forest classifier and fully connected
neural network classifier.

3.4. Workflow 1

 As shown in Figure 1, two approaches for prediction on the image are given. In the first approach
labeled as workflow 1 following steps are performed:
 (1) Passing the deep feature vector to Principal Component Analysis for reducing the number of
features without losing their prominence of the features. The reduced feature vector obtained after
principal component analysis helps in faster execution and less memory consumption [26].
 (2) The output of PCA is given to three classifiers namely Support Vector Machine [27], Random
Forest [28] and Fully connected Neural Network [29].
 (3) The classifier’s predictions are then passed to the voter. The output of maximum voting is the
predicted class of the image.

3.5. Principal component analysis (PCA)

 PCA is used to reduce dimensions by projecting the data points into a few principal components
by keeping as much of the variation of the data as possible [30]. For implementing principal component
analysis scikit-learn python library is used [31]. PCA in scikit-learn does linear dimension reduction
by utilizing singular value decomposition [32] to project the data onto a lower-dimensional space. The
data passed to PCA is centered for each of the feature values before singular value decomposition can

Mathematical Biosciences and Engineering Volume 19, Issue 7, 6415–6434.
6422

be applied. PCA in scikit-learn uses the method proposed by Halko et al. in 2009 [33]. It uses the linear
algebra package LAPACK for a randomized truncated singular value decomposition. The Singular
Value Decomposition (SVD) solver parameter we used depended on the input shape and number of
components passed. To run full singular value decomposition we selected components by post-
processing from the standard LAPACK solver [34]. In PCA covariance matrix is calculated from the
input feature data as in Eq (1). Then an eigenvector is computed which has eigenvalues. Eigenvalues
of the vector have the biggest say in the making of a new feature vector of reduced dimensionality. To
avoid loss of important features we use the eigenvalues to preserve 95% of the variance. In scikit-learn
the number of components are estimated from the input data based on the threshold between 0 and 1
is passed for the variance among the features.

 covariance matrix = ∑ × ( ) (1)

 If completed principal component of the vector which is the processed coordinates
which can be allocated a score = × where is the eigenvector of the matrix of
covariance then PCA can be formulated as = where Z is vector and is the eigenvalues of
the matrix of covariance.

3.6. Ensemble of classifiers

 The information-rich features obtained from PCA are then passed through classifiers for prediction.
For classification of pap smear images, the ensemble of classifiers consisting of Support Vector Machine
(SVM) classifier with linear kernel [27], Random Forest classifier with tree size of 1500 [28] and a Fully
connected neural network with dense layer and softmax activation function [29] are used.
 Support Vector Machine (SVM) algorithm is one of the popular supervised learning algorithms
which can be used for both classifications as well as regression. It separates classes in the pattern space
using hyperplanes. SVM selects points in this space that give maximum margin from the line dividing
two classes. Such extreme points are termed as support vectors and thus the algorithm is known as a
Support Vector Machine.
 In addition to SVM, we also have used the Random Forest (RF) classifier which is an ensemble
model that makes decision trees based on a subset of features. Multiple random trees are made and
thus a stable and more accurate prediction is obtained in RF classifiers. RF itself uses a majority
ranking method to prevent possible overfitting. Both SVM and RF classifiers were implemented using
the scikit-learn library. In a random forest, we used 1500 trees. Higher the trees mean that we will get
better results but this can make computation utilization more and slow the process. So we decided to
have a stable number after experimentation that will provide enough stability to the prediction.
 A Fully Connected Neural Network (FCNN) created from scratch is also used for the
classification of pap smear images. Here a neural network with a dropout rate of 50%, batch
normalization and a dense layer with a softmax activation function is used. The newly constructed
neural network is compiled with Adam optimizer at a learning rate of 10 . This FCNN is then trained
and used for prediction, hyperparameters used for neural network classifiers are as shown in Table 3.

Mathematical Biosciences and Engineering Volume 19, Issue 7, 6415–6434.
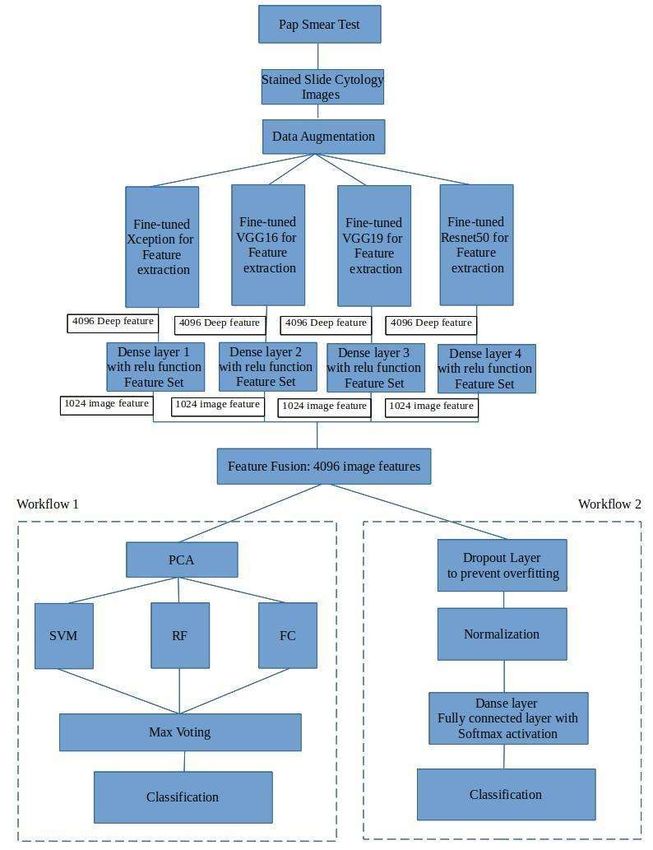
6423

 Table 3. Hyperparameter values of fully connected neural network classifier.

 Hyperparameter Value

 Input shape As per PCA (number of components)

 Optimizer Adam

 Learning Rate 10

 Dropout Rate 50%

 Loss Function Mean squared error

 Number of epochs 5 or 20

 Batch size 32

3.7. Maximum voting and classification

 To predict the final prediction of the ensemble classifier, the maximum voting approach is
used [35]. The ensemble of the three classifiers using maximum voting is independent of bias and
is more stable. The misclassification of individual classifiers is normalized and the accuracy of
prediction is improved. The final prediction of the model is done by estimating the mode of the set
of individual predictions.

 Figure 2. Workflow-2 of the proposed model framework.

Mathematical Biosciences and Engineering Volume 19, Issue 7, 6415–6434.
6424

3.8. Workflow 2

 In workflow 2 as shown in Figure 2, the deep features extracted from the pap smear images from
four pre-trained CNN models using transfer learning are used. The features are extracted as mentioned
in the subsection on Deep Feature Extraction given earlier. The 4,096 image features obtained are
passed to a sequential model of a traditional fully connected artificial neural network (ANN). A
dropout layer with an input shape of 4,096 features and a rate of 50% is added and a batch
normalization layer that maintains the mean and standard deviation of features to 0 and 1 respectively.
After normalization, a dense layer with an output shape of 2 and softmax activation function is added.
This model is compiled with the features obtained from frozen layers of pre-trained models. Additional
parameters include the Adam optimizer and categorical cross-entropy loss function and trained with
backpropagation to learn and predict the class of test images. The hyperparameters used in the different
pre-trained models and ANN trained on deep features are as shown below in Table 4. The model is
trained on the feature fusion vector obtained from pre-trained models and then predictions are done
based on the output probabilities estimated by the output layer of ANN.

 Table 4. Hyperparameters used in ANN.

 Newly added
 Hyperparameter XceptionNet VGG16 VGG19 Resnet50
 layers (ANN)

 Optimizer Adam Adam Adam Adam Adam

 Categorical Categorical Categorical Categorical Categorical
 Loss function
 cross-entropy cross-entropy cross-entropy cross-entropy cross entropy

 Learning rate 10 10 10 10 10

 Batch size 32 32 32 32 32

 Layers 71 16 19 50 Ensemble + 3

 Pooling 3 × 3 max pool 2 × 2 max pool 2 × 2 max pool 3 × 3 max pool Ensemble

 Activation ReLU ReLU ReLU ReLU softmax

 Epochs 5 or 20 5 or 20 5 or 20 5 or 20 5 or 20

4. Dataset

 The dataset is made ready for implementation in two steps- (1) Data acquisition from publicly
available sources, (2) Data Pre-processing which includes converting varying class datasets into 2
classes namely Normal and Abnormal cells denoting non-cancerous and cancerous lesion presence
respectively. To have uniformity for comparison among the datasets, the multi-class dataset is
converted into a binary class. The datasets used for the experimentation on the proposed model
framework are (a) Herlev Pap Smear cytology dataset [36,37], (b) Sipakmed Pap Smear dataset [38,39]
and (c) LBC dataset of pap smear [40,41].
 (a) Herlev Pap Smear dataset is collected from Herlev University Hospital, Denmark. The dataset
has multiple versions and here is the improved version which was formed in 2005 is used. It is a seven-

Mathematical Biosciences and Engineering Volume 19, Issue 7, 6415–6434.
6425

class dataset and it is converted into two classes of normal and abnormal. Seven classes are Normal,
Intermediate squamous, Columnar, Mild dysplasia, Moderate dysplasia, Severe dysplasia and
Carcinoma in situ [36].
 (b) Sipakmed Pap Smear dataset is a five-class dataset of isolated cells. These cells are classified
as superficial-intermediate cells, parabasal cells, koilocytotic cells, Dysketarotic cells and Metaplastic
cells depending upon the morphological properties of the cells [38]
 (c) Liquid-Based Cytology (LBC) Dataset is made available by the Institute of Advanced Study
in Science and Technology, Guwahati and Guwahati Medical College and Hospital. The dataset is a
multi-cell dataset where images contain frames from the microscopic slide, whereas the Herlev and
Sipakmed dataset we used contains single-cell images. The dataset is classified into four classes
namely Negative for Intraepithelial Lesion or Malignancy (NILM), Low-grade squamous
intraepithelial lesion (LSIL), High grade squamous intraepithelial lesion (HSIL) and Squamous cell
carcinoma (SCC) [40].

 Table 5. Distribution of dataset of the three datasets used in our experimentation.

 Dataset Category Class Number of images

 Normal squamous 74

 Intermediate squamous 70
 Normal
 Columnar 98

 Herlev Mild dysplasia 182

 Moderate dysplasia 146

 Severe dysplasia Abnormal 197

 Carcinoma in situ 150

 Superficial 831

 Parabasal Normal 787

 SipakMed Koilocytotic 825

 Dyskeratotic 813
 Abnormal
 Metaplastic 793

 NILM Normal 613

 LSIL 163
 LBC
 HSIL Abnormal 113

 SCC 74

Mathematical Biosciences and Engineering Volume 19, Issue 7, 6415–6434.
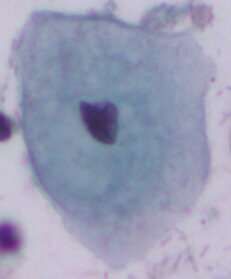
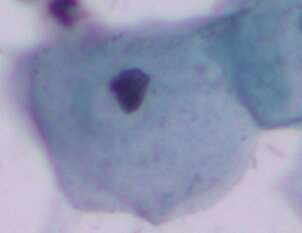
6426

 As all the datasets are converted into two classes, distribution on the dataset is given in Table 5
for Herlev, Sipakmed and LBC datasets.

 Figure 3. Normal class sample images from Herlev dataset.

 Figure 4. Abnormal class sample images from Herlev dataset.

 Figure 5. Normal class sample images from Sipakmed dataset.

 Figure 6. Abnormal class sample images from Sipakmed dataset.
Mathematical Biosciences and Engineering Volume 19, Issue 7, 6415–6434.
6427

 Figure 7. Normal class sample images from LBC dataset.

 Figure 8. Abnormal class sample images from LBC dataset.

 Few sample images from the adopted datasets are as shown. Figures 3 and 4 show images from
Herlev dataset with normal and abnormal class respectively [37]. Figures 5 and 6 show images from
Sipakmed dataset with normal and abnormal class respectively [39] and Figures 7 and 8 show images
from LBC dataset with normal and abnormal class respectively [41].

5. Experimental setup

 For experimentation, online available Google colaboratory is used, which is a cloud-based service
used here to train and test on the proposed model framework. In Google colaboratory, python 3 along
with supported libraries like Tensorflow, Keras, Opencv are used. It provides a runtime GPU hardware
accelerator to execute deep learning [42].

6. Results and discussion

 The dataset used for experimentation is partitioned into 75% as training and 25% as testing images
data. For evaluating the performance of the DeepCyto, different performance measures including
accuracy, precision, recall and F-1 score are used [43]. The definition of the assessment metrics used
is listed in Table 6.

Mathematical Biosciences and Engineering Volume 19, Issue 7, 6415–6434.
6428

 Table 6. Evaluation metrics and their definition and formula.

 Evaluation Metric Definition and Formula

 Accuracy (A) It is correctly classified images from the total number of images

 ,

 where TP is True Positive and FP is False Positive

 Precision (P) It is the total number of True Positive (TP) divided by the total number of positive
 prediction

 +
 Recall (R) It is the total number of Positive images correctly classified as Positive divided by
 the total number of Positive images

 +
 F-1 score (F1) It is a weighted average of Precision and Recall
 ×
 2 ×
 +

 In experimentation of the DeepCyto model with both the workflows, feature fusion vectors are
extracted by using stated pre-trained models. These vectors are given as input to both workflows.

 Table 7. Performance of DeepCyto with 5 epochs.

 Dataset ⇒ Herlev Sipakmed LBC

 Classifier/
 A P R F1 A P R F1 A P R F1
 Model

 SVM 76.63 75 77 76 96.91 97 97 97 59.58 61 60 60

 RF 87.50 89 88 86 96.35 96 96 96 60.58 57 60 57

 FCNN 79.89 80 80 77 71.56 72 72 71 61.13 58 61 58

 Voting-
 87.09 99 85 91 96.92 98 98 97 60.79 56 44 40
 Ensemble

 ANN 97.23 97 94 95 99.71 99 99 99 100 100 100 100

 The results of these are given in Tables 7–10. Tables 7 and 8 depict the classification performance
of individual classifiers, their ensemble, and ANN with 5 epochs and 20 epochs respectively. Tables 9,10
depicts the confusion matrices of the ensembles with 5 and 20 epochs respectively. Table 11 and 12
depict the confusion matrices of the ANN with 5 and 10 epochs respectively.

Mathematical Biosciences and Engineering Volume 19, Issue 7, 6415–6434.
6429

 Table 8. Performance of DeepCyto with 20 epochs.

 Dataset ⇒ Herlev Sipakmed LBC

 Classifier/
 A P R F1 A P R F1 A P R F1
 Model

 SVM 79.89 79 80 79 89.75 99 99 99 94.30 99 99 99

 RF 86.41 86 86 86 99.57 96 96 96 98.48 92 92 91

 FCNN 87.50 89 88 86 80.67 85 81 79 78.23 78 78 77

 Voting-
 87.90 99 86 92 88.95 99 84 90 92.26 82 98 89
 Ensemble

 ANN 97.95 98 97 97 99.71 99 99 99 100 100 100 100

 From Tables 7 and 8, it can be observed that among the three ML classifiers of Workflow-I,
namely SVM, RF and FCNN, RF has given the better performance for almost all the datasets. Also,
the Voting ensemble has given a better performance than each of the individual Workflow-I machine
learning models for all the datasets.
 In Table 7, for LBC datasets, all the Workflow-I ML classifiers and even the ensemble have given
significantly less results for 5 epochs. This is due to the fact that, for multi-cell images of LBCs, five
epochs are not enough for extracting informative feature vectors. This is improved in Table 8 with 20
epochs. In this case, performance on LBCs is improved than in Table 8. For other than LBCs, both
tables show the most similar performance of ML classifiers and their ensemble.
 ANN Classifier of Workflow-2 has given the best performances for 5 epochs as well as for 20
epochs on all three datasets. In summary, the combination of pre-trained models for feature fusion
followed by the ANN classifiers is the best modality for the classification of pap smear cytology
images. Also, it is just a two-step process consisting of feature extraction and training the ANN
classifier. Moreover, it is best suited for single as well as multi-cell images. It is applicable for both
conventional pap smear images as well as LBC images.
 To illustrate the performance of our models following confusion matrices of the test data are as
shown below.
 Among the two workflows, higher accuracy is achieved in the second workflow where ANN is
used. From the confusion matrices, we observe that the ANN model performed best for LBC where
the normal class is in majority over the abnormal class. In Herlev and Sipakmed abnormal class is in
majority and it is classified with accuracy above 97 and 99% respectively for both 5 and 20 epochs.

 Table 9. Confusion matrices of the workflow-1. Voting ensemble classifier on test data
 with 5 epochs: a. Herlev, b. Sipakmed, c. LBC.

 a b c
 Abnormal Normal Abnormal Normal Abnormal Normal
 Abnormal 134 22 Abnormal 420 11 Abnormal 24 31
 Normal 1 27 Normal 10 273 Normal 46 92

Mathematical Biosciences and Engineering Volume 19, Issue 7, 6415–6434.
6430

 Table 10. Confusion matrices of the workflow-1. Voting ensemble classifier on test data
 with 20 epochs: a. Herlev, b. Sipakmed, c. LBC.

 a b c
 Abnormal Normal Abnormal Normal Abnormal Normal
 Abnormal 135 23 Abnormal 429 77 Abnormal 57 1
 Normal 0 26 Normal 1 207 Normal 13 122

 Table 11. Confusion matrices of the workflow-2. Artificial neural network classifier on
 test data with 5 epochs: a. Herlev, b. Sipakmed, c. LBC.

 a b c
 Abnormal Normal Abnormal Normal Abnormal Normal
 Abnormal 134 4 Abnormal 429 1 Abnormal 70 0
 Normal 1 45 Normal 1 283 Normal 0 123

 Table 12. Confusion matrices of the workflow-2. Artificial neural network classifier on
 test data with 20 epochs: a. Herlev, b. Sipakmed, c. LBC.

 a b c
 Abnormal Normal Abnormal Normal Abnormal Normal
 Abnormal 133 2 Abnormal 429 1 Abnormal 70 0
 Normal 2 47 Normal 1 283 Normal 0 123

 The comparative analysis of the voting ensemble model and the Artificial Neural Network
approach is given in Table 13. For both 5 and 20 epochs, the ANN model has outperformed the rest of
the individual as well as voting ensemble classifiers.

 Table 13. Accuracy on a test set using both approaches on all three datasets.

 Dataset ⇓ Voting Ensemble Model Artificial Neural Network
 5 epochs 20 epochs 5 epochs 20 epochs
 Herlev 87.09 87.90 97.23 97.95
 Sipakmed 96.92 88.95 99.71 99.71
 LBC 60.79 92.26 100 100

5. Conclusions and future work

 The proposed framework DeepCyto presented in this paper has two workflows for the
classification of pap smear images. Both of these workflows classify the pap smear images based on
the feature fusion vectors extracted by a set of pre-trained models. The strength of the DeepCyto lies
in the informative features extraction and is followed by accurate classification. The best accuracy
achieved is 97% on the Herlev dataset, 99% on the Sipakmed dataset and 100% on the LBC dataset.
The reason behind a high accuracy for Sipkamed is also due to the even distribution of images in the
two classes. ANN has achieved the highest accuracy on Liquid-Based Cytology. The highest
accuracies are given by the ANN trained on feature fusion vectors extracted by a set of pre-trained

Mathematical Biosciences and Engineering Volume 19, Issue 7, 6415–6434.
6431

models. By considering the overall performance on all datasets together, DeepCyto has given better
performance as compared to the existing methods found in the literature. Additionally, the DeepCyto
works evenly on single-cell as well as multi-cell images. Even with fewer epochs, workflow-2 has
outperformed on LBC multi-cell images. In summary, the DeepCyto is an effective, accurate and two-
step simple methodology consisting of extraction of feature fusion vectors and classification of single
as well as multi-cell pap smear images even with a lesser number of epochs. One of the future works
on this framework is tuning the machine learning ensemble models to provide higher accuracy. The
limitations of this work include the computation cost and the ability of the model to handle overlapping
multi-cell images. So our proposed framework can be generalized for overlapping cell prediction.
Along with this, pap smear images contain a lot of distortion in image quality. Improving image quality
without losing morphological information can be implemented to improve the accuracy of the models.

Acknowledgments

 The work is supported by the Department of Science and Technology, Government of India under
Biomedical Device and Technology Development scheme.

Conflict of interest

 All authors declare no conflicts of interest in this paper.

References

1. M. Arbyn, E. Weiderpass, L. Bruni, S. de Sanjosé, M. Saraiya, J. Ferlay, et al., Estimates of
 incidence and mortality of cervical cancer in 2018: a worldwide analysis, Lancet Global Health,
 8 (2020), e191–e203. https://doi.org/10.1016/S2214-109X(19)30482-6
2. R. Hull, M. Mbele, T. Makhafola, C. Hicks, S. Wang, R. M. Reis, et al., Cervical cancer in low
 and middle‑income countries (Review), Oncol. Lett., 20 (2020), 2058–2074.
 https://doi.org/10.3892/ol.2020.11754
3. W. William, A. Ware, A. H. Basaza-Ejiri, J. Obungoloch, A pap-smear analysis tool (PAT) for
 detection of cervical cancer from pap-smear images, Biomed. Eng. Online, 18 (2019), 16.
 https://doi.org/10.1186/s12938-019-0634-5
4. R. Li, C. Xiao, Y. Huang, H. Hassan, B. Huang, Deep learning applications in computed deep
 learning applications in computed tomography images for pulmonary nodule detection and
 diagnosis: A review, 12 (2022), 298. https://doi.org/10.3390/diagnostics12020298
5. H. Hassan, Z. Ren, H. Zhao, S. Huang, D. Li, S. Xiang, et al., Review and classification of AI-
 enabled COVID-19 CT imaging models based on computer vision tasks, Comput. Biol. Med., 141
 (2022), 105123. https://doi.org/10.1016/j.compbiomed.2021.105123
6. O. Holmström, N. Linder, H. Kaingu, N. Mbuuko, J. Mbete, F. Kinyua, et al., Point-of-care digital
 cytology with artificial intelligence for cervical cancer screening in a resource-limited setting,
 JAMA Network Open, 4 (2021). http://doi.org/10.1001/jamanetworkopen.2021.1740
7. B. Nithya, V. Ilango, Evaluation of machine learning based optimized feature selection
 approaches and classification methods for cervical cancer prediction, SN Appl. Sci., 1 (2019).
 https://doi.org/10.1007/s42452-019-0645-7

Mathematical Biosciences and Engineering Volume 19, Issue 7, 6415–6434.
6432

8. J. Deng, W. Dong, R. Socher, L. J. Li, K. Li, F. Li, ImageNet: A large-scale hierarchical image
 database, in 2009 IEEE Conference on Computer Vision and Pattern Recognition, (2009), 248–
 255. https://doi.org/10.1109/CVPR.2009.5206848
9. M. Rahaman, C. Li, Y. Yao, F. Kulwa, X. Wu, X. Li, et al., DeepCervix: a deep learning-based
 framework for the classification of cervical cells using hybrid deep feature fusion techniques,
 Comput. Biol. Med., 136 (2021), 104649. https://doi.org/10.1016/j.compbiomed.2021.104649
10. H. Basak, R. Kundu, S. Chakraborty, N. Das, Cervical cytology classification using PCA and
 GWO enhanced deep features selection, SN Comput. Sci., 2 (2021), 369.
 https://doi.org/10.1007/s42979-021-00741-2
11. T. Chankong, N. Theera-Umpon, S. Auephanwiriyakul, Automatic cervical cell segmentation and
 classification in Pap smears, Comput. Methods Programs Biomed,, 113 (2014), 539–556.
 https://doi.org/10.1016/j.cmpb.2013.12.012
12. W. William, A. Ware, A. H. Basaza-Ejiri, J. Obungoloch, A pap-smear analysis tool (PAT) for
 detection of cervical cancer from pap-smear images, BioMed. Eng. OnLine, 18 (2019), 16.
 https://doi.org/10.1186/s12938-019-0634-5
13. J. Byriel, Neuro-fuzzy classification of cells in cervical smears, Master's Thesis, Technical
 University of Denmark, 1999.
14. L. Zhang, H. Kong, C. T. Chin, S. Liu, X. Fan, T. Wang, et al., Automation-assisted cervical
 cancer screening in manual liquid-based cytology with hematoxylin and eosin staining, Cytometry,
 85 (2014), 214–230. https://doi.org/10.1002/cyto.a.22407
15. Y. Marinakis, G. Dounias, J. Jantzen, Pap smear diagnosis using a hybrid intelligent scheme
 focusing on genetic algorithm based feature selection and nearest neighbor classification, Comput.
 Biol. Med., 39 (2009), 69–78. https://doi.org/10.1016/j.compbiomed.2008.11.006
16. L. Zhang, L. Lu, I. Nogues, R. M. Summers, S. Liu, J. Yao, DeepPap: Deep convolutional
 networks for cervical cell classification, IEEE J. Biomed. Health Inf., 21 (2017), 1633–1643.
 https://doi.org/10.1109/JBHI.2017.2705583
17. C. Shorten, T. M. Khoshgoftaar, A survey on image data augmentation for deep learning, J. Big
 Data, 6 (2019), 60. https://doi.org/10.1186/s40537-019-0197-0
18. R. Hataya, J. Zdenek, K. Yoshizoe, H. Nakayama, Faster autoaugment: Learning augmentation
 strategies using backpropagation, in Computer Vision-ECCV 2020-16th European Conference,
 2020, 12370 (2020). https://doi.org/10.1007/978-3-030-58595-2_1
19. R. Ogawa, T. Kido, T. Kido, T. Mochizuki, Effect of augmented datasets on deep convolutional
 neural networks applied to chest radiographs, Clin. Radiol., 74 (2019), 697–701.
 https://doi.org/10.1016/j.crad.2019.04.025
20. T. Kaur, T. K. Gandhi, Deep convolutional neural networks with transfer learning for automated
 brain image classification, Mach. Vision Appl., 31 (2020), 20. https://doi.org/10.1007/s00138-
 020-01069-2
21. F. Chollet, Xception: Deep learning with depthwise separable convolutions, in Proceedings of the
 IEEE Conference on Computer Vision and Pattern Recognition, (2017), 1251–1258.
 https://doi.org/10.48550/arXiv.1610.02357
22. K. Simonyan, A. Zisserman, Very deep convolutional networks for large-scale image recognition,
 preprint, arXiv:1409.1556.
23. K. He, X. Zhang, S. Ren, J. Sun, Deep residual learning for image recognition, In Proceedings of
 the IEEE Conference on Computer Vision and Pattern Recognition, (2016), 770–778.

Mathematical Biosciences and Engineering Volume 19, Issue 7, 6415–6434.
6433

24. D. Kingma, J. Ba, Adam: A method for stochastic optimization, preprint, arXiv:1412.6980v9.
25. J. V. Kriti, R. Agarwal, Deep feature extraction and classification of breast ultrasound images,
 Multimed Tools Appl., 79 (2020), 27257–27292. https://doi.org/10.1007/s11042-020-09337-z
26. S. P. Mishra, U. Sarkar, S. Taraphder, S. Datta, D. P. Swain, R. Saikhom, et al., Principal
 component analysis, Int. J. Livest. Res., 7 (2017), 60–78.
 https://doi.org/10.5455/ijlr.20170415115235
27. J. Cervantes, F. Garcia-Lamont, L. Rodríguez-Mazahua, A. Lopez, A comprehensive survey on
 support vector machine classification: Applications, challenges and trends, Neurocomputing, 408
 (2020), 189–215. https://doi.org/10.1016/j.neucom.2019.10.118
28. L. Breiman, Random forests, Mach. Learn., 45 (2001), 5–32.
 https://doi.org/10.1023/A:1010933404324
29. S. H. S. Basha, S. R. Dubey, V. Pulabaigari, S. Mukherjee, Impact of fully connected layers on
 performance of convolutional neural networks for image classification, Neurocomputing, 378
 (2020), 112–119. https://doi.org/10.1016/j.neucom.2019.10.008
30. A. Maćkiewicz, W Ratajczak, Principal components analysis (PCA), Comput. Geosci., 19 (1993),
 303–342. https://doi.org/10.1016/0098-3004(93)90090-R
31. E. Bisong, Introduction to Scikit-learn. in Building Machine Learning and Deep Learning Models
 on Google Cloud Platform, USA press, Berkeley, CA, 2019. https://doi.org/10.1007/978-1-4842-
 4470-8_18
32. M. E. Wall, A. Rechtsteiner, L. M. Rocha, Singular value decomposition and principal component
 analysis, in A Practical Approach to Microarray Data Analysis, Springer, Boston, MA, (2003),
 91–109. https://doi.org/10.1007/0-306-47815-3_5
33. N. Halko, P. G. Martinsson, J. A. Tropp, Finding structure with randomness: Probabilistic
 algorithms for constructing approximate matrix decompositions, SIAM Rev., 53 (2011), 217–288.
 https://doi.org/10.1137/090771806
34. sklearn decomposition PCA, scikit-learn documentation, 2022. Available from: https://scikit-
 learn.org/stable/modules/generated/sklearn.decomposition.PCA.html.
35. A. S. Assiri, S. Nazir, S. A. Velastin, Breast tumor classification using an ensemble machine
 learning method, J. Imaging, 6 (2020), 39. https://doi.org/10.3390/jimaging6060039
36. J. Jantzen, J. Norup, G. Dounias, B. Bjerregaard, Pap-smear benchmark data for pattern
 classification, Nat. Inspired Smart Inf. Syst., 2005 (2005), 1–9.
37. Pap-Smear Databases and Related Studies, 2022. Available from: http://mde-
 lab.aegean.gr/index.php/downloads.
38. M. E. Plissiti, P. Dimitrakopoulos, G. Sfikas, C. Nikou, O. Krikoni, A. Charchanti, Sipakmed: A
 new dataset for feature and image based classification of normal and pathological cervical cells
 in Pap smear images, in IEEE International Conference on Image Processing (ICIP) 2018, (2018),
 3144–3148. https://doi.org/10.1109/ICIP.2018.8451588
39. SIPakMed Database, 2022. Available from: https://www.cs.uoi.gr/~marina/sipakmed.html.
40. E. Hussain, L. B. Mahanta, H. Borah, C. R. Das, Liquid based-cytology Pap smear dataset for
 automated multi-class diagnosis of pre-cancerous and cervical cancer lesions, Data Brief, 30
 (2020), 105589. https://doi.org/10.1016/j.dib.2020.105589
41. Liquid based cytology pap smear images for multi-class diagnosis of cervical cancer, 2022.
 Available from: https://data.mendeley.com/datasets/zddtpgzv63/4.

Mathematical Biosciences and Engineering Volume 19, Issue 7, 6415–6434.
6434

42. Google colab, Google colaboratory, 2022. Available from:
 https://research.google.com/colaboratory/.
43. A. Tharwat, Classification assessment methods, Appl. Comput. Inf., 17 (2020), 168–192.
 https://doi.org/10.1016/j.aci.2018.08.003

 ©2022 the Author(s), licensee AIMS Press. This is an open access
 article distributed under the terms of the Creative Commons
 Attribution License (http://creativecommons.org/licenses/by/4.0)

Mathematical Biosciences and Engineering Volume 19, Issue 7, 6415–6434.
You can also read