Data-driven Model Generalizability in Crosslinguistic Low-resource Morphological Segmentation
←
→
Page content transcription
If your browser does not render page correctly, please read the page content below
Data-driven Model Generalizability in Crosslinguistic Low-resource
                                                               Morphological Segmentation

                                                              Zoey Liu                              Emily Prud’hommeaux
                                                    Department of Computer Science               Department of Computer Science
                                                           Boston College                               Boston College
                                                        zoey.liu@bc.edu                              prudhome@bc.edu

                                                              Abstract                         with one particular data set that is deemed rep-
                                                                                               resentative. The models are usually trained and
                                             Common designs of model evaluation typi-          evaluated using a predefined split of training/test
                                             cally focus on monolingual settings, where
                                                                                               tests (with or without a development set), or using
                                             different models are compared according to
arXiv:2201.01845v2 [cs.CL] 11 Apr 2022

                                             their performance on a single data set that is    cross-validation. Given the results from the test
                                             assumed to be representative of all possible      set, authors typically conclude that certain mod-
                                             data for the task at hand. While this may be      els are better than others (Devlin et al., 2019), re-
                                             reasonable for a large data set, this assump-     port that one model is generally suitable for par-
                                             tion is difficult to maintain in low-resource     ticular tasks (Rajpurkar et al., 2016; Wang et al.,
                                             scenarios, where artifacts of the data collec-    2018; Kondratyuk and Straka, 2019), or state that
                                             tion can yield data sets that are outliers, po-   large pretrained models have “mastered" linguistic
                                             tentially making conclusions about model
                                                                                               knowledge at human levels (Hu et al., 2020).
                                             performance coincidental. To address these
                                             concerns, we investigate model generalizabil-        Consequently, the “best" models, while not al-
                                             ity in crosslinguistic low-resource scenarios.    ways surpassing other models by a large mar-
                                             Using morphological segmentation as the           gin, are subsequently cited as the new baseline or
                                             test case, we compare three broad classes of      adopted for state-of-the-art comparisons in follow-
                                             models with different parameterizations, tak-     up experiments. These new experiments might not
                                             ing data from 11 languages across 6 language
                                                                                               repeat the comparisons that were carried out in the
                                             families. In each experimental setting, we
                                             evaluate all models on a first data set, then     work that identified the best model(s). This model
                                             examine their performance consistency when        might be extended to similar tasks in different do-
                                             introducing new randomly sampled data sets        mains or languages, regardless of whether these
                                             with the same size and when applying the          new tasks have characteristics comparable to those
                                             trained models to unseen test sets of varying     where the model was demonstrated to be effective.
                                             sizes. The results demonstrate that the ex-
                                                                                                  That being said, just because a self-proclaimed
                                             tent of model generalization depends on the
                                             characteristics of the data set, and does not
                                                                                               authentic Chinese restaurant is very good at cook-
                                             necessarily rely heavily on the data set size.    ing orange chicken, that does not mean its orange
                                             Among the characteristics that we studied,        chicken will be delicious on every visit to the restau-
                                             the ratio of morpheme overlap and that of         rant. Similarly, common implementations of model
                                             the average number of morphemes per word          comparisons have been called into question. Re-
                                             between the training and test sets are the two    cent work by Gorman and Bedrick (2019) (see
                                             most prominent factors. Our findings sug-         also Szymański and Gorman (2020) and Søgaard
                                             gest that future work should adopt random
                                                                                               et al. (2021)) analyzed a set of the best part-of-
                                             sampling to construct data sets with differ-
                                             ent sizes in order to make more responsible       speech (POS) taggers using the the Wall Street Jour-
                                             claims about model evaluation.                    nal (WSJ) from the Penn Treebank (Marcus et al.,
                                                                                               1993). They demonstrated inconsistent model per-
                                                                                               formance with randomly generated splits of the
                                         1   Introduction                                      WSJ data in contrast to the predefined splits as
                                         In various natural language processing (NLP) stud-    used in previous experiments (Collins, 2002).
                                         ies, when evaluating or comparing the performance        Others (see Linzen (2020) for a review) have
                                         of several models for a specific task, the current    argued that the majority of model evaluations are
                                         common practice tends to examine these models         conducted with data drawn from the same distri-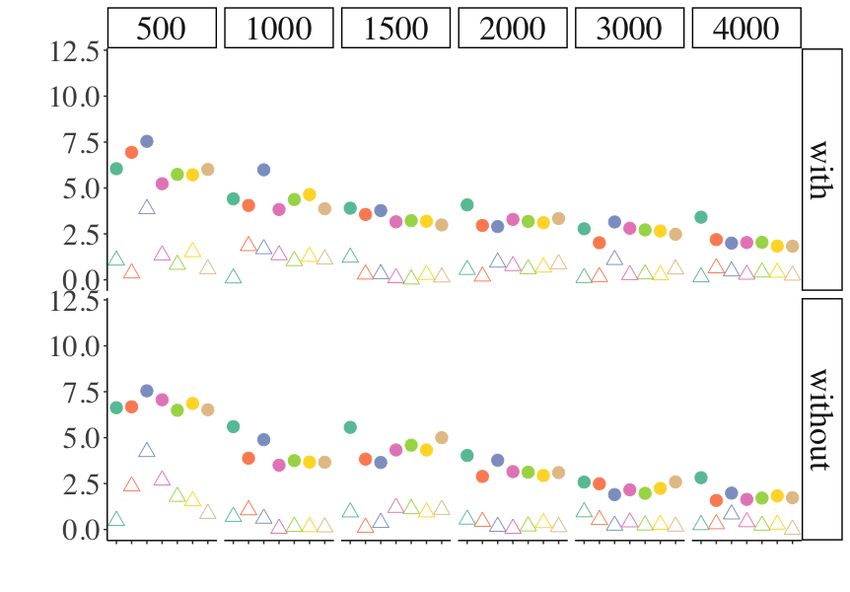
bution – that is, the training and the test sets bear     not outperform other candidates when facing new
considerable resemblance in terms of their statisti-      data. Continuing the Chinese restaurant analogy,
cal characteristics – and therefore these models will     the same orange chicken recipe might not turn out
not generalize well to new data sets from different       well with a new shipment of oranges.
domains or languages (McCoy et al., 2019, 2020;              As an empirical illustration of our concerns
Jia and Liang, 2017). In other words, to evaluate         raised above, this paper studies model generaliz-
the authenticity of a Chinese restaurant, one would       ability in crosslinguistic low-resource scenarios.
need to not only try the orange chicken, but also         For our test case, we use morphological segmen-
order other traditional dishes.                           tation, the task of decomposing a given word into
   Previous work on model evaluation, however,            individual morphemes (e.g., modeling → model +
has focused on high-resource scenarios, in which          ing). In particular, we focus on surface segmen-
there is abundant training data. Very little effort has   tation, where the concatenation of the segmented
been devoted to exploring whether the performance         sub-strings stays true to the orthography of the
of the same model will generalize in low-resource         word (Cotterell et al., 2016b).1 This also involves
scenarios (Hedderich et al., 2021; Ramponi and            words that stand alone as free morphemes (e.g.,
Plank, 2020). Concerns about model evaluation             free → free).
and generalizability are likely to be even more              Leveraging data from 11 languages across six
fraught when there is a limited amount of data            language families, we compare the performance
available for training and testing.                       consistency of three broad classes of models (with
                                                          varying parameterizations) that have gained in pop-
   Imagine a task in a specific domain or language
                                                          ularity in the literature of morphological segmen-
that typically utilizes just one specific data set,
                                                          tation. In each of the low-resource experimental
which is common in low-resource cases. We will
                                                          settings (Section 6.1), we ask:
refer to the data set as the first data set. When this
first data set is of a reasonable size, it may well be    (1) To what extent do individual models generalize
the case (though it might not be true) that the data is       to new randomly sampled data sets of the same
representative of the population for the domain or            size as the first data set?
language, and that the training and the test sets are
drawn more or less from the same distribution. The        (2) For the model that achieves the best results
performance of individual models and the rankings             overall across data sets, how does its perfor-
of different models can be expected to hold, at the           mance vary when applied to new test sets of
very least, for new data from the same domain.                different sizes?
   Now unfold that supposition to a task in a spe-        2       Prior Work: Model Generalizability
cific domain or language situated in a low-resource
scenario. Say this task also resorts to just one par-     A number of studies have noted inconsistent per-
ticular data set, which we again call the first data      formance of the same models across a range of
set. Considering the limitation that the data set         generalization and evaluation tasks. For example,
size is relatively small, one might be skeptical of       McCoy et al. (2020) demonstrated that the same
the claim that this first data set could represent        pretrained language models, when paired with clas-
the population distribution of the domain or lan-         sifiers that have different initial weights or are fine-
guage. Accordingly, within the low-resource sce-          tuned with different random seeds, can lead to dras-
nario, model evaluations obtained from just the first     tically unstable results (McCoy et al., 2019). This
data set or any one data set could well be coinci-        pattern seems to hold for both synthetic (Weber
dental or random. These results could be specific         et al., 2018; McCoy et al., 2018) and naturalis-
to the characteristics of the data set, which might       tic language data (Zhou et al., 2020; Reimers and
not necessarily reflect the characteristics of the do-    Gurevych, 2017). Using approximately 15,000
main or language more broadly given the small                 1
                                                               This includes segmentation for both inflectional and
size of the data. This means that even within the         derivational morphology; we used the term “sub-strings",
same domain or language, the same model might             since not all elements in the segmented forms will be a
                                                          linguistically-defined morpheme due to the word formation
not perform well when applied to additional data          processes. Therefore surface segmentation is in opposition
sets of the same sizes beyond the first data set, and     to canonical segmentation; see Cotterell et al. (2016b) for
the best models based on the first data set might         detailed descriptions of the differences between the two tasks.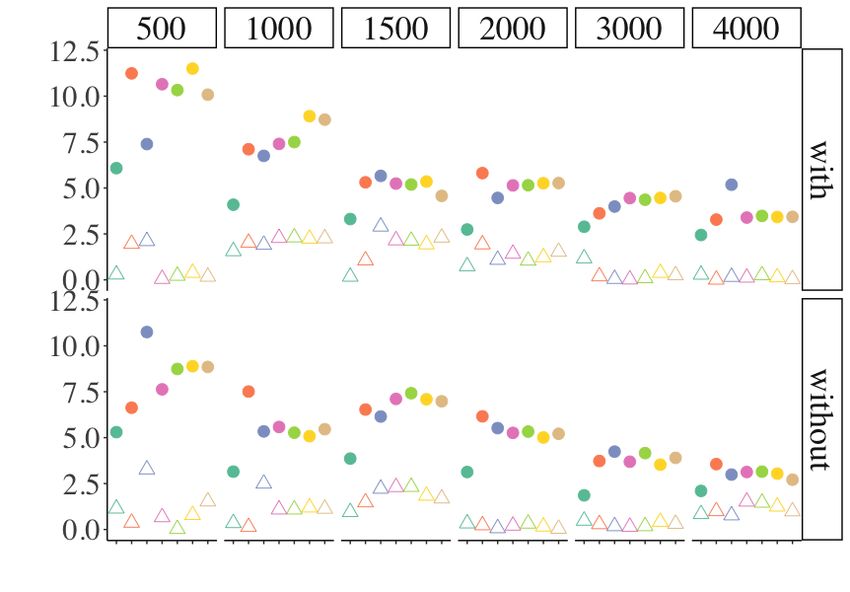
artificial training examples, Lake and Baroni            3   Morphological Surface Segmentation
(2018) showed that sequence-to-sequence models
                                                         Why morphological surface segmentation? First,
do not generalize well with small data sets (see
                                                         previous work has demonstrated that morpholog-
also Akyurek and Andreas (2021)). Through a
                                                         ical supervision is useful for a variety of NLP
series of case studies, Dodge et al. (2019) demon-
                                                         tasks, including but not limited to machine transla-
strated that model performance showed a differ-
                                                         tion (Clifton and Sarkar, 2011), dependency pars-
ent picture depending on the amount of compu-
                                                         ing (Seeker and Çetinoğlu, 2015), bilingual word
tation associated with each model (e.g., number
                                                         alignment (Eyigöz et al., 2013), and language mod-
of iterations, computing power). They suggested
                                                         eling (Blevins and Zettlemoyer, 2019). For lan-
that providing detailed documentation of results on
                                                         guages with minimal training resources, surface
held-out data is necessary every time changes in
                                                         or subword-based segmentation is able to effec-
the hyperparameters are applied.
                                                         tively mitigate data sparsity issues (Tachbelie et al.,
    Another line of research has focused on test-        2014; Ablimit et al., 2010). For truly low-resource
ing the generalizability of large language mod-          cases, such as endangered and indigenous lan-
els with controlled psycholinguistic stimuli such        guages, morpheme-level knowledge has the poten-
as subject-verb agreement (Linzen et al., 2016),         tial to advance development of language technolo-
filler-gap dependencies (Wilcox et al., 2019) and        gies such as automatic speech recognition (Afify
garden-path sentences (Futrell et al., 2019), where      et al., 2006) in order to facilitate community lan-
the stimuli data share statistical similarities with     guage documentation.
the training data of the language models to differ-         Second, information about morphological struc-
ent degrees (Wilcox et al., 2020; Hu et al., 2020;       tures is promising for language learning. Especially
Thrush et al., 2020). This targeted evaluation           for indigenous groups, prior studies have proposed
paradigm (Marvin and Linzen, 2018; Linzen and            incorporating morphological annotation into the
Baroni, 2021) tends to compare model performance         creation of online dictionaries as well as preparing
to behaviors of language users. It has been claimed      teaching materials, with the goal of helping the
that this approach is able to probe the linguistic ca-   community’s language immersion programs (Gar-
pabilities of neural models, as well as shed light on    rett, 2011; Spence, 2013).
humans’ ability to perform grammatical generaliza-          Third, despite its utility in different tasks, semi-
tions. Thus far, related studies have mainly investi-    linguistically informed subword units are not as
gated English, with notable exceptions of crosslin-      widely used as they might be, since acquiring la-
guistic extensions to other typologically diverse        beled data for morphological segmentation in gen-
languages, such as Hebrew (Mueller et al., 2020),        eral, including the case of surface segmentation, re-
Finnish (Dhar and Bisazza, 2021), and Mandarin           quires extensive linguistic knowledge from native
Chinese (Wang et al., 2021; Xiang et al., 2021).         or advanced speakers of the language. Linguistic
  As fruitful as the prior studies are, they are         expertise can be much more difficult to find for
mostly targeted towards evaluating models that           critically endangered languages, which, by defini-
have access to large or at least reasonable amount       tion (Meek, 2012), are spoken by very few people,
of training data. In contrast, there is, as yet, no      many of whom are not native speakers of the lan-
concrete evidence regarding whether and to what          guage. These aforementioned limitations necessi-
extent models generalize when facing limited data.       tate better understanding of the performance for
   Additionally, although recent work has proposed       different segmentation models and how to reliably
different significance testing methods in order to       estimate their effectiveness.
add statistical rigor to model evaluations (Gorman
                                                         4   Meet the Languages
and Bedrick, 2019; Szymański and Gorman, 2020;
Dror et al., 2018), most tests make assumptions on       A total of eleven languages from six language fam-
the distributional properties or the sampling pro-       ilies were invited to participate in our experiments.
cess of the data (e.g., data points are sampled inde-    Following recently proposed scientific practices for
pendently (Søgaard, 2013)), and a number of these        computational linguistics and NLP (Bender and
tests such as bootstrapping are not suitable when        Friedman, 2018; Gebru et al., 2018), we would
data set size is extremely small due to lack of power    like to introduce these languages and their data sets
(see also Card et al. (2020)).                           explored in our study (Table 1).
First we have three indigenous languages character-based Seq2seq recurrent neural network
from the Yuto-Aztecan language family (Baker, (RNN) (Elman, 1990). Previous work (Kann et al.,
1997), including Yorem Nokki (Southern di- 2018; Liu et al., 2021) has demonstrated that this
alect) (Freeze, 1989) spoken in the Mexican model is able to do well for polysynthetic indige-
states of Sinaloa and Sonora, Nahuatl (Oriental nous languages even with very limited amount of
branch) (de Suárez, 1980) spoken in Northern data. Consider the English word papers as an il-
Puebla, and Wixarika (Gómez and López, 1999) lustration. With this word as input, the task of the
spoken in Central West Mexico. These three Mexi- Seq2seq model is to perform:
can languages are highly polysynthetic with agglu-
papers → paper + s.
tinative morphology. The data for these languages
was originally digitized from the book collections As we are interested in individual models, the
of Archive of Indigenous Language. Data collec- training setups are constant for the data of all lan-
tions were carried out and made publicly available guages. We adopted an attention-based encoder-
by the authors of Kann et al. (2018) given the nar- decoder (Bahdanau et al., 2015) where the en-
ratives in their work. coder consists of a bidirectional gated recurrent
Next are four members from the Indo-European unit (GRU) (Cho et al., 2014), and the decoder is
language family: English, German, Persian, and composed of a unidirectional GRU. The encoder
Russian, all with fusional morphological character- and the decoder both have two hidden layers with
istics. The data for English was provided by the 100 hidden states in each layer. All embeddings
2010 Morpho Challenge (Kurimo et al., 2010), a have 300 dimensions. Model training was car-
shared task targeted towards unsupervised learning ried out with OpenNMT (Klein et al., 2017), using
of morphological segmentation. The German data ADADELTA (Zeiler, 2012) and a batch size of 16.
came from the CELEX lexical database (Baayen Order-k CRF The second guest is the order-
et al., 1996) and was made available by Cot- k CRF (hereafter k-CRF) (Lafferty et al., 2001;
terell et al. (2015). The Persian data from Ansari Ruokolainen et al., 2013), a type of log-linear dis-
et al. (2019a) (see also Ansari et al. (2019b)) con- criminative model that treats morphological seg-
tains crowd-sourced annotations, while the data mentation as an explicit sequence tagging task.
for Russian was extracted from an online dictio- Given a character wt within a word w, where t is
nary (Sorokin and Kravtsova, 2018). the index of the character, CRF gradually predicts
The remaining languages each serve as a repre- the label yt of the character from a designed feature
sentative of a different language family. The data set xt that is composed of local (sub-)strings.
sets for Turkish from the Turkic language family In detail, k-CRF takes into consideration the la-
and Finnish from the Uralic language family were bel(s) of k previous characters in a word (Cuong
again provided by the 2010 Morpho Challenge (Ku- et al., 2014; Cotterell et al., 2015). This means
rimo et al., 2010). The data collection for both Zulu that when k = 0 (i.e., 0-CRF), the label yt is de-
and Indonesian was carried out by Cotterell et al. pendent on just the feature set xt of the current
(2015). The Zulu words were taken from the Uk- character wt . On the other hand, when k ≥ 1, in
wabelana Corpus (Spiegler et al., 2010), and the our settings, the prediction of yt is context-driven
segmented Indonesian words were derived via ap- and additionally considers a number of previous
plication of a rule-based morphological analyzer to labels {yt−k , ..., yt−1 }.
an Indonesian-English bilingual corpus.2 All four Prior work (Vieira et al., 2016) (see also Mueller
of these languages have agglutinative morphology. et al. (2013)) has claimed that, with regards to
choosing a value of k, 2-CRF usually yields good
5 Meet the Models results; increasing k from 0 to 1 leads to large im-
provements, while increasing from 1 to 2 results
We compared three categories of models: sequence- in a significant yet weaker boost in model perfor-
to-sequence (Seq2seq) (Bahdanau et al., 2015), mance. With that in mind, we investigated five
conditional random field (CRF) (Lafferty et al., different values of k (k = {0, 1, 2, 3, 4}).
2001), and Morfessor (Creutz and Lagus, 2002). In training the CRFs, the feature set for every
Seq2seq The first guest in our model suite is a character in a word is constructed as follows. Each
2
https://github.com/desmond86/ word is first appended with a start (hwi) and an end
Indonesian-English-Bilingual-Corpus (h/wi) symbol. Then every position t of the wordLanguage Language family Morphological feature(s) N of types Data set sizes New test set sizes
in initial data
Yorem Nokki Yuto-Aztecan Polysynthetic 1,050 {500, 1,000} —
Nahuatl Polysynthetic 1,096 {500, 1,000} —
Wixarika Polysynthetic 1,350 {500, 1,000} {50, 100}
English Indo-European Fusional 1,686 {500, 1,000, 1,500} {50, 100}
German Fusional 1,751 {500, 1,000, 1,500} {50, 100}
Persian Fusional 32,292 {500, 1,000, 1,500 {50, 100, 500, 1,000}
2,000, 3,000, 4,000}
Russian Fusional 95,922 {500, 1,000, 1,500} {50, 100, 500, 1,000}
2,000, 3,000, 4,000}
Turkish Turkic Agglutinative 1,760 {500, 1,000, 1,500} {50, 100}
Finnish Uralic Agglutinative 1,835 {500, 1,000, 1,500} {50, 100}
Zulu Niger-Congo Agglutinative 10,040 {500, 1,000, 1,500} {50, 100, 500, 1,000}
2,000, 3,000, 4,000}
Indonesian Austronesian Agglutinative 3,500 {500, 1,000, 1,500} {50, 100, 500}
2,000, 3,000}
Table 1: Descriptive statistics for the languages in our experiments. Data set sizes apply to both sampling
strategies (with and without replacement). New test set sizes (sampled without replacement) refer to the
different sizes of constructed test sets described in Section 6.2.
is assigned a label and a feature set. The feature fications. Model parameters were estimated with
set consists of the substring(s) occurring both on L-BFGS (Liu and Nocedal, 1989) and L2 regular-
the left and on the right side of the current position ization. Again, the training setups were kept the
up to a maximum length, δ. As a demonstration, same for all languages.
take the same English word above (papers) as an Supervised Morfessor The last participat-
example. For the third character p in the word, ing model is the supervised variant of Morfes-
with δ having a value of 3, the set of substrings on sor (Creutz and Lagus, 2002; Rissanen, 1998)
the left and right side would be, respectively, {a, which uses algorithms similar to those of the semi-
pa, hwipa} and {p, pe, per}. The concatenation of supervised variant (Kohonen et al., 2010), except
these two sets would be the full feature set of the that given our crosslinguistic low-resource scenar-
character p. In our experiments, we set δ to have a ios, we did not resort to any additional unlabeled
constant value of 4 across all languages. data. For the data of every language, all Morfessor
Depending on the position index t and the mor- models were trained with the default parameters.
pheme that this index occurs in, each character can In the remainder of this paper, to present clear
have one of six labels: {START (start of a word), narratives, in cases where necessary, we use the
B (beginning of a multi-character morpheme), M term model alternative(s) to refer to any of the
(middle of a multi-character morpheme), E (end of seven alternatives: Morfessor, Seq2seq, 0-CRF, 1-
a multi-character morpheme), S (single-character CRF, 2-CRF, 3-CRF and 4-CRF.
morpheme), END (end of a word)}. Therefore,
papers has the following segmentation label rep- 6 Experiments
resentation, and the training objective of the CRF
6.1 Generalizability across data sets
model is to learn to correctly label each character
given its corresponding feature set. Our first question concerns the generalizability of
hwi p a p e r s h/wi results from the first data set across other data sets
START B M M M E S END of the same size. For data set construction, we
In our study, all linear-chain CRFs were imple- took an approach similar to the synthetic method
mented with CRFsuite (Okazaki, 2007) with modi- from Berg-Kirkpatrick et al. (2012). Given the ini-tial data for each language, we first calculated the If a particular model A is indeed better than
number of unique word types; after comparing this alternative B based on results from the first data
number across languages, we decided on a range set, we would expect to see that hold across the
of data set sizes that are small in general (Table 1), 50 data sets. In addition, the model ranking drawn
then performed random sampling to construct data from the first data set would be the same for the
sets accordingly. other data sets as well.
The sampling process is as follows, using Rus- While we examined the results of all metrics, for
sian as an example. For each data set size (e.g., the sake of brevity, we focus on F1 scores when
500), we randomly sampled words with replace- presenting results (Section 7).3
ment to build one data set of this size; this data
set was designated the first data set; and then an- 6.2 Generalizability across new test sets
other 49 data sets were sampled in the same way. In addition to evaluating model performance across
We repeated a similar procedure using sampling the originally sampled data sets of the same sizes,
without replacement. Each sampled data set was we also investigated the generalizability of the best
randomly assigned to training/test sets at a 3:2 ratio, model alternatives from Section 6.1 when facing
five times. In what follows, we use the term experi- new unseen test sets. Taking into consideration the
mental setting to refer to each unique combination type counts of the initial data for every language
of a specific data set size and a sampling strategy. and the sizes of their sampled data sets in our ex-
Compared to Berg-Kirkpatrick et al. (2012), our periments, a range of test set sizes that would be
data set constructions differ in three aspects. First, applicable to all data set sizes was decided, shown
our sampling strategies include both with and with- in Table 1. (Note that no new test sets were cre-
out replacement in order to simulate realistic set- ated for Yorem Nokki and Nahuatl, since it would
tings (e.g., real-world endangered language doc- be feasible for these two languages only when the
umentation activities) where the training and the data set size is 500.) Then, for every data set, we
test sets may or may not have overlapping items. selected all unique words from the initial data that
Second, in each augmented setting with a specific did not overlap with those in the data set. From
sampling strategy and a data set size, a total of 250 these words, given a test set size, we performed
models were trained given each model alternative random sampling without replacement 100 times.
(5 random splits ∗ 50 data sets); this contrasts with In other words, each data set had correspondingly
the number of models for different tasks in Berg- 100 new test sets of a particular size.
Kirkpatrick et al. (2012), ranging from 20 for word After constructing new test sets, for each experi-
alignment to 150 for machine translation. Third, mental setting, we picked the overall best perform-
we aim to build data sets of very small sizes to suit ing model alternative based on average observa-
our low-resources scenarios. tions across the 50 data sets from Section 6.1. For
For every model trained on each random split, each data set, this model alternative was trained
five metrics were computed to evaluate its perfor- five times (via 5 random splits). The trained mod-
mance on the test set: full form accuracy, mor- els were then evaluated with each of the 100 new
pheme precision, recall, and F1 (Cotterell et al., test sets for the data set and the same five met-
2016a; van den Bosch and Daelemans, 1999), and rics of segmentation performance were computed.
average Levenshtein distance (Levenshtein, 1966). Again, due to space constraints, we focus on F1 in
The average of every metric across the five random presentations of the results.
splits of each data set was then computed. For each
experimental setting, given each metric, we mea- 7 Results
sured the consistency of model performance from 7.1 A Walk-through
the first data set as follows:
To demonstrate the two ways of evaluating model
generalizability outlined above, take Russian again
(1) the proportion of times the best model alterna-
as an example, when the data set size is 2,000 and
tive based on the first data set is the best across
the evaluation metric is F1 score. For the first
the 50 data sets;
data set, when sampled with replacement, the best
(2) the proportion of times the model ranking of 3
Code and full results are in quarantine at https://
the first data set holds across the 50 data sets. github.com/zoeyliu18/orange_chicken.(a) Generalizability of results from the
first data set across the 50 data sets.
(b) Generalizability across test sets of sizes {50, 100, 500, 1,000}
Figure 1: Generalizability results for the Russian example in Section 7.1.
Sampling Model Avg. F1 for Avg. F1 across F1 range across F1 std. across % of times
the first data set the 50 data sets the 50 data sets the 50 data sets as the best model
with Morfessor 34.61 36.52 (34.61, 38.36) 0.76 0
replacement
0-CRF 58.75 59.59 (57.83, 62.65) 0.87 0
1-CRF 74.20 75.38 (73.93, 76.66) 0.65 14
2-CRF 74.02 75.46 (74.02, 76.68) 0.65 22
3-CRF 73.71 75.48 (73.71, 76.52) 0.67 14
4-CRF 74.06 75.54 (74.06, 76.73) 0.68 38
Seq2seq 74.26 74.86 (73.48, 76.45) 0.85 12
without Morfessor 34.16 36.04 (34.16, 38.17) 0.88 0
replacement
0-CRF 59.10 59.41 (57.15, 60.95) 0.96 0
1-CRF 74.62 75.08 (73.72, 76.72) 0.72 18
2-CRF 74.53 75.15 (73.75, 76.89) 0.81 16
3-CRF 74.60 75.18 (73.77, 76.76) 0.79 18
4-CRF 74.48 75.21 (73.79, 77.14) 0.83 38
Seq2seq 74.00 74.39 (72.54, 76.99) 0.89 10
Table 2: Summarization statistics of model performance for the Russian example in Section 7.1.
model is Seq2seq, achieving an average F1 score 50 data sets is 18%. The best model ranking is
of 74.26. As shown in Figure 1a, the proportion of 1-CRF > 3-CRF > 2-CRF > 4-CRF > Seq2seq >
times Seq2seq is the best model across the 50 data 0-CRF > Morfessor, and this pattern accounts for
sets is 12%. The model performance ranking for 2% of all model rankings considering the 50 data
the first data set is Seq2seq > 1-CRF > 4-CRF > sets together.
2-CRF > 3-CRF > 0-CRF > Morfessor, a ranking
Taking a closer look at the performance of each
that holds for 2% of all 50 data sets.
model for the first data set given each sampling
By comparison, when the first data set was sam- strategy (Table 2), while the average F1 scores of
pled without replacement, the best model is 1-CRF Morfessor and 0-CRF are consistently the lowest,
with an average F1 score of 74.62; the proportion the performance of the other models is quite simi-
of times this model has the best results across the lar; the difference of F1 scores between each pairof models is less than one. mer and the highest average score of the latter. For Now turn to patterns across the 50 data sets as instance, when using morpheme precision and sam- a whole. It seems that for the Russian example, pling with replacement, the difference ranges from whether sampling with or without replacement, the 1.98 for Seq2seq to 4.00 for Morfessor; with full best model is instead 4-CRF (Table 2), which is form accuracy and sampling without replacement, different from the observations derived from the the difference spans from 2.12 for 0-CRF to 4.78 respective first data set of each sampling method. for Morfessor. The differences in the proportion of times 4-CRF Given each sampling method, we applied the ranks as the best model and that of other model al- 250 trained models of the best performing model ternatives are quite distinguishable, although their alternative across the 50 data sets (Table 2) to new mean F1 scores are comparable except for Mor- test sets of four different sizes. As presented in Fig- fessor and 0-CRF. With CRF models, it does not ure 1b, for this Russian example, the distributions appear to be the case that a higher-order model of the F1 scores demonstrate variability to different leads to significant improvement in performance. extents for different test set sizes. When the data Comparing more broadly, CRF models are better was sampled with replacement, the results are the overall than the Seq2seq models. most variable with a test set size of 50, where the In spite of the small differences on average be- F1 scores span from 57.44 to 90.46; and the least tween the better-performing model alternatives, ev- variable F1 scores are derived when the test set size ery model alternative presents variability in its per- is 1,000, ranging from 70.62 to 79.36. On the other formance: the score range (i.e., the difference of the hand, the average F1 across the different test sizes highest and the lowest metric score across the 50 is comparable, spanning from 75.30 when the test data sets of each experimental setting) spans from size is 50 to 75.41 when the test size is 500. Again, 2.66 for 2-CRF to 2.97 for Seq2seq. The difference we observed similar results when the data sets were between the average F1 for the first data set and the sampled without replacement. highest average F1 score of the other 49 data sets is also noticeable. When sampling with replacement, 7.2 An overall look the value spans from 2.19 for Seq2seq to 3.90 for The results for the data sets of all languages were 0-CRF; and when sampling without replacement, analyzed in exactly the same way as described for the value ranges from 1.85 for 0-CRF to 2.99 for the Russian example given in Section 7.1. When Seq2seq. not considering how different the average F1 score In contrast, in this Russian example, we see a dif- of each model alternative is compared to every ferent picture for each model alternative if compar- other alternative within each experimental setting ing their results for the first data set to the averages (82 settings in total; 41 for each sampling method), across all the data sets instead; the largest mean F1 in most of the settings the performance of the model difference computed this way is 1.91 when sam- alternatives for the first data set is not consistent pling with replacement, and 1.89 for sampling with- across the other data sets; the proportions of cases out replacement, both from scores of Morfessor; where the best model alternative of the first data set and these difference values are smaller than the holds for the other 49 data sets are mostly below score range from all data sets. 50%, except for most of the cases for Zulu (data While we focused on F1 scores, we analyzed the set size > 1,000) where the proportion values ap- other four metrics in the same way. Given each met- proximate 100%. The observations for model rank- ric, the generalizability of the observations from ings are also quite variable; the proportion of times the first data set, regardless of the specific score the model ranking of the first data set stays true of each model alternative and their differences, is across the 50 data sets ranges from 2% for those still highly variable; the most generalizable case, in Russian containing 2,000 words sampled with where the best model from the first data set holds replacement, to 56% for data sets in Zulu including across the 50 data sets, is relying on full form ac- 4,000 words sampled without replacement. (The curacy when sampling with replacement (36%). high variability derived this way persists despite of When contrasting results from the first data set to the particular metrics applied.) the other 49 data sets, there are again noticeable Considering all the experimental settings, when differences between the average score of the for- sampling with replacement, the two best perform-
(a) Distribution of average F1 score range.

          (b) Distribution of the difference between the average F1 score of the first data set and that
          across all 50 data sets.

Figure 2: Some distribution statistics of the average F1 score of all models across all experimental settings.

ing models for the first data sets are 4-CRF (13           put. Previous work has tried to alleviate this prob-
/ 41 = 31.71%) and Seq2seq (36.59%); 2-CRF                 lem via multi-task learning (Kann et al., 2018; Liu
(26.83%) and 4-CRF (36.59%) are more favourable            et al., 2021), where, in addition to the task of mor-
if sampling without replacement. The differences           phological segmentation, the model is also asked to
between the best model alternatives are in general         learn to output sequences that are exactly the same
small; the largest difference score between the top        as the input. We opted not to explore multi-task
and second best models is 1.89 for data sets in            learning here in order to have more experimental
Zulu with 1,500 words sampled with replacement.            control for data across languages.
Across the 50 data sets within each setting, overall          When analyzing the performance range of the
higher-order CRFs are the best performing models.          models, we see variability as well. Figure 2a
                                                           presents the distribution of F1 score ranges aggre-
   Similar findings of performance by different
                                                           gating the results for all the models across all ex-
model alternatives were observed for other met-
                                                           perimental settings; the score ranges of individual
rics as well, except for average Levenshtein dis-
                                                           model alternatives are additionally demonstrated in
tance where CRF models are consistently better
                                                           Figure 3. Larger score ranges exist especially when
than Seq2seq, even though the score differences
                                                           data sets have a size of 500, irrespective of the spe-
are mostly small. This is within expectation given
                                                           cific model (whether it is non-neural or neural). For
that our task is surface segmentation, and Seq2seq
                                                           example, 3-CRF has a score range of 11.50 for data
models are not necessarily always able to “copy"
                                                           in Persian sampled with replacement and the range
every character from the input sequence to the out-
(a) Yorem Nokki (b) Nahuatl (c) Wixarika
(d) English (e) German
(f) Persian (g) Russian
(h) Turkish (i) Finnish
(j) Zulu (k) Indonesian
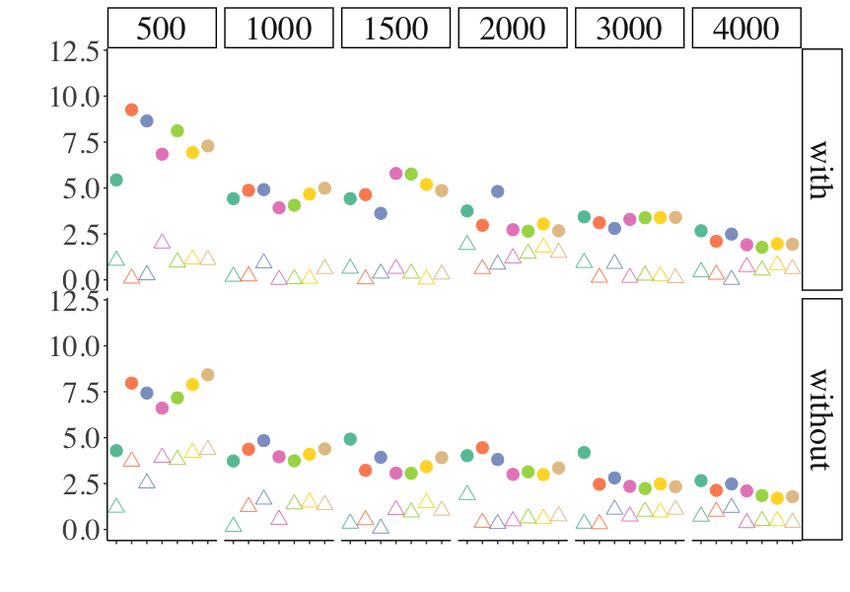
Figure 3: Some summary statistics for the performance of all models across all experimental settings.
Within each setting, circle represents the average F1 score range; variability exists in the score range
regardless of the model alternative applied or the data set size, though the range appears to be larger when
data set sizes are small. By comparison, triangle represents the difference between the average F1 score of
the first data set and that across all 50 data sets; the values of the differences seem to be more noticeable
when data set sizes are small, yet these differences are in general smaller than the score range.of Seq2seq in this setting is 11.24. As the data set 6.87, such as the case with Indonesian when the
sizes increase, the score ranges become smaller. data set size is 3,000 sampled without replacement
Across all experimental settings, we also ana- and the test set size is 500, to approximately 48.59,
lyzed the difference between the average F1 score as is the case for Persian when the data set size is
of the first data set and that across all 50 data sets 500 sampled with replacement and the test set size
(Figure 2b). While in most of the cases the differ- is 50. That being said, as in the Russian example,
ences for the same model alternative are very small, the average results among the different test sizes for
the values of the differences appear to be more dis- each setting of every language are also comparable
tinguishable when the data set size is small. On the to each other.4
other hand, as shown in Figure 3, these differences
are by comparison (much) smaller than the aver- 7.3 Regression analysis
age F1 score range (the triangles are consistently One question arises from the aforementioned find-
below the circles), an observation that also aligns ings: why is there variable performance for each
with what we have seen from the Russian example. model alternative across all the experimental set-
Again, similar results hold for the other four tings of each language? With the observations in
evaluation metrics as well; different model alter- our study thus far, it seems that the results are de-
natives demonstrate large score range across all pendent on the data set size or test set size. But
experimental settings regardless of the particular is that really the case, or is sample size simply a
metric. As an illustration, we performed linear confounding factor?
regression modeling analyzing the relationships be- To address the questions above, we studied sev-
tween other evaluation metrics and the average F1 eral data characteristics and how they affect model
score. Take morpheme recall as an example. Given performance. It is important to note that, as dis-
all the data of a language, the regression model cussed in Section 1, we do not wish to claim these
predicts the score range of average morpheme re- features are representative of the full language pro-
call across data sets in an experimental setting as file (e.g., how morphologically complex the lan-
a function of the score range of average F1 in the guage is as a whole). For instance, one might
same experimental setting. The same procedure expect that on average, languages that are agglu-
was carried out for each of the other metrics as tinative or polysynthetic have larger numbers of
well. Significant effects were found (p < 0.01 or morphemes per word when compared to fusional
p < 0.001) for the score range of average F1, indi- languages. While that might be true for cases with
cating strong comparability of model performance ample amounts of data, the same assumption does
in terms of different evaluation metrics. not always seem to be supported by the data sets
In addition, besides average F1, there are also in our experiments. For each experimental setting,
noticeable differences between a given metric score the average number of morphemes per word across
for the first data set and that across all 50 data the 50 data sets of Indonesian (classified as agglu-
sets within each experimental setting, yet these tinative) is mostly comparable to that of Persian
differences are also smaller than the score range. (fusional); on the other hand, in all experimental
Our regression models predicting these differences settings that are applicable, the average number
as a function of the differences of average F1 score of morphemes per word for data sets of Russian
also show significant effects for the latter, again (fusional) is always higher than that for data of the
lending support to the comparability between these Mexican indigenous languages (polysynthetic).
metrics when characterizing model evaluation in These patterns resonate again with the our main
our study here. point, that when data set size is small, the first data
set or just one data set might not suffice to reflect
When we applied the trained models of the over-
the language features overall. Thus here we con-
all best model alternative to new test sets, all set-
tings demonstrate a great amount of variability that 4
In addition to testing the best model alternatives, for every
seems to be dependent on both the size of the data experimental setting of Persian, Russian and Zulu, the three
set used to train the models and that of the new test languages that have the largest range of data set sizes and
new test set sizes in our study, we also experimented with the
sets. The extent of variation does not appear to be second or third best model alternatives based on their average
constrained by the sampling strategy. The differ- performance and computing power. The observations of these
ence in the resulting F1 scores ranges from around alternatives are comparable to those of the best models.Language Word overlap Morpheme overlap Ratio of Avg. N Distance between distributions Ratio of Avg.
of morphemes of N of morphemes morpheme length
Yorem Nokki 11.68** 17.10 13.64** -7.19 4.81
Nahuatl 13.15** 49.56*** 14.22*** -3.16 -1.15
Wixarika 21.57*** 63.69*** -2.58 -0.70 -11.06**
English 9.97** 50.35*** 26.01*** -6.78* 8.44*
German 10.03** 61.09*** 21.44*** 2.29 3.25
Persian 26.90*** 21.56*** 26.15*** -3.82* -3.09
Russian 3.38 69.49*** 11.96*** -2.88** 3.19
Turkish 15.88*** 44.31*** 1.37 -0.73 0.30
Finnish 9.47** 60.58*** 10.49** -1.95 -3.90
Zulu 15.48*** 79.07*** 11.34*** -4.14*** 4.11
Indonesian 8.12* 25.53*** 19.55*** -6.46** 7.64*
Table 3: Regression coefficients for random splits of data sets in all languages; a positive coefficient value
corresponds to higher metric scores; the numbers in bold indicate significant effects; the number of *
suggests significance level: * p < 0.05, ** p < 0.01, *** p < 0.001.
sider the characteristics to be specific to the small Given the components of our regression model, a
data sets in our experiments. For each random split smaller/larger value of the coefficient for the same
(including a training and a test set) of every data factor here does not necessarily mean that this fac-
set, we investigated: (1) word overlap, the propor- tor has a weaker/stronger role. In other words, the
tion of words in the test set that also occur in the coefficients of the same feature are not compara-
training set (only applicable to sampling with re- ble across the data for each language. Rather our
placement); (2) morpheme overlap, the proportion goal is simply to see whether a feature potentially
of morphemes in the test set that also appear in the influences metric scores when other factors are con-
training set; (3) the ratio of the average number of trolled for (e.g., data set size) within the context of
morphemes per word between the training and test the data for every language.
sets; (4) the distance between the distribution of
The regression results are presented in Table 3.
the average number of morphemes per word in the
It appears that the features with the most promi-
training set and that in the test set; for this feature
nent roles are the proportion of morpheme overlap
we used the Wasserstein distance for its ease of
as well as the ratio of the average number of mor-
computation (Arjovsky et al., 2017; Søgaard et al.,
phemes per word. Word overlap also has significant
2021); (5) the ratio of the average morpheme length
effects, though this is applicable only to data sets
per word between the training and the test sets.
sampled with replacement. In comparison, data set
To measure the individual effect of each feature, size does not appear to have significant positive
we used linear regression. Because of the relatively effects in all cases; the exceptions include the data
large number of data sets that we have and our ar- for Yorem Nokki, Nahuatl, Wixarika, and Turkish.
eas of interest, we fit the same regression model to In scenarios where data set size does have an ef-
the data of each language rather than combining the fect, its magnitude is much smaller compared to
data from all languages. The regression predicts the the characteristics in Table 3 that we studied. Thus,
metric scores of all models for each random split while data set size potentially plays a role in the
as a function of the five characteristics, described results, it does not appear to be the sole or even the
above, of the random split. Meanwhile we con- most important factor. The range of model perfor-
trolled for the roles of four other factors: the model mance is more dependent on the specific features
alternatives, the metrics used, sampling methods, of, or what is available in, the data sets. For exam-
and data set size, the latter two of which also had ple, larger training and test sets do not necessarily
interaction terms with the five characteristics. lead to higher morpheme overlap ratio.We adopted similar approaches to investigate the number of morphemes per word does not seem
variability in the results when trained segmentation to exist. The exceptions are Wixarika, where the
models were applied to new test sets of different maximum number of data sets that are splittable
sizes (Section 6.2). In these cases, the five char- this way is 35, for data sets containing 1,000 words
acteristics described before were measured taking sampled without replacement; and certain cases in
into account the training set of the segmentation Finnish, where the maximum number of data sets
model and each of the new test sets (100 in total for suitable for heuristic splitting is 11, when the data
each training set). In contrast to the previous regres- sets have 500 words sampled with replacement.
sion model, since the new test sets were sampled For adversarial splitting, we split each data set
without replacement and since we are focusing on (for five times, as well) via maximization of the
predictions derived from the best model alternative Wasserstein distance between the training and the
(but see Section 7.2), word overlap ratios and the test sets (Søgaard et al., 2021). We then calculated
model alternatives were not included in the regres- the word overlap ratio between the test sets of the
sion. We additionally controlled for the effect of adversarial splits and those from the random splits.
the new test set size. Again the same regression Across most of the experimental settings, the aver-
model was fit to the data of each language. Com- age word overlap ratios center around or are lower
paring the different features, morpheme overlap than 50%. This suggests that the training and test
ratio and the average number of morphemes per sets of adversarial splits are reasonably different
word are again the two most pronounced factors in from those derived after random splits; in other
model performance, while the role of test set size words, these data sets could be split adversarially.
is much less pronounced or even negligible.
While it is not the focus in this study to com-
pare different ways of splitting data, we carried out
7.4 Alternative data splits
adversarial splits for the data of Persian and Rus-
Our experiments so far involved random splits. sian, two of the languages with the largest range of
While the heuristic or adversarial splits proposed data set sizes and new test set sizes. The models
in Søgaard et al. (2021) are also valuable, the suc- applied were second-order and fourth-order CRFs
cess of these methods requires that the same data because of their overall good performance (Sec-
could be split based on heuristics, or be separated tion 7). For each experimental setting, the results
into training/test sets such that their distributions are still highly variable. Compared to splitting data
are as divergent as possible. randomly, the average metric scores of adversarial
To illustrate this point for morphological seg- splits are lower (e.g., the mean difference of the
mentation, we examined the possibility of the data average F1 scores between the two data split meth-
sets being split heuristically and adversarially. For ods is 17.85 across settings for the data of Zulu,
the former, we relied on the metric of the average and 6.75 for the data of Russian), and the score
number of morphemes per word, based on regres- ranges as well as standard deviations are higher.
sion results from Section 7.3. Given each data That being said, the results from these two data
set within every experimental setting, we tried to split methods are, arguably, not directly compara-
automatically find a metric threshold so that the ble, since with adversarial splits the test sets are
words in the data set are able to be separated by constructed to be as different or distant as possible
this threshold into training/test sets at the same 3:2 from the training sets.
ratio, or a similar ratio; words in which the num- When applying the trained models to the same
ber of morphemes goes beyond this threshold were new test sets sampled from Section 6.2, the obser-
placed in the test set. We note that it is important vations are similar to the descriptions above, except
(same as for adversarial splits) that the number of the differences between the two data split methods
words in the resulting training and test sets follows regarding the mean metric scores, score ranges, and
a similar ratio to that for random splits. This is in variances are much smaller. The most pronounced
order to ensure that the size of the training (or the average difference in F1 is approximately 7.0 when
test) set would not be a factor for potential differ- the experimental settings yield small data set sizes.
ences in model performance derived from different On the other hand, within each setting, despite the
data split methods. In most of the data sets across model performance variability, the average results
settings, however, such a threshold for the average of the different test sizes are again comparable.8 Discussion and Conclusion grows, particularly if the experimental settings are
still situated within low-resources scenarios for the
Using morphological segmentation as the test case, task at hand (Hedderich et al., 2021).
we compared three broad classes of models with Lastly, while we did not perform adversarial
different parameterizations in crosslinguistic low- splits for all experimental settings here, for the
resource scenarios. Leveraging data from 11 lan- cases that we have investigated, model performance
guages across six language families, our results from adversarial splits also yields high variability
demonstrate that the best models and model rank- both across data sets of the same size and in new
ings for the first data sets do not generalize well test sets. Though our criteria for heuristic splits
to other data sets of the same size, though the were not applicable with the data explored, we
numerical differences in the results of the better- would like to point out that for future endeavors, it
performing model alternatives are small. In particu- would be necessary to at least check the applicabil-
lar, within the same experimental setting, there are ity of different data splits, as we did in Section 7.4.
noticeable discrepancies in model predictions for As long as the data set possesses the properties that
the first data set compared to the averages across all allow it to be divided by different split methods, it
data sets; and the performance of each model alter- is worthwhile to further explore the influence of
native presents different yet significant score ranges these splits, coupled with random sampling.
and variances. When examining trained models on
new test sets, considerable variability exists in the Acknowledgements
results. The patterns described above speak to our
concerns raised at the beginning, namely, that when We are grateful to the reviewers and the action ed-
facing a limited amount of data, model evaluation itor for their insightful feedback. This material is
gathered from the first data set – or essentially any based upon work supported by the National Science
one data set – could fail to hold in light of new or Foundation under Grant #2127309 to the Comput-
unseen data. ing Research Association for the CIFellows Project,
To remedy the observed inconsistencies in model and Grant #1761562. Any opinions, findings, and
performance, we propose that future work should conclusions or recommendations expressed in this
consider utilizing random sampling from initial material are those of the author(s) and do not nec-
data for more realistic estimates. We draw support essarily reflect the views of the National Science
for this proposal from two patterns in our study. Foundation nor the Computing Research Associa-
First, in each experimental setting, the difference tion.
between the average F1 score of the first data set
and that across all 50 data sets is in general smaller
than the range of the scores. Second, the average References
metric scores across unseen test sets of varying M. Ablimit, G. Neubig, M. Mimura, S. Mori,
sizes in every setting are comparable to each other; T. Kawahara, and A. Hamdulla. 2010. Uyghur
this holds for models trained from random splits morpheme-based language models and ASR. In
and those trained using adversarial splits. ICASSP, pages 581–584.
Therefore, depending on the initial amount of
data, it is important to construct data sets and new Mohamed Afify, Ruhi Sarikaya, Hong-Kwang Jeff
test sets of different sizes, then evaluate models Kuo, Laurent Besacier, and Yuqing Gao. 2006.
accordingly. Even if the size of the initial data On the use of morphological analysis for dialec-
set is small, as is the case with most endangered tal Arabic speech recognition. In Ninth Interna-
languages, it is worthwhile to sample with replace- tional Conference on Spoken Language Process-
ment in order to better understand model perfor- ing.
mance. Based on these observations, it would be
interesting to analyze the potential factors that lead Ekin Akyurek and Jacob Andreas. 2021. Lexi-
to the different degrees of generalization, which con Learning for Few Shot Sequence Modeling.
could in turn provide guidance on what should be In Proceedings of the 59th Annual Meeting of
included or sampled in the training sets in the first the Association for Computational Linguistics
place. Thorough comparisons of different models and the 11th International Joint Conference on
should be encouraged even as the amount of data Natural Language Processing (Volume 1: LongPapers), pages 4934–4946, Online. Association Terra Blevins and Luke Zettlemoyer. 2019. Better
for Computational Linguistics. Character Language Modeling through Morphol-
ogy. In Proceedings of the 57th Annual Meeting
Ebrahim Ansari, Zdeněk Žabokrtský, Hamid Hagh- of the Association for Computational Linguistics,
doost, and Mahshid Nikravesh. 2019a. Per- pages 1606–1613, Florence, Italy. Association
sian Morphologically Segmented Lexicon 0.5. for Computational Linguistics.
LINDAT/CLARIAH-CZ digital library at the
Institute of Formal and Applied Linguistics Antal van den Bosch and Walter Daelemans. 1999.
(ÚFAL), Faculty of Mathematics and Physics, Memory-Based Morphological Analysis. In Pro-
Charles University. ceedings of the 37th Annual Meeting of the As-
sociation for Computational Linguistics, pages
Ebrahim Ansari, Zdeněk Žabokrtský, Mohammad 285–292, College Park, Maryland, USA. Asso-
Mahmoudi, Hamid Haghdoost, and Jonáš Vidra. ciation for Computational Linguistics.
2019b. Supervised Morphological Segmentation
Using Rich Annotated Lexicon. In Proceedings Dallas Card, Peter Henderson, Urvashi Khandel-
of the International Conference on Recent Ad- wal, Robin Jia, Kyle Mahowald, and Dan Ju-
vances in Natural Language Processing (RANLP rafsky. 2020. With Little Power Comes Great
2019), pages 52–61, Varna, Bulgaria. INCOMA Responsibility. In Proceedings of the 2020 Con-
Ltd. ference on Empirical Methods in Natural Lan-
guage Processing (EMNLP), pages 9263–9274,
Martin Arjovsky, Soumith Chintala, and Léon Bot- Online. Association for Computational Linguis-
tou. 2017. Wasserstein generative adversarial tics.
networks. In International conference on ma-
chine learning, pages 214–223. PMLR. Kyunghyun Cho, Bart van Merriënboer, Caglar
Gulcehre, Dzmitry Bahdanau, Fethi Bougares,
R Harald Baayen, Richard Piepenbrock, and Leon Holger Schwenk, and Yoshua Bengio. 2014.
Gulikers. 1996. The CELEX lexical database Learning Phrase Representations using RNN
(cd-rom). Encoder–Decoder for Statistical Machine Trans-
lation. In Proceedings of the 2014 Conference
Dzmitry Bahdanau, Kyung Hyun Cho, and Yoshua on Empirical Methods in Natural Language
Bengio. 2015. Neural machine translation by Processing (EMNLP), pages 1724–1734, Doha,
jointly learning to align and translate. In 3rd Qatar. Association for Computational Linguis-
International Conference on Learning Represen- tics.
tations, ICLR 2015.
Ann Clifton and Anoop Sarkar. 2011. Combin-
Mark C Baker. 1997. Complex predicates and ing Morpheme-based Machine Translation with
agreement in polysynthetic languages. Complex Post-processing Morpheme Prediction. In Pro-
predicates, pages 247–288. ceedings of the 49th Annual Meeting of the Asso-
ciation for Computational Linguistics: Human
Emily M. Bender and Batya Friedman. 2018. Data Language Technologies, pages 32–42, Portland,
Statements for Natural Language Processing: To- Oregon, USA. Association for Computational
ward Mitigating System Bias and Enabling Bet- Linguistics.
ter Science. Transactions of the Association for
Computational Linguistics, 6:587–604. Michael Collins. 2002. Discriminative Training
Methods for Hidden Markov Models: Theory
Taylor Berg-Kirkpatrick, David Burkett, and Dan and Experiments with Perceptron Algorithms.
Klein. 2012. An Empirical Investigation of Sta- In Proceedings of the 2002 Conference on Em-
tistical Significance in NLP. In Proceedings of pirical Methods in Natural Language Process-
the 2012 Joint Conference on Empirical Meth- ing (EMNLP 2002), pages 1–8. Association for
ods in Natural Language Processing and Com- Computational Linguistics.
putational Natural Language Learning, pages
995–1005, Jeju Island, Korea. Association for Ryan Cotterell, Arun Kumar, and Hinrich Schütze.
Computational Linguistics. 2016a. Morphological Segmentation Inside-Out.You can also read