Daily Research Reports - Khandwala Securities Limited
←
→
Page content transcription
If your browser does not render page correctly, please read the page content below

Caution ahead.
                                                                          Below Nifty’s biggest 17557 support, obstacles abound.

                                                                          The gyan mantra for the day is to be highly selective.
                                                                          Bullish Stocks: Nippon Life, SAIL and TCS on any
                                                                          sharp declines.

                            Daily Research Reports
Disclosures and Disclaimer : This report must be read with the disclosures in the Disclosure appendix,
and with the Disclaimer, which forms part of it. This document does not contain any investment views or opinions.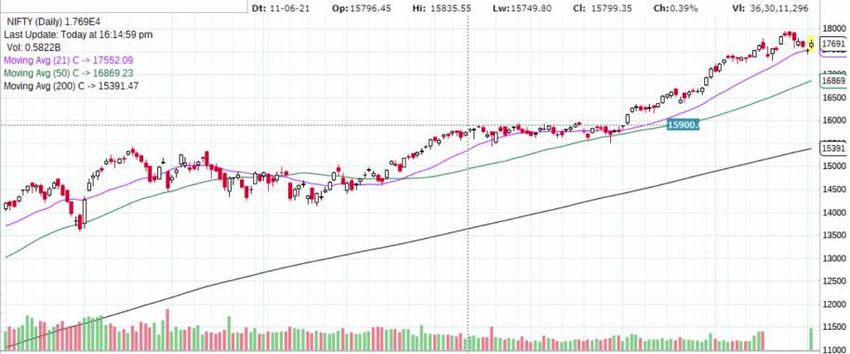
Morning KSL                                            Tuesday
                                                                                                             05th October, 2021

Good Morning & Welcome to Tuesday’s trading action at Dalal Street                                     INDICES
dated 5th of October 2021.
                                                                                             Nifty              17691           0.91%
Fasten your seat belts, because there’s turbulence ahead at Dalal                         Bank Nifty            37580           0.95%
Street.
                                                                                        Nifty Auto Index        10641           0.20%
We say so because, overnight Wall Street had a miserable session and amidst this
                                                                                       Nifty FMCG Index         40445           0.11%
negative backdrop —— SGX Nifty is seen tanking in early action.
                                                                                       Nifty Infra Index         5069           0.91%
Blame the pessimism to negative catalysts like:
                                                                                         Nifty IT Index         35126           0.99%
   1. Mounting growth concerns.
                                                                                       Nifty Media Index         2210           2.60%
   2. Rise in prices of natural gas – as that could choke the recovery from the
      pandemic. Overnight, WTI Oil futures too rose $2.14 at $78.02 per barrel.       Nifty Midcap Index         8413           1.84%

   3. Stubbornly high inflation that could raise pressure on central banks to          Nifty Metal Index         5807           2.99%
      withdraw stimulus.                                                              Nifty Pharma Index        14812           1.54%
   4. Anxiousness ahead of crucial September jobs report to trickle in this Friday.   Nifty Reality Index         517           2.17%
   5. U.S. political friction dampening investors’ sentiment.                         Nifty Smallcap Index      11077           1.58%
   6. Fears of China-America trade tensions intensifying.                                   Sensex              59299           0.91%

Long story short: Expect Nifty to be on the back foot.                                     SGX Nifty            17626           -0.55%

The biggest hurdles to watch on Nifty is at 17807 mark. If Nifty is unable to close
above 17807 mark then it will be safe to assume that yesterday’s rally at Dalal               Outlook for the Day
Street was mere ‘dead-cat bounce’.
                                                                                                             Volatile session
The gyan mantra is to ‘lighten aggressive leveraged long positions only below
Nifty’s make-or-break support at 17527 mark.

Bottom-line: There are good reasons to believe Nifty’s upswing for the would be
limited.                                                                                             Nifty Outlook
                                                                                          Intraday           Neutral (17507-17807)
The preferred trades for the day:
                                                                                       Medium Term           Negative (17007-18001)
# Nifty (17691): Sell on early strength between 17725-17750 zone. Stop
                                                                                         Long Term           Positive (15251-18501)
  17857. Targets 17557/17327. Aggressive targets at 17011 mark.

# Bank Nifty (37580): Sell between 37650-37800 zone. Stop 38311. Targets
  36876/36211. Aggressive targets at 35347.
                                                                                           Key Levels to Watch
TOP SECTORS:
                                                                                        Nifty Support        17527/17327
# Bullish View: PHARMA, PSU BANKS, METALS
                                                                                      Nifty Resistance       17807/18101
# Bearish view: PRIVATE BANKS.

STOCKS IN FOCUS:
                                                                                                      Pivot Level
# BULLISH VIEW: #TCS #HINDALCO #TATA MOTORS #INDIA CEMENT
                                                                                            Nifty            18211
  #NIPPION INDIA #NAZARA TECHNOLOGIES #SBI #SAIL #BANK OF
  BARODA #PNB #BHARAT FORGE.

Wealth Visionaries                                                             www.kslindia.com
Morning KSL

# BEARISH VIEW: #MARUTI #GRASIM #EICHER MOTORS #INDIGO
  #SRTRANSFIN #APOLLO TYRES #AUROBINDO PHARMA.
                                                                                                 Technical Strategy
# Our chart of the day is bullish on stocks like Tata Steel, Tata Motors,              STEEL AUTHORITY (SAIL)                            120.3
  India Cement, Bank of Baroda, SAIL & NIPPION LIFE (NAM India)
                                                                                       Action                                              BUY
  with an interweek perspective on any sharp early declines.

# The 1 Stock to Buy Right Now: Buy TCS between 3737-3745 zone. Stop                   Target                                              153
  3697. Targets 3819/3889. Aggressive targets at 4015. Oversold zone.
                                                                                       Support                                          107/97
  (Interweek Strategy).
                                                                                       Resistance                                      153/201
Outlook for Tuesday: Negative start. Nifty’s support at                                Holding Period                                60-90 days
17557 mark.
Bullish traders will be eagerly awaiting earnings season which is not too far away.     Theme: A metal stock with the mettle to outperform…
                                                                                        Buy STEEL AUTHORITY (SAIL) (CMP 120. Targets at
The Q2 results of corporate India are likely to again be positive but that said, the    153):
street will spy with one big eye on the outlook and commentary that will be more        Steel Authority of India Limited - A Maharatna · One of the
important than ever.                                                                    largest steel producers in India and operates in Metals - Ferrous
                                                                                        sector. SAIL is owned and operated by the Ministry of Steel,
                                                                                        Government of India having an annual steel making capacity of
TCS sets afire the ceremonial starters’ pistol on Friday, 8th October . TCS             about 21 million tonnes. The Government of India owns about
                                                                                        65% of SAIL's equity and retains voting control of the Company.
numbers will trickle in after-market hours on Friday, but there could be some
                                                                                        Incorporated in the year 1973, SAIL has a market cap of Rs
reaction in the stock price ahead of earnings.                                          58261 Crore. SAIL produces iron and steel at five integrated
                                                                                        plants and three special steel plants, located principally in the
                                                                                        eastern and central regions of India and situated close to
WHAT TECHNICAL TELLS US ON NIFTY/SENSEX:                                                domestic sources of raw materials. SAIL manufactures and sells
                                                                                        a broad range of steel products

Daily chart of Nifty:                                                                   The key positive catalyst in favor of the stock is the firms’ higher
                                                                                        operating leverage due to high conversion cost, the strength in
                                                                                        China HRC export price, tight demand supply scenario in the
                                                                                        domestic market, backward integrated with captive iron ore,
                                                                                        permission from government to sell 25% of Iron ore production
                                                                                        of previous fiscal and iron ore fines accumulated as waste over
                                                                                        past 5-6 decades, and also demand from Railways which should
                                                                                        keep its average NSR higher.
                                                                                        SAIL is seen delivering across all front and strong margins in steel
                                                                                        business are likely to drive momentum in stock price on the
                                                                                        upside.
                                                                                        For the June 2021 quarter, SAIL returned to the black, posting a
                                                                                        consolidated net profit of Rs 3,897.36 crore The company had
                                                                                        posted a Rs 1,226.47-crore net loss in the year-ago quarter. Its
                                                                                        net income during April-June 2021 more than doubled to Rs
                                                                                        20,754.75 crore, compared with Rs 9,346.21 crore in the year-
                                                                                        ago period.
                                                                                        Robust operating performance seen aided by lower cost on
                                                                                        backdrop of efficient working capital management coupled with
                                                                                        sharp capital allocation is likely to improve prospects further.
The biggest hurdles to watch on Nifty in tomorrow’s trade would be at 17807
                                                                                        Technically, brace yourselves for a breakout play on the weekly
mark. If Nifty is unable to close above 17827 mark then it will be safe to assume       and daily time frames. The recent sequence of higher high/low is
                                                                                        intact on all time-frames. An impulse uptrend is seen forming on
that today’s rally at Dalal Street was mere ‘dead-cat bounce’.                          the monthly time scale too, with positive SAR series.
                                                                                        Add to that a bullish divergence and a rising stochastic signal (on
The gyan mantra is ‘lighten aggressive leveraged long positions only below              daily charts) with recent increase in volumes signaling a larger
Nifty’s make-or-break support at 17393 mark.                                            rebound. The 200 days Exponential Moving Average (EMA) of the
                                                                                        stock on the daily chart is currently at 103 zone. The level of 103-
                                                                                        105 zone will act as a strong support zone and any sharp panic
Technically speaking, the biggest make-or-break support for Nifty seen at               declines to these levels offer opportunities to initiate aggressive
                                                                                        long positions.
17557 mark. Please note, Nifty will be vulnerable below 17557 mark with
                                                                                        Establish buy positions at CMP, targeting 131/153 and
aggressive downside risk at 17327 and then at 17011-17051 zone. Please note,            then aggressive targets at psychological 200 mark. Stop
                                                                                        87. Holding period 3-5 months.
Nifty’s 200 day EMA is still at 15393 mark.

Wealth Visionaries                                                             www.kslindia.com
Morning KSL
So, the line in the sand is Nifty’s 17557 support. Alternatively, if Nifty’s 17557 support holds then we suspect Nifty still has the fire
power to touch the magical 18000 mark. In this scenario, a bullish breakout will be the probable theme as the backdrop of recent
sequence of higher high/low is still intact on weekly and monthly-time-frames.
The options data for October series suggests Nifty is likely to be in a trading range of 17000-18000 zone. Maximum Call OI is at
18000 followed by 18500 strike price. So, the 18000 mark will be Nifty’s crucial resistance zone. Maximum Put open interest stands
at 17000 levels followed by 17600 levels. Call writing was seen at 18000 and then at 18500 strike price, while there was meaningful
Put writing at 17000 and then at 17600 strike prices.
# Bank Nifty faces hurdles at 38501 mark. Immediate supports seen at 37033/36211 mark. Below 36211 mark, aggressive inter-
week targets placed at psychological 35500 mark.
DERIVATIVE & INSTITUTIONAL CUES:
# India VIX, which measures the expected volatility in the market, inched lower to 16.73 mark.
# The Put-Call Open Interest Ratio is at 1.40 for Nifty.
# As per Friday’s provisional data available on the NSE, FIIs bought shares worth Rs. 6542.56 crores while DIIs sold shares worth
Rs. 613.08 crores in the Indian Equity Market.
# FIIs sold shares worth Rs. 6542.56 crores in the week gone by.
# As per Monday’s provisional data available on the NSE, both FIIs and DIIs camp bought shares worth Rs. 861 crores and Rs. 228
crores in the Indian Equity Market.
# Stock banned in F&O segment: NIL
The POSITIVE CATALYSTS:
# Stocks are likely to remain in limelight as companies are likely to crush earnings estimates again, prompting the street to revise
their estimates upward. Tata Consultancy Services will kick off the September 2021 quarter earnings season on Friday.
# The biggest positive trigger which we come across in today's trade is FIIs and DIIs buying shares worth Rs. 861 crores and Rs.
228 crores in the Indian Equity Market.
# The reopening and recovering of the economy.
# Decline in COVID cases and a pick-up in vaccination drive.
# Low interest rates environment.
THE NEGATIVE CATALYSTS:
• Risks linked to power outages witnessed in China threatening to slow down global economic growth.
• Surging inflation prospects in the U.S which is also supported by the Federal Reserve's signaling of a near-term slowdown in
the pace of its $120 billion in monthly bond purchases. The Federal Reserve and ECB are seen cautiously moving towards
trimming their massive stimulus programs.
• The street suspects that the Fed could announce a sooner-than-expected rate hike.
• Overbought technical conditions.
Wealth Visionaries www.kslindia.comMorning KSL ECONOMIC CUES: # The biggest catalyst for his week is RBI Policy outcome* where the Monetary Policy Committee is expected to keep the repo rate and accommodative stance unchanged in the policy meeting scheduled to be held during October 6-8. The street will spy with one big eye on the RBI commentary over growth along with rising oil prices, improving Covid situation and global environment. # On the international front, all eyes will be on the US Non-farm payrolls (08th October) – Fed chair Jay Powell, at the most recent Fed meeting, even went as far as saying that a semi- decent payrolls number this week needn’t be a barrier to the start of taper this year, and as early as next month. This of course raises the question as to what a “semi-decent” report is? 400k, 500k, or a repeat of August? The hawkish shift at the September Fed meeting has certainly shifted the bar when it comes to what might prevent the Fed from starting the tapering process. Expectations are for 510k jobs and for the unemployment rate to fall to 5%. # Apart from RBI policy, in the coming week, Markit Services PMI and Markit Composite PMI for September will be released on Tuesday. Deposit and bank loan growth for the fortnight ended September 24, and foreign exchange reserves for the week ended October 1 will be released on Friday. # GST collections remained strong and topped Rs 1.17 lakh crore in September, which was 4.5% more than the previous month and 22.5% higher than a year ago. This is the third consecutive month that GST collections are above the Rs 1 lakh crore mark, indicating that economic recovery post the second wave of the Covid-19 is well underway. # The Centre's fiscal deficit for April-August came in at Rs 4.7 lakh crore, or 31% of the full-year budget estimate, compared with 109% for the same period last year. Current account also reported surplus in Q1FY22. # Advance tax numbers came in very strong for India Inc. and corporate profitability is expected to remain strong for the second quarter. # An updated reading of the second-quarter growth did show that the U.S economy grew at 6.7%, as the U.S. got a big jolt in the spring from government stimulus payments and coronavirus vaccines allowed businesses to reopen. The rise in consumer spending was slightly faster at 12%. GLOBAL STOCK MARKETS: Overnight at Wall Street, U.S. stocks slumped lower with big tech stocks leading the decline, as investors remained cautious amid a series of headwinds to global growth that could test the Federal Reserve's policy stance in the months ahead. China's regulatory crackdown, the ongoing crisis linked to indebted property developer Evergrande and a rolling power crunch, which has lead to a spike in energy costs around the world, are both testing investors' appetite for risk while boosting inflation forecasts heading into the Fed's November policy meeting. Those pressures, alongside myriad warnings from U.S. companies that supply chain disruptions, elevated shipping costs and notably higher wages will eat into near-term profit margins, are taking the steam out of major markets around the world. In the meantime, the Fed's preferred inflation gauge, the core PCE Price Index, surged 3.6% in August, the highest in three decades. Wealth Visionaries www.kslindia.com
Morning KSL

RECAP OF PREVIOUS DAY’S TRADING SESSION:

# Nifty (+159, 17691)

# Sensex (+534, 59299)

The benchmark Nifty staged smart recovery in yesterday’s trade amidst bargain hunting backed by short covering as almost all the
sectoral indices ended in the green with Nifty Metal index gaining 3%. BSE Midcap and Smallcap indices too flared up 1.55-1.8
percent.

The positive takeaway from yesterday’s trading was that Dalal Street ended in green shrugging off depressing Asian cues and taking
rise in oil prices at its stride.

*Bottom-line:* Short covering backed with fear of missing out (FOMO) ruling traders’ mindset.*

*The key highlights of yesterday’s trade:*

# Nifty resumes its northbound journey amidst massive short covering.

# Bank Nifty (+0.95%) mirrors’ Nifty’s gains of 0.91%.

# Mid-cap & Small-cap indices flared up 1.84% and 1.58% respectively.

# VIX cools, dips lower 2.79% at 16.73.

# Top Index Gainers: DIVIS (+7.84%) HINDALCO (+4.60%) NTPC (+4%).

# Top Index Losers: CIPLA (-2.97%) GRASIM (-2.28%) UPL (-1.40%).

Wealth Visionaries                                                         www.kslindia.com
TOP PICKS (F & O)
                                      It's like having investment binoculars !

  Amidst volatilty, buying on any sharp early declines should be the preferred strategy. We like NAM INDIA.

    STOCKS          LTP       S1       S2       R1       R2      BIAS                 TRADING STRATEGY

                                                                           Buy between 730-733 zone. Stop          711. Targets
  BHARAT FORGE       742     727      715      765      795     Positive 765/773. Aggressive targets at 793. Oversold zone.
                                                                           (Interweek Strategy).

                                                                           Buy between 431-435 zone. Stop          417. Targets
   NIPPON LIFE       449     431      403      457      501     Positive 457/469. Aggressive targets at 501. Breakout Play.
   (NAM INDIA)                                                             (Intermonth Strategy).

                                                                           Buy between 333-337 zone. Stop       331. Targets
                                                                           347/355. Aggressive targets at 363. Breakout Play.
   TATA MOTORS       342     325      313      347      363     Positive   (Interweek Strategy).

                                                                           Buy between 1305-1309 zone. Stop 1291. Targets
   TATA STEEL       1324     1297     1258     1247     1411    Positive   1247/1377. Aggressive targets at 1411. Momentum
                                                                           play. (Intermonth Strategy).

                                                                           Buy between 3737-3745 zone. Stop 3697. Targets
       TCS          3784     3741     3701     3819     3889    Positive   3819/3889. Aggressive targets at 4015. Oversold zone.
                                                                           (Interweek Strategy).

Wealth Visionaries                                             www.kslindia.com
EQUITY DERIVATIVES Tuesday
05th October, 2021
Looking into the future from present.
Derivatives Strategies
Changes in Open Interest (OI) in yesterday’s trade.
Future Call: BUY FEDERALBANK OCTOBER FUTURES at CMP
Nifty Spot 17691.25 (+0.91%)
85.65. Targets at 87 and then at 91. Stop: 83.75. Holding Period:
Intraday. Analyst’s Remark: Momentum Play (FEDERALBANK Bank Nifty Spot 37579.65 (+0.95%)
OCTOBER Futures CMP 85.65)
VIX 16.735 (-2.76%)
Option Call: SELL NIFTY 07th OCTOBER PE Strike Price 17700 at Premium +24 vs +06
CMP 87.10. Maximum Profit: Rs. 4,355/-. Loss: Unlimited. Stop: Nifty Future OI 1.21 crores (+0.95%)
Exit Put Option if NIFTY moves below 17433. (NIFTY SEPTEMBER
Futures CMP 17715). Bank Nifty Future OI 18.39 lakhs (-9.15%)
Market Summary: Cash Volumes Day Before
Yesterday
(INR in Cr.) Yesterday
• Nifty October Futures ended Monday’s session at a premium of +24
vs premium of +06. BSE Cash Vol.
5738.69 5738.69
(Rs. in Cr)
• The 07th October expiry Put-Call Open Interest Ratio was at 0.86 for NSE Cash Vol.
64,514.35 72,973.52
Nifty whereas it was 0.89 for Bank Nifty. (Rs. in Cr)
• The 07th October expiry Put-Call Volume Ratio was at 0.92 for the NSE Derivative
36,97,261 33,59,399
Vol. (Rs. in Cr)
Nifty and 0.93 for Bank Nifty.
• For Nifty, Maximum Call Open Interest (OI) stands at 18000 Strike Derivatives Vol. No of Turnover
Price, followed by 1 7700 Strike Price for 07th October Series. Short (INR in Cr.) contracts (Rs. In cr.)
covering was seen at strike prices 17200-17600.
Index Future Volumes 2,53,325 23,027
• Maximum Put Open Interest (OI) was seen at strike price 17600
followed by 17900 strike prices for 07th October series. Short 7,60,873 68,858
Stock Future Volumes
buildup was seen at strike prices 17200-17900.
• For Bank Nifty, Maximum Call Open Interest (OI) stands at 38000 Index Option Volumes 3,71,91,611 33,95,444
Strike Price and Maximum Put Open Interest stands at 37500 Strike
Stock Option Volumes 2,20,656 2,09,932
Price.
• As per Friday’s provisional data available on the NSE, FIIs bought Total 4,04,36,465 36,97,261
shares worth Rs. 860.50 crores in the Indian Equity Market. DIIs too
bought shares worth Rs. 228.06 crores in the Indian Equity market.
Major Changes in Nifty Options (OI)
• Long Buildup: SAIL, NTPC, HCLTECH, IRCTC. Calls in lakhs (% Change)
• Short Buildup: CIPLA, BRITANNIA, GRASIM, METROPOLIS. 17400 3.4 (-45%)
17500 13.84 (-42%)
• Short Covering: TATAPOWER, FEDERALBANK, M&M,
MANAPPURAM. 17600 15.45 (-45%)
• Long Unwinding: BALKRISHNA, IPCALABS, MUTHOOTFINx.
Puts in lakhs (% Change)
• Stocks banned in F&O segment: NIL.
17600 35.73 (+175%)
• New in Ban: NIL.
17700 33.97 (+336%)
• Out of Ban: NIL. 17800 7.82 (+73%)
Wealth Visionaries www.kslindia.comDAILY PIVOT TABLE Tuesday
05th October, 2021
Stock CMP Support Resistance 21 DMA 200 DMA Intraday Short Term Long Term
NIFTY 17691 17337 18045 17552 15391 UP DOWN UP
BANKNIFTY 37580 36828 38331 37224 34381 UP DOWN UP
NIFTYIT 35126 34424 35829 35533 28162 DOWN DOWN UP
NIFTYMETAL 5807 5691 5923 5658 4622 UP UP DOWN
0 0
AARTIIND 1021 1001 1042 927 775 UP UP UP
ABFRL 241 234 248 221 194 UP UP UP
ACC 2266 2220 2311 2375 1983 DOWN DOWN DOWN
ADANIENT 1527 1496 1557 1502 1134 DOWN UP UP
ADANIPORTS 744 729 759 750 685
ALKEM 3970 3891 4049 3881 3153 UP UP UP
AMARAJABAT 766 751 781 737 817 UP UP UP
AMBUJACEM 407 398 415 422 329 DOWN DOWN UP
APOLLOHOSP 4548 4457 4639 4755 3414 DOWN DOWN DOWN
APOLLOTYRE 228 221 235 224 219
ASHOKLEY 130 126 134 127 121 UP UP DOWN
ASIANPAINT 3202 3138 3266 3325 2800 DOWN DOWN UP
ASTRAL 2354 2307 2401 2124 1751 UP UP UP
AUBANK 1189 1166 1213 1140 1085 DOWN UP DOWN
AUROPHARMA 732 718 747 736 898
AXISBANK 779 763 795 792 724 UP DOWN UP
BAJAJ-AUTO 3826 3749 3902 3795 3848 UP UP DOWN
BAJAJFINSV 17806 17450 18162 17275 11801 UP DOWN UP
BAJFINANCE 7695 7541 7849 7571 5826 UP DOWN UP
BALKRISIND 2521 2470 2571 2523 1993
BANDHANBNK 295 286 304 286 325 UP UP DOWN
BANKBARODA 84 81 87 80 77 UP UP UP
BATAINDIA 1869 1832 1906 1782 1570 UP UP UP
BEL 206 200 212 203 154
BERGEPAINT 821 804 837 826 779 DOWN DOWN DOWN
BHARATFORG 742 727 757 762 676 DOWN DOWN DOWN
BHARTIARTL 681 668 695 689 556 UP DOWN UP
BHEL 66 63 68 58 54
BIOCON 365 354 376 362 399 UP DOWN
BPCL 436 427 445 451 439 DOWN DOWN DOWN
BRITANNIA 3893 3815 3971 4042 3618 DOWN DOWN UP
CADILAHC 562 551 573 557 539 DOWN DOWN DOWN
CANBK 182 177 188 162 150 UP UP UP
CANFINHOME 711 696 725 640 537 UP UP UP
CHOLAFIN 564 553 576 577 515 UP DOWN UP
CIPLA 958 938 977 960 889 UP UP UP
COALINDIA 190 184 196 163 144 UP UP UP
COFORGE 5338 5231 5445 5343 3627 UP DOWN UP
COLPAL 1683 1649 1716 1709 1632 UP DOWN DOWN
COROMANDEL 801 785 817 807 809 DOWN DOWN DOWN
DABUR 624 612 637 638 560 DOWN DOWN UP
DEEPAKNTR 2592 2540 2644 2418 1678 UP UP UP
DIVISLAB 5221 5116 5325 5072 4169 DOWN UP UP
DIXON 4860 4763 4957 4371 3885 UP UP UP
DLF 424 416 433 368 297 UP UP UP
DRREDDY 5043 4942 5144 4887 4964 UP UP UP
ESCORTS 1496 1466 1526 1446 1273 UP UP UP
GODREJCP 1030 1009 1050 1078 844 DOWN DOWN UP
GODREJPROP 2338 2291 2384 1880 1468 UP UP UP
GRASIM 1641 1608 1674 1600 1363 UP UP UP
HAL 1346 1319 1373 1372 1060 UP DOWN UP
HAVELLS 1390 1362 1418 1420 1104 DOWN DOWN UP
HCLTECH 1279 1253 1304 1259 1011 UP DOWN UP
HDFC 2725 2671 2780 2792 2586 UP DOWN UP
HDFCAMC 2909 2850 2967 3160 2972 DOWN DOWN DOWN
HDFCBANK 1586 1554 1617 1574 1493 UP UP UP
HDFCLIFE 727 712 741 734 692 UP DOWN UP
HEROMOTOCO 2856 2798 2913 2853 3010 UP DOWN UP
HINDALCO 506 496 516 474 362 UP UP UP
HINDPETRO 303 294 312 280 255 UP UP UP
HINDUNILVR 2686 2632 2740 2757 2413 UP DOWN UP
ICICIBANK 700 686 714 714 626 UP DOWN UP
ICICIGI 1577 1545 1608 1602 1494 UP DOWN UP
IDEA 11 11 12 10 10 UP UP UP
IDFCFIRSTB 48 46 49 48 52 UP DOWN UP
IEX 632 620 645 597 368 UP UP UP
IGL 528 517 538 551 530 DOWN DOWN DOWN
INDHOTEL 188 182 193 166 132 UP UP UP
INDIGO 1993 1953 2033 2038 1723 UP DOWN UP
INDUSINDBK 1120 1097 1142 1085 989 UP UP UP
INFY 1679 1645 1712 1703 1448 DOWN DOWN UP
IRCTC 4009 3929 4089 3605 2084 UP UP UP
ITC 237 230 244 228 212 UP UP UP
JINDALSTEL 418 410 427 385 367 UP UP UP
JSWSTEEL 681 668 695 677 583 DOWN DOWN DOWN
JUBLFOOD 4146 4063 4229 4101 3180 UP DOWN UP
KOTAKBANK 1991 1951 2031 1935 1825 UP UP UP
LICHSGFIN 445 436 454 423 429 UP UP UP
LT 1715 1681 1750 1710 1488 UP DOWN UP
LUPIN 961 942 981 960 1069 DOWN UP DOWN
M&M 841 824 858 771 792 UP UP UP
MANAPPURAM 183 177 188 169 168 UP UP UP
MARICO 554 543 565 559 468 UP DOWN UP
MARUTI 7170 7027 7314 7002 7177 UP DOWN UP
MCDOWELL-N 867 849 884 785 621 UP UP UP
METROPOLIS 2848 2791 2905 2967 2453 DOWN DOWN DOWN
MGL 1091 1069 1113 1132 1134 DOWN DOWN DOWN
MINDTREE 4253 4168 4338 4135 2408 UP DOWN UP
MOTHERSUMI 226 220 233 222 212 UP UP UP
MPHASIS 3089 3027 3151 3119 2057 UP DOWN UP
NAM-INDIA 449 440 458 435 360 UP DOWN UP
NATIONALUM 105 102 108 94 68 UP UP UP
NAUKRI 6545 6414 6675 6590 5124 UP DOWN UP
NAVINFLUOR 3870 3793 3947 3905 3187 DOWN UP UP
NESTLEIND 19493 19103 19883 19975 17834 UP DOWN UP
NMDC 148 144 153 147 149 DOWN UP DOWN
OFSS 4622 4530 4715 4704 3698 DOWN DOWN UP
PAGEIND 33069 32407 33730 32598 30134 UP DOWN UP
PEL 2786 2731 2842 2646 2010 UP DOWN UP
PFC 142 138 146 136 123 UP UP UP
PFIZER 5649 5536 5762 5853 5255 DOWN DOWN UP
PIDILITIND 2421 2373 2469 2389 1993 UP UP UP
PIIND 3173 3110 3237 3312 2662 DOWN DOWN UP
PNB 41 40 43 39 38 UP UP UP
POLYCAB 2436 2387 2484 2401 1632 UP DOWN UP
PVR 1647 1614 1679 1479 1360 UP UP UP
RAMCOCEM 1007 987 1027 1012 970 DOWN UP DOWN
RBLBANK 194 188 200 181 211 UP UP UP
RECLTD 159 154 164 156 144 UP UP DOWN
RELIANCE 2556 2505 2607 2450 2096 UP UP UP
SAIL 120 117 124 116 102 DOWN UP DOWN
SBILIFE 1231 1206 1255 1205 991 UP UP UP
SBIN 463 454 472 443 383 UP UP UP
SHREECEM 29289 28704 29875 30065 27547 UP DOWN UP
SIEMENS 2227 2182 2271 2178 1928 DOWN UP UP
SRF 11557 11326 11788 10830 7050 UP UP UP
SUNPHARMA 832 815 849 783 669 UP UP UP
SUNTV 530 520 541 501 508 UP UP DOWN
SYNGENE 627 614 639 638 594 DOWN DOWN UP
TATACHEM 936 917 954 861 710 UP UP UP
TATACONSUM 814 798 831 853 695 DOWN DOWN DOWN
TATAMOTORS 342 332 352 313 297 UP UP UP
TATAPOWER 169 164 174 141 109 UP UP UP
TATASTEEL 1324 1298 1351 1361 1018 DOWN DOWN DOWN
TCS 3773 3698 3849 3832 3252 UP DOWN UP
TECHM 1399 1371 1427 1443 1096 DOWN DOWN UP
TITAN 2155 2112 2198 2089 1648 UP UP UP
TORNTPHARM 3130 3067 3192 3106 2788 UP DOWN UP
TORNTPOWER 503 493 513 491 417 UP UP UP
TRENT 1046 1025 1067 1007 825 UP UP UP
TVSMOTOR 561 549 572 548 574 UP UP DOWN
UBL 1602 1570 1634 1589 1320 UP DOWN UP
ULTRACEMCO 7516 7365 7666 7712 6659 DOWN DOWN UP
UPL 703 689 717 735 674 DOWN DOWN DOWN
VEDL 298 289 307 299 243 DOWN DOWN DOWN
VOLTAS 1227 1203 1252 1212 1010 UP DOWN UP
WIPRO 641 628 654 661 509 DOWN DOWN UP
ZEEL 301 292 310 258 213 UP UP UP
- - - - - - - - -
- - - - - - - - -
- - - - - - - - -
- - - - - - - - -
- - - - - - - - -
- - - - - - - - -
- - - - - - - - -
- - - - - - - - -
- - - - - - - - -
- - - - - - - - -
- - - - - - - - -
- - - - - - - - -
- - - - - - - - -
- - - - - - - - -
- - - - - - - - -
- - - - - - - - -
All level indicated above are based on cash market prices.
Pivot Point
PP : Pivot Point : This is trigger point for weekly buy/sell based on the price range of the previous week.
R1 : Resistance one : 1st Resistance over PP. R2 : Resistance two : 2nd Resistance over R1.
S1 : Support one : 1st support after PP. S2 : Support Two : 2nd support after S1.
As per the tool, the trader should take BUY position just above PP and keep the stop loss of PP and the first target would be R1.
If R1 is crossed then R2 becomes the next target with the stop loss at R1.
Similarly if price goes below PP the trader should SELL and keep the PP as Stop loss and the first target would be S1.
If S1 is crossed then S2 becomes the next target with the stop loss at S1.
This is a trading tool. The key to use of this tool is the use of STOP LOSS.
Wealth Visionaries www.kslindia.comDAILY PIVOT TABLE Tuesday
05th October, 2021
Stock CMP Support Resistance 21 DMA 200 DMA Intraday Short Term Long Term
ALUMINIUM 1 228 221 235 228 190 UP UP UP
CARDAMOM 1 1505 1475 1535 1478 2690 DOWN UP DOWN
CASTOR 1 6132 6009 6255 6163 5065 DOWN DOWN UP
CHANA 1 5191 5087 5295 5193 4974 UP UP UP
COPPER 1 719 704 733 717 701 DOWN DOWN DOWN
COTTON 1 28210 27646 28774 26223 23356 UP UP UP
CRUDEOIL 1 5797 5681 5913 5294 4760 UP UP UP
GOLD 1 46771 45836 47706 46553 47355 DOWN UP DOWN
GUARGUM5 1 10030 9829 10231 9862 6810 DOWN UP UP
GUARSEED10 1 5862 5745 5979 6012 4334 UP UP UP
JEERAUNJHA 1 14500 14210 14790 14420 13713 UP UP UP
LEAD 1 183 178 189 187 172 DOWN DOWN UP
MENTHAOIL 1 923 904 941 949 961 DOWN DOWN UP
NATURALGAS 1 436 427 444 381 246 UP UP UP
NICKEL 1 1387 1359 1415 1470 1338 DOWN DOWN DOWN
RMSEED 1 8379 8211 8547 8543 6800 UP DOWN UP
RUBBER 1 16991 16651 17331 17455 15868 DOWN DOWN DOWN
SILVER 1 60780 59564 61996 61811 67238 DOWN DOWN DOWN
SYBEANIDR 1 5477 5367 5587 7468 6648 DOWN DOWN DOWN
ZINC 1 256 248 263 257 234 DOWN DOWN UP
Wealth Visionaries www.kslindia.comThe Compass
…Direction at a glance
Crude Oil prices reaches seven-year highs above $78.00 on OPEC+ agreement. Positive bias to continue.
Instrument LTP S1 S2 R1 R2 Bias TRADING STRATEGY
MCX Gold marched higher in yesterday's trade amidst fears of Sino-
MCX GOLD American trade tensions. The said rebound can take the yellow meatal to
46891 46311 45479 47001 47501 Neutral
47501 mark. Intraday Strategy: Buy at CMP, targeting 47001/47501.
Strict Stop at 46251.
Major hurdles at 61219 mark. Confirmation of weakness now only below
MCX SILVER 60976 59379 55901 61219 62777 Neutral 59379 mark. Intraday Strategy: Sell below 60000, targeting
59379/58201. Strict Stop at 61321.
Oil prices flared up in yesterday's trade after OPEC+ left the 400,000
barrels per day agreement unchanged. The biggest hurdles now seen at
MCX CRUDE OIL 5824 5759 5537 5911 6050 Positive 5911. Intraday Strategy: Buy between 5759-5775 zone, targeting
5911/6050 mark. Strict Stop at 5501.
Copper prices ended with positive bias in yesterday's trade. Major intraday
MCX COPPER 718.65 707 695 723 747 Positive hurdles at 723 mark. Confirmation of strength only above 723 mark.
Intraday strategy: Buy at CMP. Targets 723/747/781. Strict stop at 703.
MCX Natural Gas prices inched higher in yesterday's trade amidst s value
MCX NATURAL 433.6 407 389 447 467 Positive buying. Key support seen at 407. Intraday Strategy: Buy on dips
GAS between 415-421 zone, targeting 437/ 447.50/467 mark. Stop at 397.
USD/INR flared up in yesterday's trad despite rise in domestic stock
markets. Key support now seen at 74.33. Interweek hurdles seen at 75.15
USD-INR 74.59 74.33 73.97 75.15 75.57 Positive
zone. Interweek Strategy: Buy at CMP, targeting 74.89/75.15/75.57
mark. Strict Stop at 74.11.
Wealth Visionaries www.kslindia.comThe Navigator
…Sailing global trend
All eyes on RBI Policy (Oct 8th), US Nonfarm Payrolls (Oct 8th) and the spiking oil prices.
Instrument LTP S1 S2 R1 R2 Bias TRADING STRATEGY
Key support at 1701 mark. Interweek Strategy: Establish SELL positions
GOLD (USD) 1766 1701 1689 1777 1789 Neutral between 1767-1777 zone. Targets 1739/1701/1689 mark with stop at
1793.
SILVER (USD) 22.13 21.05 20.51 23.03 24.21 Negative Key hurdles at 23.03. Interweek Strategy: Establish sell positions between
22.50-22.75 zone. Targets 21.05/20.51 with stop at 23.47.
WTI CRUDE Interweek Strategy: Establish buy positions at CMP. Targets 77.50/79.
78.05 73.45 72.5 77.5 79 Positive
OIL (USD) Stop at 73.05.
EUR/USD 1.1621 1.1503 1.1460 1.1771 1.1873 Negative Interweek Strategy: Establish sell positions between 1.1675-1.1701 zone.
Targets 1.1503/1.1460 with stop at 1.1809.
93.80 93.69 92.20 95.05 95.75 Positive Interweek Strategy: Establish buy positions at CMP. Targets 94/94.50
US Dollar Index
with stop at 93.01.
U.S. stocks slumped lower as investors remained cautious amidst a series
33967 32795 31015 35513 36219 Neutral of headwinds to global growth that could test the Federal Reserve's policy
DOW JONES
stance in the months ahead. Interweek Strategy: Establish sell below
33901. Targets 32795/31015 mark with stop at 35611.
Wealth Visionaries www.kslindia.comKhandwala Securities Limited
Contact:
Khandwala Securities Limited
Head Office:
Vikas Building, Ground Floor, Green Street,
Fort, Mumbai - 400 023. India
Call : 022-40767373
DISCLAIMER: This is solely for information of clients of Khandwala Securities Limited and does not construe to be an investment advice. It is also not intended as an offer or solicitation for the purchase and sale
of any financial instruments. Any action taken by you on the basis of the information contained herein is your responsibility alone and Khandwala Securities Limited, its subsidiaries or its employees or associates
will not be liable in any manner for the consequences of such action taken by you. We have exercised due diligence in checking the correctness and authenticity of the information contained in this
recommendation, but Khandwala Securities Limited or any of its subsidiaries or associates or employees shall not be in any way responsible for any loss or damage that may arise to any person from any
inadvertent error in the information contained in this recommendation or any action taken on basis of this information.
Technical analysis studies market psychology, price patterns and volume levels. It is used to forecast future price and market movements. Technical analysis is complementary to fundamental analysis and news
sources. The recommendations issued herewith might be contrary to recommendations issued by Khandwala Securities Limited in the company research undertaken as the recommendations stated in this report
is derived purely from technical analysis. Khandwala Securities Limited has based this document on information obtained from sources it believes to be reliable but which it has not independently verified;
Khandwala Securities Limited makes no guarantee, representation or warranty and accepts no responsibility or liability as to its accuracy or completeness. The opinions contained within the report are based
upon publicly available information at the time of publication and are subject to change without notice. The information and any disclosures provided herein are in summary form and have been prepared for
informational purposes. The recommendations and suggested price levels are intended purely for trading purposes. The recommendations are valid for the day of the report however trading trends and volumes
might vary substantially on an intraday basis and the recommendations may be subject to change. The information and any disclosures provided herein may be considered confidential. Any use, distribution,
modification, copying, forwarding or disclosure by any person is strictly prohibited. The information and any disclosures provided herein do not constitute a solicitation or offer to purchase or sell any security or
other financial product or instrument. The current performance may be unaudited. Past performance does not guarantee future returns. There can be no assurance that investments will achieve any targeted
rates of return, and there is no guarantee against the loss of your entire investment.
POTENTIAL CONFLICT OF INTEREST DISCLOSURE (as on date of report)
Disclosure of interest statement – • Analyst interest of the stock /Instrument(s): - No. • Firm interest of the stock / Instrument (s): - No.
Wealth Visionaries www.kslindia.comYou can also read