CT-based method to measure metal powder characteristics and to study their influence on the quality of additively manufactured parts
←
→
Page content transcription
If your browser does not render page correctly, please read the page content below
11th Conference on Industrial Computed Tomography, Wels, Austria (iCT 2022), www.ict-conference.com/2022

                                                                     CT-based method to measure metal powder characteristics and to study their
                                                                              influence on the quality of additively manufactured parts

                                                                                                  Filippo Zanini, Nicola Buzzacchera, Simone Carmignato
                                                                 University of Padova, Stradella San Nicola 3, Vicenza, Italy, e-mail: filippo.zanini@unipd.it | simone.carmignato@unipd.it

                                                             Abstract
                                                             Laser powder bed fusion (LPBF) is increasingly used to produce metal industrial components for high value-added sectors, such
                                                             as aerospace, automotive and biomedical. However, mechanical and structural properties of LPBF parts are often hindered by
More info about this article: http://www.ndt.net/?id=26569

                                                             the large quality variability, poor geometrical and dimensional characteristics, complex surface texture and low density. The
                                                             quality of the feedstock material is an important aspect to be taken into account, as it significantly influences such possible issues.
                                                             In particular, metal powder used in LPBF should have shape and size distribution designed to facilitate good flowability,
                                                             spreading and packing behaviour, so that the final fabricated parts have acceptable density, surface finish and mechanical
                                                             properties. This work focuses on the accuracy of simultaneous measurement of powder size and shape from three-dimensional
                                                             reconstructions obtained by X-ray computed tomography (CT). Results of CT measurements are compared with results from
                                                             other methods based on laser diffraction and scanning electron microscopy. Different materials and powder morphologies were
                                                             investigated. In addition, the CT-measured powder characteristics can be used to improve other CT analyses of LPBF parts.

                                                             Keywords: X-ray computed tomography, additive manufacturing, metal powder, metrology, quality

                                                             1     Introduction
                                                             Among additive manufacturing (AM) technologies, laser powder bed fusion (LPBF) is increasingly used to produce metal
                                                             industrial components for high value-added sectors, such as aerospace, automotive and biomedical [1]. However, mechanical
                                                             and structural properties of AM parts are often hindered by large quality variability, poor geometrical and dimensional accuracy,
                                                             complex surface texture and low density [2]. Metal powder used as feedstock material for laser powder bed fusion (LPBF) is
                                                             currently receiving particular attention from researchers, because its properties directly affect the quality and performance of
                                                             LPBF processes and products [3]. Research efforts are oriented at improving the metal powder production processes, among
                                                             which the gas atomization process can already be used to produce metal powder particles with adequate characteristics for a
                                                             wide range of commonly processed materials [4]. However, the restoration of unprocessed powders, which is a fundamental
                                                             aspect for maximizing the material efficiency and ensuring a sustainable and cost-effective LPBF production, can induce
                                                             substantial modification of the original powder properties [5]. For example, the solid sintering mechanisms and the presence of
                                                             unwanted by-products (e.g., spatter particles) can lead to poorer powder batches with uncontrolled size distribution and more
                                                             complex shapes. The powder recovery typically consists in performing sieving operations, which discard particles larger than
                                                             the maximum desired dimension [6]. However, sieving does not improve the shape and size distribution of the powder particles,
                                                             which are critical to ensure good flowability, spreading and powder bed packing during the process, and to produce finished
                                                             parts with appropriate density, geometrical accuracy, surface finish and mechanical properties [7]. Advanced powder
                                                             characterization methods are hence needed to improve the understanding of LPBF processes, including studying the effects of
                                                             powder reuse. Two techniques that are commonly used to evaluate the powder geometrical characteristics are scanning electron
                                                             microscopy (SEM) and laser diffraction (LD) [8]. The SEM method can generate high-contrast and high-resolution images of
                                                             the AM powder particles to evaluate particle size and shape, but it is generally limited to bi-dimensional (2D) analyses, which
                                                             might be not well representative in case of particles with complex morphology. The LD method uses diffraction patterns
                                                             produced by laser light scattering from clouds of particles to evaluate the particle size distribution, but does not consider and
                                                             measure the powder morphology. In this context, X-ray computed tomography (CT) is an interesting alternative thanks to the
                                                             capability of obtaining a complete and three-dimensional (3D) characterization of powder particles, also in case of complex
                                                             morphology. In particular, CT can be used to perform simultaneous measurements of powder size, size distribution, shape and
                                                             internal porosity [9]. However, research is still needed to investigate and enhance the accuracy of CT powder geometrical
                                                             measurements. This work specifically focuses on the accuracy of CT measurements of powder size and shape, considering
                                                             different materials. With this aim, advanced metrological approaches are developed to enable reliable comparison of CT powder
                                                             measurements with other methods (SEM and LD) and to determine the CT measurement uncertainty. In addition, the measured
                                                             powder geometrical characteristics can be used to improve other CT-based analyses, including the analysis of internal porosity
                                                             of LPBF parts.

                                                             2     Investigated metal powders and samples preparation
                                                             Powder batches of different metal alloys (including Ti6Al4V, CuCrZr, AlSi10 and FeSi) were investigated in this work, in order
                                                             to increase the understanding about how CT can be effectively used to accurately measure powder with different composition

                                                                                                                               1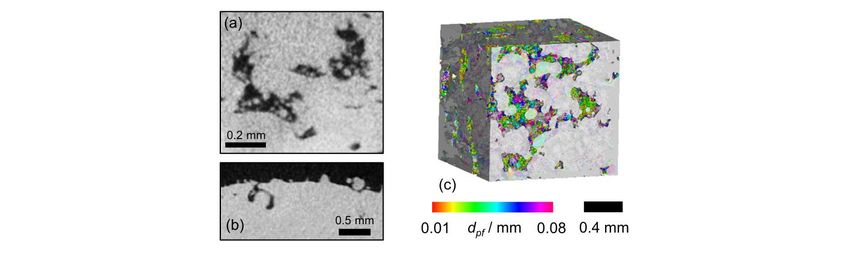
11th Conference on Industrial Computed Tomography, Wels, Austria (iCT 2022), www.ict-conference.com/2022
and density. In addition, all the analysed batches, composed of recovered powders, were characterized before being processed
by the final LPBF process, to study how different powder characteristics (i.e. size and shape) can influence the quality of parts
produced by LPBF.
Two sample configurations were designed: the first configuration was conceived to be suited for the comparison of X-ray CT
powder measurements with SEM measurements; the second configuration was instead considered for the comparison of X-ray
CT and LD powder measurements.
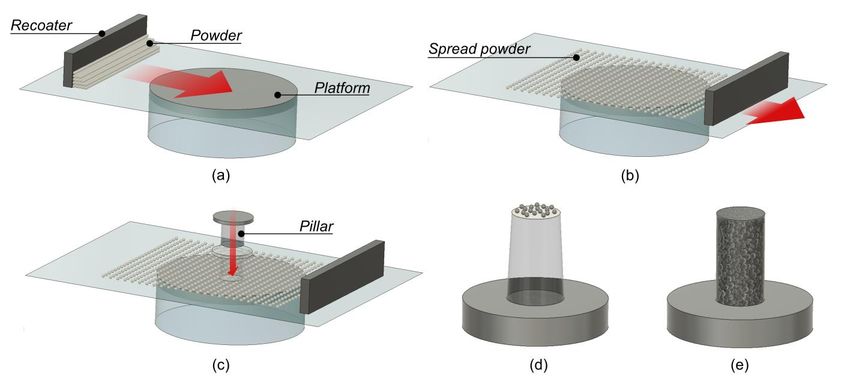
As a first step for the production of the first type of sample, an LPBF machine was used to perform an actual powder spreading
operation over the building platform (see Figure 1a and Figure 1b). The intent was to characterize powders after being subjected
to the mechanical action of the recoater, as normally occur before the laser action. A number of such particles were then attached
to the top surface of a polymeric pillar covered with carbon tape, by exerting a small pressure onto the spread powder with the
pillar’s top surface (see Figure 1c). Figure 1d shows a schematic representation of the obtained sample. The pillar was made of
polymeric material to not affect CT scans of powders, while the carbon tape was necessary for its adhesive function as well as
for enabling SEM analyses.
In the second sample, powder particles were inserted into a polymeric cylindrical container as illustrated in Figure 1e. This
configuration enabled the analysis of a higher number of particles, which is possible with CT and LD but not with SEM, gathering
higher statistics and a better comparison of CT and LD results.
For both samples, the contained dimensions of the regions of interest (diameters equal to 5 mm), were chosen to allow high-
resolution CT scans.
Figure 1: Schematic representation of the steps followed to prepare the powder samples to be analysed by CT and SEM: (a) setup of the used
LPBF machine, (b) powder spreading over the building platform operated by the recoater action, and (c) attachment of particles on the top
surface of a polymeric pillar covered with carbon tape. (d) Particles disposed above the polymeric pillar for CT and SEM analyses, and (e)
powder included in a cylindrical container for CT and LD characterization. The diameter is equal to 5 mm for both the pillar and the
container.
3 X-ray CT powder characterization and comparison with other methods
X-ray CT scans of powder samples designed as explained in Section 2 were all conducted using a metrological X-ray CT system
(Nikon Metrology MCT225; X-Tek Nikon Metrology, UK), equipped with micro-focus X-ray tube (minimum focal spot size
equal to 3 µm) and 16-bit flat panel detector with 2000×2000 pixels. The CT scanning parameters were optimized taking into
account the specific powder material and sample design, while the achieved voxel size was 3 µm in all cases. CT reconstructions
were elaborated through the following steps: (i) local-adaptive surface determination, (ii) binarization based on the determined
surface, (iii) watershed algorithm to separate individual particles, and (iv) computation of size (equivalent spherical diameter,
dp) and shape (circularity for 2D measurements and sphericity for 3D measurements). The first two steps were performed using
the analysis and visualization software VGStudio MAX 3.2 (Volume Graphics GmbH, Germany); the last two steps were
conducted using the open-source software ImageJ (National Institutes of Health, USA).
3.1 Comparison with SEM
A “multi-view” SEM analysis was implemented to image powder particles from different lateral views, with two main objectives:
(i) improving the comparison with 3D CT powder measurements, and (ii) investigating the limited representativeness of the most
common “single-view” SEM analysis. The “multi-view” analysis was conducted with a FEI Quanta 400 scanning electron
2
11th Conference on Industrial Computed Tomography, Wels, Austria (iCT 2022), www.ict-conference.com/2022

microscope (FEI Company, USA), by acquiring images from different configurations. Figure 2a depicts the main configuration,
where the SEM table was kept horizontal and the powder was imaged from above as normally done with SEM. An example of
acquired image related to a CuCrZr powder is reported in Figure 2b. For acquiring multiple images from lateral views, the SEM
table was then tilted by 60° and rotated around its axis as visible in Figure 2c. Figure 2d illustrates a lateral image of the same
CuCrZr powder of Figure 2b, showing that a single image can be not well representative of powders geometrical characteristics
in case of non-spherical particles.
The comparison of X-ray CT and SEM analyses, focused on powder size and shape, was made aligning CT volumes according
to the acquisition direction of SEM images). 2D images were analysed using ImageJ following these steps: (i) determination of
powder particles boundaries, (ii) binarization, (iii) watershed, and (iv) size and shape computation based on area and perimeter
measurements. Figure 3 shows a couple of comparison examples, one related to a Ti6Al4V powder with high sphericity (Figure
3a) and the other related to an AlSi10 powder with lower sphericity and more complex morphology (Figure 3b). The powder
contours extracted from 2D SEM images and corresponding CT aligned reconstructions are also shown superimposed in Figure
3a,b.
Even if the CT resolution is lower than SEM, the overall shape of particles was found to be well described by CT, independently
from the morphological complexity. The smallest details (e.g. the small spots attached to the powder surface) are instead not all
visible due to the lower CT resolution. Performing dimensional measurements on 2D SEM images of the same particles acquired
from different view directions showed that significant deviations can occur, especially for elongated and irregular particles, up
to 20% of the measured equivalent diameter in the investigated cases. In addition, it was noticed that such deviations are generally
higher than deviations obtained when comparing corresponding CT and SEM images. Moreover, in such cases, deviations
between 3D CT measurements and 2D SEM measurements were found to decrease when averaging results obtained from
multiple SEM images with respect to one single image taken from above. These results highlight the importance of conducting
3D measurements of powder particles rather than 2D measurements to better evaluate the actual dimension and shape of powder
particles.
However, when dealing with materials with higher X-ray attenuation coefficients (e.g. CuCrZr), the more intense presence of
blurring and image artifacts (e.g. beam hardening and metal artifacts) leaded to worst results, especially in terms of morphology
representation. For example, the comparison focused on the shape evaluation resulted in mean deviations of 5% for Ti6AlV, 6%
for AlSi10, and 8% for CuCrZr. Concerning the size evaluation, mean deviations were found to be 3% for Ti6AlV and AlSi10,
and 4% for CuCrZr.

 Figure 2: (a) First configuration for SEM analyses, with the table kept horizontal and powder imaged from above; (b) example of a CuCrZr
powder imaged with the first configuration; (c) second configuration for SEM analysis, with table tilted by 60° and rotated around its axis for
              acquiring multiple lateral images of powders; (d) the same CuCrZr powder imaged with the second configuration.

Figure 3: Examples of powders characterized by different materials and morphologies: Ti6Al4V particle with high sphericity (a) and AlSi10
   particle with lower sphericity (b). SEM images (left), CT reconstructions (center) and comparison of the extracted contours (right) are
                                                                  shown.

                                                                      3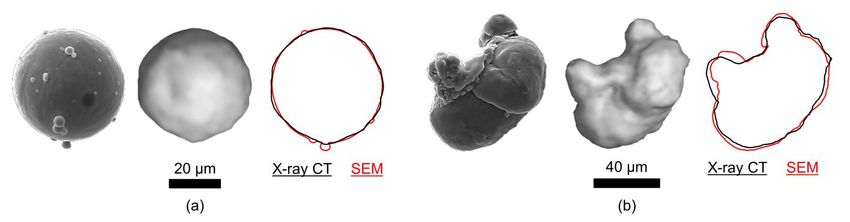
11th Conference on Industrial Computed Tomography, Wels, Austria (iCT 2022), www.ict-conference.com/2022

3.2    Comparison with LD
Laser diffraction was executed by the powder manufacturer with a Malvern Mastersizer 2000 instrument (Malvern Panalytical
Ltd, UK). Figure 4a shows an example of a 3D CT powder analysis conducted on a sample with the design seen in Figure 1d.
Figure 4b shows the cumulative dp distribution curves obtained in the case of CuCrZr powder (i.e. the material with the highest
X-ray attenuation coefficient among the investigated ones) by conducting both X-ray CT and LD analyses. The obtained D10,
D50 and D90 are compatible within a maximum deviation of 1.9 µm.

 Figure 4: (a) Example of powder size analysis on a CT 3D reconstruction; (b) cumulative dp distribution curves obtained with CT and LD in the
                                                            case of CuCrZr powder.

4 Improvement of porosity analyses based on CT powder measurements
The knowledge about powder geometrical characteristics obtained from CT measurements is used in this section to investigate
the influence of powder geometrical characteristics on the porosity of parts produced by LPBF using the powder batches
introduced in Section 2.
Porosity was analysed using the CT device described in Section 3 to exploit the CT capabilities of measuring also internal defects.
Concerning lack-of-fusion pores, they are typically characterized by irregular shape and presence of entrapped particles. Such
particles can be either partially-sintered powder particles (see Figure 5a) or spatters (see Figure 5b). In the first case, entrapped
particles have smaller dimensions (falling in a similar range of initial powder dimensions) and pores are mainly caused by an
insufficient volumetric energy density. In the second case, entrapped particles have larger dimensions and pores can be caused
by an insufficient inert gas flow, not capable of blowing away spatters from the powder bed.
An ongoing part of this work is focused on applying a feature-based surface analysis to the analysis of internal defects. A first
example is visible in Figure 5c, where an internal region of a flawed FeSi part was evaluated.

Figure 5: Examples of CT cross sections of LPBF parts showing (a) lack-of-fusion pores with entrapped non-totally sintered powder and (b)
              spatter particle generating a sub-surface defect; (c) example of 3D analysis of features entrapped within voids.

5     Conclusions
This work was aimed at enhancing the accuracy of CT measurements of powder size and shape, starting from the comparison
with other common methods, i.e. SEM and LD. In order to perform reliable and robust comparisons, an advanced methodology
was developed, including the design of appropriate samples and the implementation of a “multi-view” SEM powder
characterization. Such “multi-view” analysis demonstrated the non-optimal representativeness of 2D “single-view” analyses in
case of particles with complex morphology. Moreover, it enabled a comparison between CT and SEM results not limited to a

                                                                      4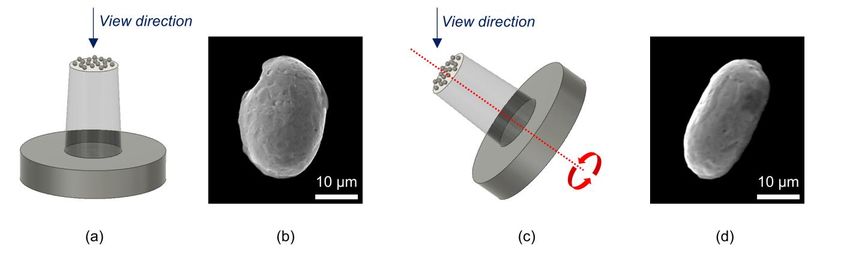
11th Conference on Industrial Computed Tomography, Wels, Austria (iCT 2022), www.ict-conference.com/2022

single 2D image only. It was shown that, even if the CT spatial resolution is significantly lower than SEM, CT can provide a
good representation of the overall powder shape and dimensions, independently from the powder morphological complexity,
with mean deviations between CT and SEM in the order of 6% for shape measurements and 3% for size measurements. Increased
difficulties were however registered for the material with the highest density (i.e. CuCrZr), with mean deviations of 8% and 4%
respectively for shape and size measurements, due to more intense blurring and image artefacts. Despite such difficulties, the
comparison with laser diffraction showed a contained maximum deviation of 2.2 µm with regard to D10, D50 and D90 values.
Furthermore, the potentiality of implementing the developed approach to improve the characterization of internal defects has
been shown through preliminary analyses, which are still ongoing. The use of nano-focus CT devices is also planned to further
improve the powder analysis thanks to the higher achievable resolution. Finally, further works will be also focused on the
application to advanced surface characterization of LPBF parts, and on the enhancement of powder spreading and compaction
simulations, using the CT gathered 3D reconstruction of powder geometries.

References
[1]   Leach, R., Carmignato, S. (Eds.). (2020). Precision Metal Additive Manufacturing. CRC Press.
[2]   Gibson, I., Rosen, D., Stucker, B., Khorasani, M. (2021). Additive manufacturing technologies. New York: Springer.
[3]   Wang, P., Salandari-Rabori, A., Dong, Q., Fallah, V. (2021). Effect of input powder attributes on optimized processing
      and as-built tensile properties in laser powder bed fusion of AlSi10Mg alloy. Journal of Manufacturing Processes, 64,
      633-647.
[4]   Beckers, D., Ellendt, N., Fritsching, U., Uhlenwinkel, V. (2020). Impact of process flow conditions on particle
      morphology in metal powder production via gas atomization. Advanced Powder Technology, 31(1), 300-311.
[5]   Popov Jr, V. V., Katz-Demyanetz, A., Garkun, A., & Bamberger, M. (2018). The effect of powder recycling on the
      mechanical properties and microstructure of electron beam melted Ti-6Al-4 V specimens. Additive Manufacturing, 22,
      834-843.
[6]   Powell, D., Rennie, A. E., Geekie, L., & Burns, N. (2020). Understanding powder degradation in metal additive
      manufacturing to allow the upcycling of recycled powders. Journal of Cleaner Production, 268, 122077.
[7]   Vock, S., Klöden, B., Kirchner, A., Weißgärber, T., Kieback, B. (2019). Powders for powder bed fusion: a review.
      Progress in Additive Manufacturing, 4(4), 383-397.
[8]   Slotwinski, J. A., Garboczi, E. J., Stutzman, P. E., Ferraris, C. F., Watson, S. S., Peltz, M. A. (2014). Characterization of
      metal powders used for additive manufacturing. Journal of research of the National Institute of Standards and
      Technology, 119, 460.
[9]   Du Plessis, A., Sperling, P., Beerlink, A., Du Preez, W. B., Le Roux, S. G. (2018). Standard method for microCT-based
      additive manufacturing quality control 4: Metal powder analysis. MethodsX, 5, 1336-1345.
[10] Jiang, X., Senin, N., Scott, P. J., Blateyron, F. (2021). Feature-based characterisation of surface topography and its
      application. CIRP Annals, 70(2), 681-702.

                                                                 5
You can also read