Cross-site Epileptic Seizure Detection Using Convolutional Neural Networks
←
→
Page content transcription
If your browser does not render page correctly, please read the page content below

Cross-site Epileptic Seizure Detection Using
                Convolutional Neural Networks
                Danielle Currey∗ , David Hsu† , Raheel Ahmed† , Archana Venkataraman‡ , Jeff Craley                    ‡
                          ∗ Department of Computer Science, Johns Hopkins University, Baltimore, MD
                         †
                         School of Medicine and Public Health, University of Wisconsin, Madison, WI
                ‡ Department of Electrical and Computer Engineering, Johns Hopkins University, Baltimore, MD

   Abstract—Automated epileptic seizure detection has been an           them to construct a boundary between seizure and non-seizure
active area of research for the last two decades. Yet few, if any,      data. Similarly, Random Forests (RFs) have been used in
of these methods are used in clinical practice because they fail        seizure detection in [9], [10]. RFs use an ensemble of simple
to generalize across different patient populations. We present
three simple Convolutional Neural Network (CNN) architectures           decision trees using random subsampling of the training data
for seizure detection that are capable of generalizing across           to train a classifier that is robust to overfitting.
sites. The convolutional layers automatically learn robust and              As deep learning methods continue to mature, they have
discriminative correlations directly from both the raw multi-           been applied to the problem of seizure detection [11]. The
channel scalp electroencephalography (EEG) signal and its short-        simplest deep learning architecture is the Multi-Layer Per-
time spectral representation. The models are trained on the
publicly available Children’s Hospital of Boston (CHB) data set         ceptron (MLP) which uses successive fully connected neural
in a leave-one-patient-out cross validation strategy. The trained       network layers to learn complex decision boundaries. Though
model is then tested on a data set recorded at the University of        simple compared to other deep learning architectures, the MLP
Wisconsin (UW). We demonstrate that our CNNs achieve higher             has sufficient complexity to outperform traditional machine
sensitivity than competing baselines, with only a minor increase        learning classifiers. This is shown in [10], where MLP classi-
in false positive rate. To our knowledge, this is the first work to
achieve inter-hospital seizure detection without a significant drop     fiers outperform RF and support vector machines in detecting
in performance, thus providing an important benchmark for the           seizures using time-frequency feature representations. While
seizure detection field.                                                typical MLP approaches rely on predetermined feature sets,
                                                                        [12] uses the MLP architecture to learn features for classifi-
                       I. I NTRODUCTION
                                                                        cation directly from the EEG signal.
   Epilepsy is a neurological disorder, characterized by bursts             Alternatively, CNNs have become popular due to their
of abnormal electrical activity in the brain that manifest as           success in various computer vision applications [13]. Ap-
seizures [1]. In 2015, more than 3.4 million people suffered            plying ideas directly from visual perception, time-frequency
from epilepsy in the United States, which underscores its pub-          spectrogram images are often used as input for 2D CNNs
lic health relevance [2]. Scalp electroencephalography (EEG)            for seizure detection. Yuan et al. constructed spectrograms
is the first modality used for epilepsy diagnosis and character-        to use in a seizure detection CNN [14]. The model used by
ization. Scalp EEG is typically recorded in the hospital over           [14] integrates inter- and intra-channel information in an auto-
several days in order to capture only a handful of seizures.            encoder structure. This is combined with a supervised seizure
These recordings are visually inspected for seizure activity            classifier to learn decision boundaries. Another approach by
which is a time consuming and error-prone process.                      Khan et al. used wavelets to capture time-frequency structure,
   While many automated seizure techniques have been in-                using them as input to a CNN architecture [15].
vestigated, the heterogeneity of epilepsy presentations adds                The use of one-dimensional convolutions has also been
complexity to the problem. Furthermore, to deploy pre-trained           proposed, where convolutions are applied directly to short
models at a new site, it is important to make sure that they            windows of signals. These filters are capable of partitioning
generalize and are robust to different patient populations.             the signals into discriminative frequency ranges, similar to a
Studies have shown that results suffer when models are used             filterbank. In this way, 1D CNNs automatically learn the bands
on new clinical data sets [3], [4]. In this work, we use deep           of interest from the data. This approach is used by Wei et al.
learning to address the problem of cross-site generalization.           where a 5-layer convolutional network is used [16]. Zou et al.
Namely, we propose a group of simple network architectures              applies a 1D CNN approach, sharing filters across channels to
based on Convolutional Neural Networks (CNNs).                          learn more robust representations of the data [17]. Similarly,
   Traditional machine learning approaches have applied many            [18] couples a 1D CNN with a recurrent neural network to
classifiers to the problem of seizure detection. Support vector         analyze seizure activity at short and long timescales.
machines are a popular classifier and have been used in [5]–                In this paper, we introduce a set of simple CNN ar-
[8]. This method identifies representative data points and uses         chitectures to address the challenges of generalization. The
  This work was supported by the NSF CAREER award 1845430 and a Johns   convolution operations automatically learn important features
Hopkins University Discovery Award.                                     about the frequency and phase information from the data,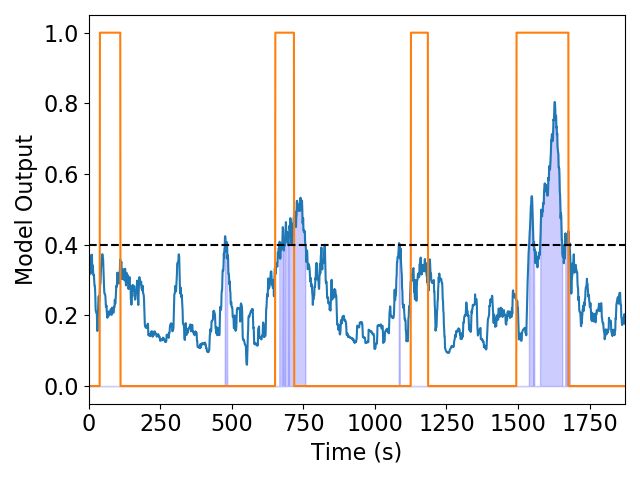
TABLE I
                                         C LINICAL ATTRIBUTES OF THE CHB AND UW DATA SETS .

                                                                     CHB Training data set      UW Generalization data set
                  Total Recording Time                                3527743 s (980 hours)        35164s (9.8 hours)
                  Number of Recordings                                          683                         53
                  Average Seizure Duration                                      60 s                       68 s
                  Minimum/Maximum Seizure Duration                           6 / 752 s                  13 / 212 s
                  Average Seizures per Patient                                  5.75                       4.4
                  Minimum/Maximum Number of Seizures per Patient               3 / 14                     1 / 18
                  Average Recording Time per Patient                         40.7 hrs                    0.8 hrs
                  Minimum/Maximum Recording Time                         19 hrs / 156 hrs            0.1 hr / 3.1 hrs
                  Average Seizure Time per Patient                            7.7 min                    6.9 min
                  Minimum/Maximum Seizure Time per Patient              1.4 min / 33.2 min         0.83 min / 42 min

and the low complexity of the proposed models reduces the
likelihood of overfitting to a single site. The CNNs capture
time-frequency information in different ways. For the 2D CNN
this information is obtained directly from the spectrogram
input, and for the 1D CNN it is learned from the signal
itself. We address the problem of cross-site generalization by
training the models on a data set acquired from Children’s
Hospital Boston (CHB), [5], [19] and evaluating it on a data
set from the University of Wisconsin, Madison (UW). We
compare our models to baselines that cover a representative
range of machine learning and neural network approaches. In
                                                                       Fig. 1. Rhythmic seizure activity. Corresponding peaks and troughs indicating
particular, we show that the CNN architectures outperform              a phase reversal localize this activity to the T8 electrode.
the Multi-Layer Perceptron (MLP) and Random Forest (RF)
based approaches. We demonstrate that our proposed CNN
architectures retain higher sensitivity on the UW data set. To         EEG recordings, each containing at least one seizure, totalling
our knowledge, this is the first demonstration of inter-patient        approximately 9.8 hours worth of recordings.
cross-site generalizations in the seizure detection literature.           For each data set, the EEG signals were low-pass filtered at
                                                                       30 Hz, as higher frequencies carry significant artifact activity
                         II. M ETHODS
                                                                       and little relevant information for seizure detection. In addi-
A. EEG Data                                                            tion, the signals were high-pass filtered at 1.6 Hz to remove
   To evaluate cross-site generalization, we use two disjoint          DC trends and physiological artifacts. Since the data can be
data sets for training and testing. Patient characteristics are        variable across patients and hospitals, it was normalized to
summarized in Table I. For training we use the publicly avail-         mean zero and standard deviation one for each channel in each
able Children’s Hospital of Boston (CHB) data set [5], [19].           EEG file individually. One second, non-overlapping intervals
This data set contains EEG recordings of 24 pediatric patients         were extracted and each second was labeled as seizure or
from the entire multi-day recording period. Importantly, it con-       baseline using annotations made by clinicians.
tains a large amount of both baseline and seizure EEG activity
from a diverse group of patients. EEG files are provided in the        B. CNN Architectures
longitudinal bipolar montage and were sampled at 256 Hz.                  In this work we evaluate three different CNN architectures
This data set consists of 683 EEG files and approximately              designed to encode time-frequency information. Motivated
980 hours of recordings. Each file is approximately 1 hour             by the abnormal rhythmic, highly correlated EEG activity
long and there are on average 5.75 seizures per patient.               indicative of seizure, our first architecture is a 1D CNN. Figure
   The generalization data set was acquired at the University          1 illustrates this activity, as rhythmic signal is observed in the
of Wisconsin (UW) and contains seizure recordings extracted            difference channels F8-T8 and T8-P8. The change in polarity
from longer continuous monitoring recordings. This data set            between the two difference channels, termed a phase reversal
contains a diverse set of patients but is smaller and contains far     in the clinical literature, indicates that the rhythmic activity
less baseline EEG than the CHB data set. While its smaller size        is maximal in the T8 channel [20]. 1D CNN architectures
and prominence of seizure complicates training, the data set           offer a natural way to capture both the rhythmicity of seizure
is still appropriate for validating generalization performance.        activity and the correlation of neighboring channels. Each 1D
This data set includes 12 pediatric patients with an average           convolution layer applies a set of filters to the input signal with
of 4.4 seizures per patient. The data was recorded at 256 Hz           access to cross-channel signals to capture correlated activity.
using the 10-20 common reference and was converted to the              Through hierarchical application of these layers, a filterbank-
longitudinal bipolar montage for this work. In total, we have 53       like representation that can be learned directly from the multi-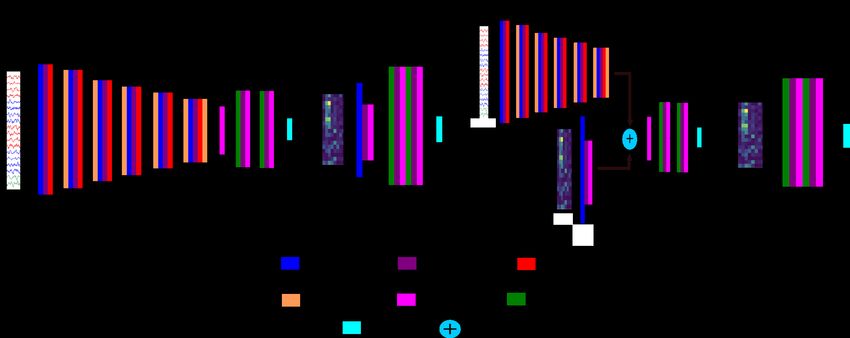
Fig. 2. The models used for seizure detection. (a) 1D CNN, (b) 2D CNN-Spectrogram, (c) CNN-Combined, (d) MLP baseline.

channel EEG signal is constructed. Taken together, the 1D               were trained only on files that contain at least one seizure.
CNN architecture is capable of learning to extract both relevant           Model outputs of seizure versus baseline can be noisy,
frequency and correlation information for seizure detection             so predictions are smoothed over 20 second windows to
from the raw multi-channel EEG input signal.                            encourage contiguous predictions during evaluation. As this
   The 1D CNN architecture is shown in Figure 2 (a). The                is a binary classification problem, outputs are between 0
model consists of 6 1D convolutional layers with kernels of             and 1. The threshold to determine what is seizure versus
size 5, stride of 1 and padding of 2, each followed by a 1D             baseline represents a trade off between sensitivity and false
max pooling layer with kernels of size 2 and a stride of 2. 1D          positives. This threshold was calibrated on the training set by
batch normalization was used after the max pooling layers.              maximizing sensitivity while keeping the total false positive
This was followed by 2 fully connected layers with 200 nodes            detections below 120 seconds per hour. The threshold obtained
each and the binary output layer.                                       on the training data was used on test data. Calibration was
   The second approach, shown in Figure 2 (b), uses a 2D                performed separately on the UW data to obtain new thresholds,
CNN operating on spectrogram images. Spectrograms use the               but the parameters and architecture were not tuned in any way.
fast Fourier transform to analyze frequency content of the EEG
signal. Spectrograms were extracted from each channel over
1 second windows and images were formed with frequency                  C. Baselines
bands from 0 to 30 Hz on one axis and channel on the
other for an image size of 30 × 18. The spectrogram images                 In addition, we compare our proposed CNN networks
were first passed through a single 2D convolutional layer               to two MLP classifiers. Where the use of the convolution
with a 5 × 5 kernel. Following the convolutional layer are              operation in CNN networks make implicit assumptions about
two fully connected layers, each with 100 nodes, and a final            the underlying structure of the input data, MLP classifiers treat
fully connected layer which outputs a binary seizure detection          each dimension of the input data as a separate feature. Here we
prediction for the input image.                                         use two time-frequency features, spectrogram and bandpass, to
   The third CNN model, shown in Figure 2 (c), concatenates             compare the time-frequency type extraction used by the CNN
the outputs from both the 1D and 2D CNNs to form an                     models. The former concatenates the spectrograms used in the
aggregated encoded representation. This concatenated hidden             2D CNN-Spectrogram model into a single vector for input
representation was classified using two fully connected layers          into the MLP. The latter was used in [21] and compresses
with 200 nodes each and an output layer for classification.             the information in the spectrograms according to clinically
All networks used LeakyReLU for all activations and dropout             observed brain wave frequencies in the theta (1–4 Hz), delta
with probability 0.2 between each fully connected layer.                (4–8 Hz), alpha (8–13 Hz), and beta (13–30 Hz) bands. Both
   The networks were trained for 20 epochs using ADAM                   the MLP-Spectrogram and MLP-Bandpass baselines use two
with a learning rate of 0.001 and batch size of 512. The loss           fully connected layers with 100 hidden nodes before a fully
function was Cross Entropy Loss. Due to the prominence of               connected binary classification layer. Finally, RFs are used
baseline activity, weighted sampling was used to over-sample            on the same bandpass and spectrogram features in the RF-
the seizure instances during training. In addition, the models          Spectrogram and RF-Bandpass baselines.
(a) 1D CNN                                 (b) 2D CNN-Spectrogram                                  (c) CNN-Combined

     (d) MLP-Spectrogram                     (e) MLP-Bandpass                      (f) RF-Spectrogram                       (g) RF-Bandpass
Fig. 3. Model outputs from the generalization experiment. The 1D CNN identifies two seizures while alternative methods identify the fourth seizure only.

D. Cross-Site Generalization Experimental Design
   The models were trained on the CHB data set using a
leave one patient out cross validation strategy. Specifically,
all files from a single patient were used for validation while
the network was trained on the data from the remaining 23
patients. This procedure was performed for each patient to
evaluate the ability of the model to generalize to unseen
patients recorded at the same site. The best performing training
model was then scored on the UW generalization data set to
evaluate cross-site generalization.

E. Evaluation
   We evaluate metrics at the level of independent EEG win-
dows and seizure sequences. Window level metrics treat each                   Fig. 4. An EEG recording from the UW data set. The 1D CNN classification
                                                                              is shaded in blue. The model finds the seizure onset shown by the dashed line
1 second window as an independent sample and as such do                       at 151 seconds, in accordance with the clinical annotation.
not consider the seizure as a contiguous time interval. Here
we evaluate sensitivity, false positive rate, and area under the
receiver operating characteristic (AUC-ROC) curve. Seizure                    a single site. By comparing cross-site generalization perfor-
level metrics evaluate the performance of each model by                       mance to models trained in the original data sets, we can
treating the entire seizure as one unit. At the seizure level,                determine the performance loss due to generalization.
seizure detection sensitivity, detection latency, and false posi-
tive count per hour were computed. Predictions are considered                                   III. E XPERIMENTAL R ESULTS
to be seizure if the prediction is above the calibrated detection
threshold and baseline if it is below. False positives per hour
calculates the number of times each model incorrectly predicts                A. Intra-Site Results
a seizure per hour. Seizure level sensitivity considers each                     Table II reports the intra-site and cross-site seizure detection
seizure prediction within an annotated seizure interval as a                  performance. When trained on the UW data set, the 1D CNN
correct classification. Latency time is computed by taking                    achieves the highest window level AUC-ROC with the lowest
the time difference between the first seizure prediction in the               false positive rate. Although the RF classifiers have the highest
seizure interval and the clinically annotated onset.                          seizure level sensitivity, this performance comes at the cost of
   In addition to our cross-site generalization experiment, we                greatly increased false positive rates. While exhibiting worse
report these same metrics on models trained and tested on                     overall performance, in the UW intra-site experiment the MLP
TABLE II
W INDOW AND SEIZURE LEVEL RESULTS FOR BOTH THE CHB AND UW DATA SETS .
Sensitivity Latency (s) False Positives Sensitivity False Positive AUC-ROC
(Seizure) (Count / hr) (Window) Rate
(Seconds / hr)
Cross-site Generalization, CHB → UW
1D CNN 0.893 -3.25 8.12 0.584 91.00 0.850
2D CNN-Spectrogram 0.796 -11.42 5.70 0.524 127.37 0.836
CNN-Combined 0.783 -10.98 5.98 0.530 161.83 0.841
MLP-Spectrogram 0.564 7.03 6.94 0.255 134.68 0.753
MLP-Bandass 0.469 9.81 7.20 0.226 229.22 0.685
RF-Spectrogram 0.871 18.70 4.52 0.476 88.87 0.873
RF-Bandpass 0.707 1.13 6.29 0.421 354.10 0.782
Single Site Training, UW
1D CNN 0.967 -11.60 16.80 0.796 215.05 0.884
2D CNN-Spectrogram 0.981 -21.77 45.14 0.823 595.41 0.836
CNN-Combined 0.972 -17.15 27.84 0.822 361.41 0.867
MLP-Spectrogram 0.938 -22.69 41.24 0.707 632.74 0.746
MLP-Bandpass 0.992 -65.68 24.66 0.752 825.38 0.644
RF-Spectrogram 1.0 -44.70 26.10 0.909 565.97 0.870
RF-Bandpass 0.997 -108.54 13.55 0.916 293.93 0.847
Single Site Training, CHB
1D CNN 0.957 0.06 9.54 0.881 131.47 0.989
2D CNN-Spectrogram 1 -6.34 8.21 0.998 127.26 0.998
CNN-Combined 1 -5.03 7.54 0.998 117.46 0.998
MLP-Spectrogram 0.477 16.21 4.54 0.227 53.79 0.864
MLP-Bandpass 0.768 1.27 7.71 0.533 120.18 0.863
RF-Spectrogram 0.803 2.87 6.17 0.694 113.17 0.902
RF-Bandpass 0.850 -139.74 8.79 0.72 312.71 0.893
baselines show seizure detection efficacy, achieving AUC- these baselines fail to identify seizure activity when applied
ROCs of 0.814 and 0.721 for the MLP-Spectrogram and MLP- cross-site. Overall, the CNN models have significantly higher
Bandpass, respectively. window level sensitivities than the MLP or RF baselines.
In the intra-site CHB experiment, all CNN models perform Figure 4 shows a seizure prediction from the 1D CNN
comparably with the combined network exhibiting the best model in a seizure from the UW data set. In the figure,
performance across most metrics. Notably, the 1D CNN shows windows labeled seizure are shaded blue. The 1D CNN
lower window level sensitivity (0.881) than the 2D CNN- model correctly predicts seizure activity corresponding to the
Spectrogram and CNN-Combined models (0.998 and 0.998), clinically annotated seizure onset occurring at 151 seconds.
while all three networks have similar seizure level sensitivity Figure 3 shows model outputs from a patient with seizures
(0.957, 1, and 1) and AUC-ROC (0.989, 0.998, and 0.998). that are difficult to identify. Although these seizures were not
When compared to the CNN methods, the MLP and RF as well identified by any of the models, the 1D CNN identified
methods show a similar decrease in performance as in the the second and last seizure, and the other two CNN models
intra-site UW experiment. Most methods show false positive identified parts of the final seizure, whereas the MLP and RF
rates close to 120 seconds per hour, indicating that the models baselines only partially identify the last seizure.
misclassify false positives at the original calibration rate.
IV. D ISCUSSION
B. Cross-Site Generalization Results In this work we propose 3 simple CNN architectures for
In the cross-site generalization experiment, the 1D CNN seizure detection and successfully show performance in a
achieves the highest seizure level and window level sensitivity. cross-site generalization experiment. To our knowledge, this
At the seizure level, the model correctly identifies 0.893 of experiment is the first in the seizure detection literature to
seizures with a window level sensitivity of 0.548. In addition, show generalization between data sets recorded at differ-
the 1D CNN maintains a false positive rate below the calibra- ent sites. Our first model uses 6 1D convolutional layers
tion point. The 2D CNN-Spectrogram and CNN-Combined to encode the multi-channel EEG directly from the signal
models achieve seizure level sensitivities of only 0.796 and itself. Effectively, this method extracts representations from
0.783, respectively. However, we note that the sensitivity hierarchical filtering operations. As phase information between
performance in the 1D CNN comes at the cost of increased channels is preserved through the 1D convolution layers, we
false positive count per hour, with 8.124. Comparatively the hypothesize that the 1D CNN encoder structure is uniquely
2D CNN-Spectrogram and CNN-Combined models show false able to learn filterbank type representations that encode cross-
positives per hour of 5.703 and 5.982. With the exception channel correlations as well. This structure encodes robust
of false positive rate, the MLP baselines show drastically hidden representations capable of detecting seizures across
worse performance across all metrics. This indicates that different recording sites and patient populations.Comparatively, the 2D CNN approach relies on spectrogram [2] M. M. Zack and R. Kobau, “National and state estimates of the
extraction as a preprocessing step. While spectrograms are a numbers of adults and children with active epilepsy—united states,
2015,” MMWR. Morbidity and mortality weekly report, vol. 66, no. 31,
natural way to encode time-frequency information, they fail p. 821, 2017.
to encode cross-channel correlations which may be preserved [3] K. Saab, J. Dunnmon, C. Ré, D. Rubin, and C. Lee-Messer, “Weak
by the 1D CNN. In the 2D CNN-Spectrogram and CNN- supervision as an efficient approach for automated seizure detection in
electroencephalography,” npj Digital Medicine, vol. 3, no. 1, pp. 1–12,
Combined models we see similar performance on intra-site 2020.
experiments, however these models exhibit a slight drop in [4] J. R. Zech, M. A. Badgeley, M. Liu, A. B. Costa, J. J. Titano, and
performance when applied across sites. As shown in Figure E. K. Oermann, “Variable generalization performance of a deep learning
model to detect pneumonia in chest radiographs: a cross-sectional study,”
3, the CNN models are able to identify seizures that the RF PLoS medicine, vol. 15, no. 11, p. e1002683, 2018.
and MLP baselines miss. This can be explained by the higher [5] A. H. Shoeb, “Application of machine learning to epileptic seizure onset
seizure level sensitivity of the CNN models. detection and treatment,” Ph.D. dissertation, Massachusetts Institute of
Technology, 2009.
The CNN models have negative latency in the generalization [6] A. H. Shoeb and J. V. Guttag, “Application of machine learning to
task. As false positive rate remains near the calibration point in epileptic seizure detection,” in Proceedings of the 27th International
this task, this phenomena is likely due to a combination of low Conference on Machine Learning (ICML-10), 2010, pp. 975–982.
[7] V. Sridevi, M. R. Reddy, K. Srinivasan, K. Radhakrishnan, C. Rathore,
detection threshold and temporal smoothing, resulting in early and D. S. Nayak, “Improved patient-independent system for detection
detections. This phenomena is likely responsible for the low of electrical onset of seizures,” Journal of Clinical Neurophysiology,
negative latencies in the intra-site CHB experiment as well. vol. 36, no. 1, p. 14, 2019.
[8] M. Bandarabadi, C. A. Teixeira, J. Rasekhi, and A. Dourado, “Epilep-
However, the high false positive rates in the UW intra-site tic seizure prediction using relative spectral power features,” Clinical
experiment indicate the calibration point set during training Neurophysiology, vol. 126, no. 2, pp. 237–248, 2015.
does not generalize to the left out test patient. This highlights [9] D. Wu, Z. Wang, L. Jiang, F. Dong, X. Wu, S. Wang, and Y. Ding, “Au-
tomatic epileptic seizures joint detection algorithm based on improved
the difficulty of training and calibrating in to the same data in multi-domain feature of ceeg and spike feature of aeeg,” IEEE Access,
a small data set where overfitting is likely. vol. 7, pp. 41 551–41 564, 2019.
While showing efficacy in the intra-site seizure detection [10] E. Alickovic, J. Kevric, and A. Subasi, “Performance evaluation of
empirical mode decomposition, discrete wavelet transform, and wavelet
task, the MLP-Spectrogram and MLP-Bandpass baselines fail packed decomposition for automated epileptic seizure detection and
in cross-site generalization. Notably, the MLP-Spectrogram prediction,” Biomedical signal processing and control, vol. 39, pp. 94–
and 2D CNN-Spectrogram share the same inputs. However, 102, 2018.
[11] A. Craik, Y. He, and J. L. Contreras-Vidal, “Deep learning for elec-
the 2D CNN-Spectrogram significantly outperforms the MLP- troencephalogram (eeg) classification tasks: a review,” Journal of neural
Spectrogram approach. This is likely due to the 2D CNN en- engineering, vol. 16, no. 3, p. 031001, 2019.
coding local similarities between neighboring frequencies and [12] A.-M. Tăuţan, M. Dogariu, and B. Ionescu, “Detection of epileptic
seizures using unsupervised learning techniques for feature extraction,”
channels in the spectrogram image. Thus despite containing in 2019 41st Annual International Conference of the IEEE Engineering
only one convolutional layer, the 2D CNN approach more in Medicine and Biology Society (EMBC). IEEE, 2019, pp. 2377–2381.
easily captures relevant cross-channel and cross-frequency [13] I. Goodfellow, Y. Bengio, and A. Courville, Deep Learning. MIT Press,
2016, http://www.deeplearningbook.org.
information in the spectrogram. [14] Y. Yuan, G. Xun, K. Jia, and A. Zhang, “A multi-view deep learning
framework for eeg seizure detection,” IEEE journal of biomedical and
V. C ONCLUSION health informatics, vol. 23, no. 1, pp. 83–94, 2018.
[15] H. Khan, L. Marcuse, M. Fields, K. Swann, and B. Yener, “Focal onset
We have evaluated 3 CNN approaches for seizure detection seizure prediction using convolutional networks,” IEEE Transactions on
Biomedical Engineering, vol. 65, no. 9, pp. 2109–2118, 2017.
which generalize both to new patients within the data set on [16] Z. Wei, J. Zou, J. Zhang, and J. Xu, “Automatic epileptic eeg detection
which it is trained on as well as patients on an unseen data using convolutional neural network with improvements in time-domain,”
set. To our knowledge, this is the first work to observe inter- Biomedical Signal Processing and Control, vol. 53, p. 101551, 2019.
[17] L. Zou, X. Liu, A. Jiang, and X. Zhousp, “Epileptic seizure detection
hospital generalization performance, where other studies have using deep convolutional network,” in 2018 IEEE 23rd International
noted significant drops in cross-site performance. We compare Conference on Digital Signal Processing (DSP). IEEE, 2018, pp. 1–4.
the CNN approaches to MLP and RF approaches using time- [18] J. Craley, E. Johnson, C. Jouny, and A. Venkataraman, “Automated inter-
patient seizure detection using multichannel convolutional and recurrent
frequency decompositions and observe superior generalization neural networks,” Biomedical Signal Processing and Control, vol. 64,
in the CNNs. Extensions to this work include training on p. 102360.
larger and more diverse data sets in order to boost performance [19] A. L. Goldberger, L. A. Amaral, L. Glass, J. M. Hausdorff, P. C.
Ivanov, R. G. Mark, J. E. Mietus, G. B. Moody, C.-K. Peng, and H. E.
and further improve generalization. This work explores how Stanley, “Physiobank, physiotoolkit, and physionet: components of a
models can be applied to different data sets and different new research resource for complex physiologic signals,” circulation, vol.
patient cohorts, but further work is needed to further develop 101, no. 23, pp. e215–e220, 2000.
[20] L. V. Marcuse, M. C. Fields, and J. J. Yoo, Rowan’s Primer of EEG
robust models that can be transferred across hospitals, epilepsy E-Book. Elsevier Health Sciences, 2015.
types, and patient populations. [21] J. Craley, E. Johnson, and A. Venkataraman, “A spatio-temporal model
of seizure propagation in focal epilepsy,” IEEE Transactions on Medical
R EFERENCES Imaging, pp. 1–1, 2019.
[1] R. S. Fisher, C. Acevedo, A. Arzimanoglou, A. Bogacz, J. H. Cross,
C. E. Elger, J. Engel Jr, L. Forsgren, J. A. French, M. Glynn et al.,
“Ilae official report: a practical clinical definition of epilepsy,” Epilepsia,
vol. 55, no. 4, pp. 475–482, 2014.You can also read