Cromwell European REIT - 3Q 2021 Business Update 3 November 2021 - Cromwell European REIT ...

Page created by Amy Fowler
 
CONTINUE READING
Cromwell European REIT - 3Q 2021 Business Update 3 November 2021 - Cromwell European REIT ...
Cromwell European REIT
3Q 2021 Business Update

3 November 2021
Cromwell European REIT - 3Q 2021 Business Update 3 November 2021 - Cromwell European REIT ...
Contents

 1   3Q 2021 Highlights

 2   Financial and Capital Management Highlights

 3   Portfolio and Asset Management Highlights

 4   European Economic and Market Update

 5   Key Takeaways and Priorities for 4Q 2021

 6   Appendix

                                                   3Q 2021 Business Update   2
Cromwell European REIT - 3Q 2021 Business Update 3 November 2021 - Cromwell European REIT ...
Quality Properties in European Gateway Cities

      Haagse Poort                      De Ruijterkade                               Bastion                 Centro Logistico Orlando Marconi           Parc Des Grésillons                       Green Office
Den Haag, The Netherlands      Amsterdam, The Netherlands                ’s-Hertogenbosch, The Netherlands         Monteprandone, Italy                    Paris, France                         Kraków, Poland

   Milano Piazza Affari            Göppinger Straße 1 – 3                          Kingsland 21                       Central Plaza                   Moravia Industrial Park                      Plaza Forte
       Milan, Italy                 Pforzheim, Germany                    Warrington, The United Kingdom       Rotterdam, The Netherlands       Uherské Hradiste, The Czech Republic            Helsinki, Finland

   Business Garden          Moorfleeter Straße 27, Liebigstraße 67-71)            Parc Des Docks                        Riverside                        Herstedvang 2-4               Nove Mesto ONE Industrial Park II SK
     Poznań, Poland                  Hamburg, Germany                              Paris, France                     Warsaw, Poland                   Copenhagen, Denmark                      Kočovce, Slovakia

                                                                                                                                                                        3Q 2021 Business Update                  3
Cromwell European REIT - 3Q 2021 Business Update 3 November 2021 - Cromwell European REIT ...
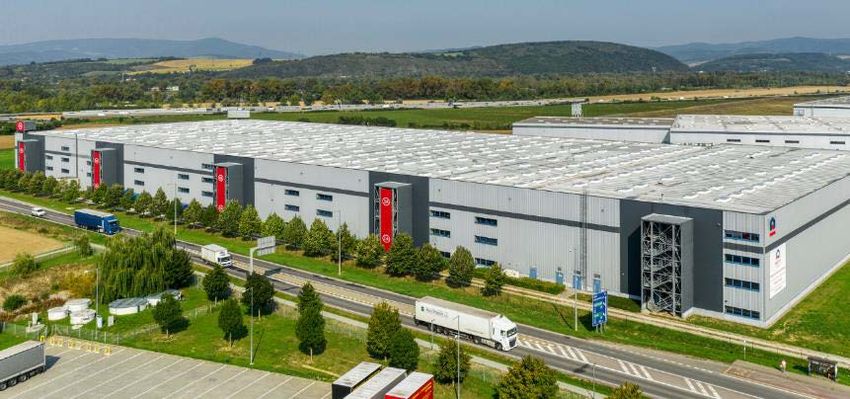
CEREIT’s Diversified Portfolio
Resilience and growth from asset management opportunities

                 The Netherlands                                   Properties                          1091                                          Finland
Properties                                           12            Occupancy Rate (by lettable area)   95.3%                   Properties                                11
Lettable Area (sqm)                             224,194            Portfolio Valuation                 2,366.9 million         Lettable Area (sqm)                   61,949
Valuation (€ million)                             639.8            WALE / WALB                         4.7 years / 3.2 years   Valuation (€ million)                  111.8
% of Portfolio                                   27.0%             % Freehold2 (by valuation)          92.4%                   % of Portfolio                         4.7%
Average Reversionary Yield                        6.0%             Average Reversionary Yield          6.6%                    Average Reversionary Yield             7.5%

                        Italy                                                                                                                        Denmark
Properties                                          20                                                                         Properties                                11
Lettable Area (sqm)                            533,065                                                                         Lettable Area (sqm)                  129,817
Valuation (€ million)                            537.4                                                                         Valuation (€ million)                   84.8
% of Portfolio                                  22.7%                                                                          % of Portfolio                         3.6%
Average Reversionary Yield                       6.0%                                                                          Average Reversionary Yield             8.4%

                      France                                                                                                                   The Czech Republic
Properties                                          21                                                                         Properties                                 7
Lettable Area (sqm)                            282,396                                                                         Lettable Area (sqm)                   59,499
Valuation (€ million)                            413.8                                                                         Valuation (€ million)                   61.1
% of Portfolio                                  17.5%                                                                          % of Portfolio                         2.6%
Average Reversionary Yield                       7.4%                                                                          Average Reversionary Yield             5.7%

                      Poland                                                                                                                         Slovakia
Properties                                           6                                                                         Properties                                 5
Lettable Area (sqm)                            111,241                                                                         Lettable Area (sqm)                   74,355
Valuation (€ million)                            235.8                                                                         Valuation (€ million)                   63.4
% of Portfolio                                  10.0%                                                                          % of Portfolio                         2.7%
Average Reversionary Yield                       8.4%                                                                          Average Reversionary Yield             6.2%

                      Germany                                                                                                                   United Kingdom
Properties                                          15                                                                         Properties                                1
Lettable Area (sqm)                            226,985                                                                         Lettable Area (sqm)                   9,764
Valuation (€ million)                            207.3                                                                         Purchase Price (€ million)             11.6
% of Portfolio                                   8.8%                                                                          % of Portfolio                        0.5%
Average Reversionary Yield                       5.7%                                                                          Reversionary Yield                    5.3%

                                1.   Including the latest acquisition in Mira, Greater Venice, Italy
                                2.   Freehold and continuing / perpetual leasehold
                                                                                                                                                  3Q 2021 Business Update     4
Cromwell European REIT - 3Q 2021 Business Update 3 November 2021 - Cromwell European REIT ...
1.
                 3Q 2021 Highlights
Kingsland 21, The United Kingdom      Nove Mesto One Industrial Park, The Czech Republic

                                                                                 5
Cromwell European REIT - 3Q 2021 Business Update 3 November 2021 - Cromwell European REIT ...
Resilient Performance in 3Q 2021
3Q 2021 financial and capital management highlights

 Portfolio                                             €33.2 million                                                 €24.3 million                                       €4.326 cents
 diversification                                       Net property                                                  Distributable                                       Indicative DPU
 continues to                                          Income                                                        Income                                              YTD 2021 indicative DPU
                                                       YTD 2021 NPI 10.3% higher                                     YTD 2021 DI 4.9% higher vs. pcp                     €12.828 cents 2.1% higher vs.
                                                       vs. pcp (€97.4 million)                                       (€70.4 million)                                     pcp on a like-for-like basis1
 underpin
 performance in
                                                       35.8%                                                         5.8x                                                3.5-year
 3Q 2021                                               Net       gearing2                                            Interest                                            WADE
                                                        37.8% aggregate leverage2 is                                 coverage4                                           As at 30 Sep 2021;
                                                        within range set by the Board                                                                                    amongst the top 5 longest WADE
                                                                                                                     Calculated in line with MAS
                                                                                                                     definitions                                         profiles for REITs in Singapore3

 Active leasing                                        95.3%                                                         +1.2%                                               +2.8%
 supports strong                                       portfolio                                                    rent reversion                                       Like-for-like NPI
                                                       occupancy                                                     +4.1% for YTD 2021                                  growth
 occupancy and                                         As at 30 Sep 2021                                                                                                 YTD 2021 vs. pcp (€2.4
                                                       Up +1 p.p. vs. 30 Sep 2020                                                                                        million higher)
 positive rent
 reversions                                            45,532 sqm                                                    4.7-year                                            ~40%
                                                       (47 leases)                                                   WALE                                                Portfolio
                                                       YTD 2021 new leases and                                       As at 30 Sep 2021                                   weighting to
                                                       renewals cover 130,700 sqm                                                                                        logistics
                                                       (160 leases)                                                                                                      As at 30 Sep 2021

                     1.   As compared to pcp. Like-for-like excludes the €2.8 million of realised capital gains that were included in distributable income in FY 2020
                     2.   Net gearing is total debt less cash over total assets less cash. Aggregate leverage is 37.8% as per the Property Funds Appendix
                     3.   As at 30 June 2021                                                                                                                            3Q 2021 Business Update          6
                     4.   Calculated as per the Property Funds Appendix based on net income before tax, fair value changes and finance costs divided by interest
                          expense and amortised debt establishment costs
Cromwell European REIT - 3Q 2021 Business Update 3 November 2021 - Cromwell European REIT ...
Rise in Occupancy and Positive Rent Reversions
  Resilience of income supported by active asset management, CPI indexation, rent reversions1 and acquisitions

                  Overall portfolio                                                       Light industrial / logistics                                                                  Office
        100%                                        20%                                  100%                                      20%                                   100%                               20%

            95%                                     15%                                  95%                                       15%                                   95%                                15%

                                                           Rent Reversion1

                                                                                                                                           Rent Reversion1

                                                                                                                                                                                                                      Rent Reversion1
            90%                                     10%                                  90%                                       10%                                   90%                                10%
Occupancy

                                                                             Occupancy

                                                                                                                                                             Occupancy
            85%                                     5%                                   85%                                       5%                                    85%                                5%

            80%                                     0%                                   80%                                       0%                                    80%                                0%

            75%                                     -5%                                  75%                                       -5%                                   75%                                -5%

                  Rent Reversion        Occupancy                                               Rent Reversion        Occupancy                                                 Rent Reversion     Occupancy

                                   1.   Calculated as a percentage with the numerator the new headline rent of all modified, renewed or new leases over the
                                        relevant period and denominator the last passing rent of the areas being subject to modified, renewed or new leases
                                                                                                                                                                                      3Q 2021 Business Update     7
Cromwell European REIT - 3Q 2021 Business Update 3 November 2021 - Cromwell European REIT ...
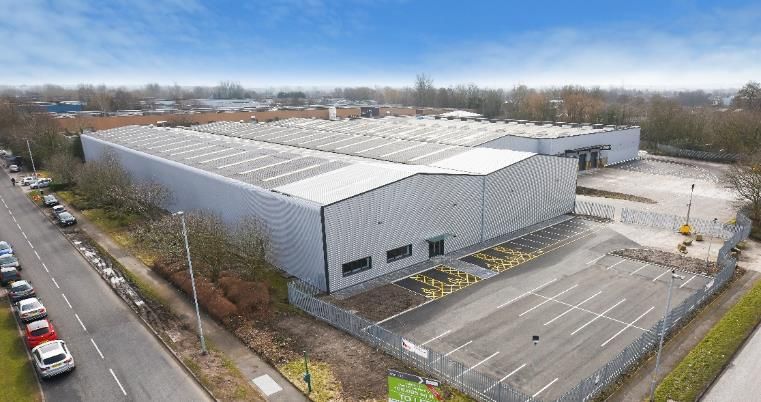
Pivot to Logistics Supported by Market Fundamentals
E-commerce continues to drive occupier demand in European logistics

 European logistics outlook: vacancy rates (%)                                                        Average quarterly logistics market rent growth1 (%)

  16                                                                                                   1.2
  14
                                                                                                       1.0
  12
                                                                                                       0.8
  10
      8                                                                                                0.6
      6
                                                                                                       0.4
      4
                                                                                                       0.2
      2
      0                                                                                                0.0

                                                                                                      -0.2

                                                                                                      -0.4
          Denmark            France                            Germany
                                                                                                      -0.6
          Italy              Netherlands                       Czech Republic
          Slovakia

Light industrial / logistics vacancy rates 3Q 2021 (%) in CEREIT’s countries of operations
 10
 8
 6
 4                                                                                                                                                            Average 3.25%
 2
 0
          Slovakia        France              The Netherlands                    Italy                Czech Republic                   Germany   Denmark      United Kingdom

                     1.    Covers the overall average quarterly logistics rent growth across all of CEREIT’s countries of operations

                                                                                                                                                   3Q 2021 Business Update     8
Cromwell European REIT - 3Q 2021 Business Update 3 November 2021 - Cromwell European REIT ...
Executing the Pivot to Logistics
Advanced pipeline of opportunities under review, supported by attractive spread between European logistics prime yield and European bonds

 CEREIT’s current pivot towards a 50% portfolio weighting to the light                                                                    Prime logistics yield vs. 10Y Eurobond3
  industrial / logistics sector is supported by attractive prime logistics yield to                                             %
  bond spreads at >4%                                                                                                           6.0
                                                                                                                                5.0
 Already completed ~€262 million¹ in light industrial / logistics acquisitions (at                                             4.0
  a 6.7% blended NOI yield²) since the beginning of 2020 in Germany, the                                                        3.0
                                                                                                                                2.0
  Czech Republic, Slovakia, Italy and the UK
                                                                                                                                1.0
 Advanced pipeline of opportunities under review in Western Europe, including                                                  0.0
                                                                                                                               -1.0
  Germany, the Netherlands, Italy and the UK
 Industrial property investment across Europe in 2021 has so far proven to be
  exceptional – transaction volume YTD is up by 85%, in comparison to a five-                                                           Spread              Average Prime Yield    10Y Eurobond
  year pre-pandemic average

 Hradec Kralove, the Czech Republic                             Kingsland 21, the United Kingdom                                         Mira, Italy
  €10.1 million | 6.3% NOI yield                                  €11.6 million | 5.6% NOI yield                                          €19.6 million | 6.5% NOI yield

                             1.    Five asset acquisitions completed in FY 2020 and 14 asset acquisitions in YTD 2021 (including Mira in Greater Venice, Italy
                                   announced on 1 November 2021)
                             2.    NOI yield is calculated as the annualised Day 1 net operating income pre-asset management fees divided by the purchase price      3Q 2021 Business Update      9
                                   including transaction costs
                             3.    Prime logistics yields; Sources: CBRE / EuroBond and Eikon Thomson Reuters
Cromwell European REIT - 3Q 2021 Business Update 3 November 2021 - Cromwell European REIT ...
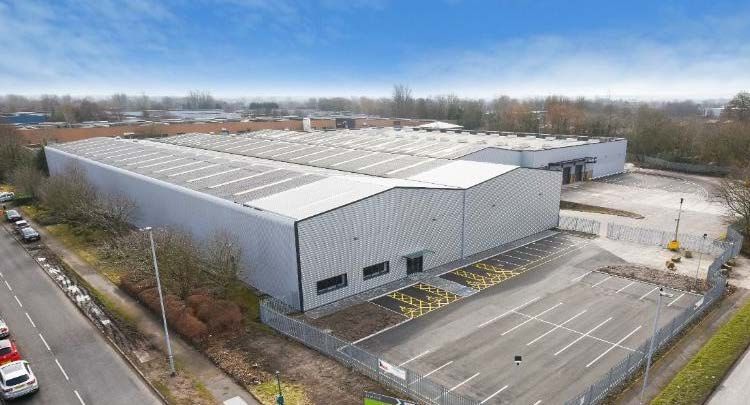
Improved Liquidity and Market Performance
Among the largest new additions to the FTSE EPRA Nareit global Index series (Developed Asia)

 CEREIT daily trading volume and share price                                       Total return YTD (as at 26 Oct 2021)
60,000,000                                                                3.00    25

                                                                                  20                                                               17.84%
50,000,000                                                                2.50                                                                     CEREIT €
                                                                                                                                                   (CWBU)
                                                                                  15
40,000,000                                                                2.00                                                                     14.87%
                                                                                                                                                   Straits Times
                                                                                  10                                                               Index
30,000,000                                                                1.50
                                                                                    5
                                                                                                                                                   5.14%
20,000,000                                                                                                                                         FTSE ST
                                                                          1.00
                                                                                    0                                                              REIT Index

10,000,000                                                                0.50     -5

        0                                                                 0.00    -10
         Oct-20   Dec-20   Feb-21     Apr-21   Jun-21   Aug-21   Oct-21             Jan-21    Mar-21       May-21     Jul-21         Sep-21

                       Turnover (€)            Share Price (€)                           CEREIT € (CWBU)       Straits Times Index      FTSE ST REIT Index

                                                                                  Included in FTSE EPRA Nareit Global Developed Asia Index
                                                                                   with effect from 21 September 2021
                                                                                  Upgraded to the FTSE ST Mid Cap Index, following FTSE
                                                                                   Russell’s semi-annual review to the FTSE ST Index Series
                                                                                  A constituent of more than 370 indices including the S&P Asia
                                                                                   Pacific REIT Index, FTSE ST REIT Index, FTSE ST Mid Cap
                                                                                   Index, MSCI Singapore Investable Market Index, MSCI Singapore
                                                                                   All Cap Index, iEdge S-REIT Index and iEdge SG ESG Leaders
                                                                                   Index, amongst others

                                                                                                                           3Q 2021 Business Update       10
ESG Credentials and Recognition
ESG commitment and integration in day-to-day management of portfolio and operations

 Key ESG ratings results and achievements

                            GRESB¹ Public Disclosure Level

                     Overall score of 76 points (4% YoY                                           23 BREEAM2 ratings and 1 LEED3
                      increase)                                                                     Platinum Certification as at 7 October                                                      Double win at the EPRA4
                     Maintained ‘Green Star’ status                                                2021                                                                                         Sustainability Best Practice
                     Achieved public disclosure score of                                                                                                                                        Recommendations Awards for
                      98 points and “A” grade                                                                                                                                                    excellence in ESG reporting

 Recognitions for corporate governance and transparency                                                                  ESG ratings upgrade

                                                                                                                                                                                                16.4
                                                                                                                                                                                               Low Risk
                                                 Centre of Governance
                                                 and Sustainability
                                                 NUS Business School
                                                                                                                           Upgraded score5 by two-     Two-point YoY decrease for
 Winner of Singapore Corporate  Ranked within top 10 for 2020                                                             notches YoY                  risk
  Governance Award in the         and 2021 at the Singapore                                                                Recognised for “stronger    Recognised for “strong
  REITs & Business Trusts         Governance & Transparency                                                                 business ethics programmes   company disclosure”
  category                        Index (SGTI)                                                                              and green building focus”
                       1.     As at October 2021
                       2.     Building Research Establishment Environment Assessment Method
                       3.     Leadership in Energy and Environmental Design
                       4.     European Public Real Estate                                                                                                                                          3Q 2021 Business Update      11
                       5.     Disclaimer Statement: CEREIT’s use of any MSCI ESG Research LLG or its affiliates (“MSCI”) data, and the use of MSCI logos, trademarks, service marks or index
                              names herein, do not constitute a sponsorship, endorsement, recommendation, or promotion of CEREIT by MSCI. MSCI services and data are the property of MSCI or
                              its information providers, and are provided ‘as-is’ and without warranty. MSCI names and logos are trademarks or service marks of MSCI.
2.
Financial and Capital Management
Highlights
Like-for-like DPU up 2.1%1 YTD 2021 vs. pcp
Like-for-like NPI up 2.8% vs. pcp

    YTD 2021 indicative DPU was 2.2% lower than YTD 2020 mainly due to
       i.   a slight delay between financing and completing recent acquisitions funded by the private placement;
       ii. higher average cash balance (earning zero rate)
       iii. higher interest due to refinancing debt through bond issues which have extended WADE profile; and
       iv. the absence of payment of capital gains where €2.8 million was paid out in 1H 2020 (equivalent to €0.55 cents in 1H
            2020 DPU)

                                                                                   3Q 2021              3Q 2020             Variance             YTD 2021                YTD 2020    Variance

Gross Revenue (€’000)                                                                50,653              46,092                 9.9%              149,672                139,752       7.1%

NPI (€’000)                                                                         33,157               30,593                 8.4%               97,444                 88,314       10.3%

Net Income Before Fair Value Changes but After
                                                                                    23,617               21,671                 9.0%               68,106                 63,200       7.8%
Current Tax

Total Return for the Period Attributable to Unitholders
                                                                                    21,270               19,323                10.1%               81,809                 37,748      > 100%
(€’000)

Income available for distribution to Unitholders (€’000)                            24,272               22,549                 7.6%               70,431                 67,114       4.9%

Indicative DPU (€ cents)                                                             4.326                4.393               (1.5%)               12.828                 13.110       (2.2%)

DPU on a like-for-like1 basis (€ cents)                                                                                                            12.828                 12.560       2.1%

                           1.   As compared to pcp. Like-for-like excludes the €2.8 million of realised capital gains that were included in distributable income in FY
                                2020
                                                                                                                                                                         3Q 2021 Business Update   13
Resilient Balance Sheet
Adjusted NAV excluding distributable income largely unchanged at €2.45 per unit

                              As at 30 Sep 2021   As at 31 Dec 2020
                                    €’000               €’000                                    Comments
                                 (unless stated      (unless stated
                                   otherwise)          otherwise)

                                                                      Cash available from operations to provide initial funding for
Cash & Cash Equivalents             76,882              43,593
                                                                      acquisitions
Receivables                         15,040              15,943        High cash collection rate maintained over the period

Other Current Assets                 748                1,397
                                                                      Largely due to new acquisitions in the Czech Republic,
Non-Current Assets                2,359,796           2,189,519
                                                                      Slovakia and UK and fair value gains as at 30 June 2021
Total Assets                      2,452,466           2,250,452

Current Liabilities                 73,642              56,876

Non-Current Liabilities            980,208             891,424        Increase in debt to partially fund acquisitions

Total Liabilities                 1,053,850            948,300
Net Assets Attributable to
                                  1,398,616           1,302,152
Unitholders
Units in Issue (‘000)              561,045             511,216        Private placement units issued on 5 March 2021

NAV per Unit (€ cents)               2.49                2.55         Adjusted NAV excluding DI largely unchanged at €2.45
                                                                      Excludes €50.9 million deferred tax in relation to fair value
EPRA NRV per Unit (€ cents)          2.58                2.62
                                                                      gains

                                                                                                              3Q 2021 Business Update   14
Active Capital Management
Gearing below 40%, high coverage ratio, low interest cost, 91% unsecured debt and all metrics within loan / bond covenants

        37.8%                                        5.8x                                                 ~1.72% p.a.                                                 BBB-
        Aggregate    leverage1                       Coverage            ratio2                           All-in interest rate                                        Fitch Rating
        Within Board’s medium                        Well in excess of loan                                Total gross debt is                                        Investment grade
        term range of 35 – 40%                       and EMTN covenants                                    fully hedged / fixed                                       (stable outlook)
                                                                                                                                                                      recently reaffirmed

                                               As at 30 Sep 2021                                      As at 31 Dec 2020                                           Bond covenant

 Total Gross Debt                                  €927.4 million                                         €857.4 million                                               N.A.

 Aggregate Leverage1                                     37.8%                                                  38.1%                                                 ≤ 60%

 Net Gearing                                             35.8%                                                  36.9%                                                  N.A.

 Interest Coverage Ratio2                                  5.8x                                                   6.4x                                                 ≥ 2x

 Priority Debt3                                           3.4%                                                   3.6%                                                 ≤ 35%

 Unencumbrance Ratio3                                   247.7%                                                 251.0%                                                > 170%

 Weighted Average Term to
                                                       3.5 years                                              3.8 years                                                N.A.
 Maturity

                        1.   Calculated as per the Property Funds Appendix (“PFA”). Leverage Ratio as per the EMTN prospectus is 36%, defined as consolidated
                             net borrowings (including capitalised finance leases and excluding cash and cash equivalents) divided by consolidated total assets
                        2.   Calculated as per the PFA based on net income before tax, fair value changes and finance costs divided by interest expense and       3Q 2021 Business Update   15
                             amortised establishment costs. Interest Cover (excluding amortised establishment costs is 7.2x)
                        3.   As defined in the EMTN prospectus
Debt Maturity Profile
Minimal near-term expiring debt following successful bond issuances

 No debt expiry until November 2022. Terms have been agreed in principle with syndicate banks to extend €157 million of the €180
  million expiring in 2022 for further one year. Proforma WADE will improve to 3.7 years after the extension

 €200 million RCF with a 2024 expiry remains undrawn, which provides ample liquidity

 Weighted average interest rate of 1.94% on the combined €500 million November 2025 Bond

 Pro-forma debt maturity profile
    € million

         600
         500
         400
         300
                                                                                             200                              500
         200
         100                                          180                                    165
                                                                                                                                           82.4
           0
                         2021                        2022                    2023            2024                            2025         2026

                 % of Total
                                                     19.4%                                   17.8%                         53.9%           8.9%
                Debt Drawn

                              Secured Loans                  Unsecured Loans (exclude RCF)         Unsecured RCF (Undrawn)          2025 Bond
                              Total: €82.4 million           Total: €345 million                   Total Facility: €200 million     Total: €500 million

                                                                                                                                    3Q 2021 Business Update   16
Debt Transformed – Bond Trading Well
BBB-investment grade (stable outlook) credit rating from Fitch Ratings recently reaffirmed

  Debt Transformation                                             CEREIT Nov 2025 Bond and BBB- REIT Comparables – Bid Yield1
            Dec 2017                                (Yield-to-Maturity, %)
  Secured
   93%                                                 4.00

                                                       3.50

                                                       3.00

                                                       2.50
                   Unsecured
                      7%
                                                       2.00

            Dec 2019                                   1.50

Secured                                                1.00
 28%
                                                       0.50

                                                       0.00
                                                          Jan-21        Feb-21    Mar-21   Apr-21   May-21     Jun-21     Jul-21    Aug-21      Sep-21   Oct-21   Nov-21

                       Unsecured                                                           Cromwell EREIT (-/-/BBB-) 2.125% 11/19/2025
                         72%                                                               Immobiliare Grande (-/BBB-/BBB-) 2.125% 11/28/2024
                                                                                           Equinix (Baa3/BBB-/BBB-) 0.25% 3/15/2027
                                                                                           Tritax EuroBox (-/-/BBB-) 0.95% 6/2/2026

 Secured
            Sep 2021
   9%                                                     November 2025 bond has traded strongly since issuance in November 2020 /
                                                           February 2021
                                                          Actively exploring further diversification of capital sources to make CEREIT’s portfolio
                                                           more future-ready via acquisitions, divestments and redevelopments
                                                          Board is committed to include 15% – 20% of CEREIT’s capital structure in perpetual
                           Unsecured
                             91%
                                                           securities on a long-term basis

                                   1.   Source: Bloomberg as at 1 November 2021
                                                                                                                                                3Q 2021 Business Update    17
3.
Portfolio and Asset Management Highlights
95.3% Portfolio Occupancy Highest-to-date
Portfolio management highlights for 3Q 2021

                Overall portfolio                                              Light industrial / logistics                                                            Office

                  95.3%                                                                  95.6%                                                                 93.2%
                  portfolio occupancy                                                    portfolio occupancy                                                  portfolio occupancy
                  Up from 94.3% as at                                                    Up from 92.3% as at                                                  Down from 94.9% as at
                  September 2020                                                         September 2020                                                       September 2020

                   4.7-year1                                                             4.8-year                                                              4.1-year
                  WALE                                                                   WALE                                                                  WALE

 Occupancy by country                                                                                           Occupancy by sector
 100%                                                                                                         100%

  90%                                                                                                          90%

  80%                                                                                                          80%

  70%                                                                                                          70%
        IPO    1Q   2Q   3Q   4Q   1Q   2Q   3Q   4Q   1Q   2Q   3Q   4Q   1Q   2Q   3Q                                 IPO    1Q   2Q   3Q   4Q   1Q   2Q   3Q   4Q   1Q   2Q   3Q   4Q   1Q   2Q   3Q
              2018 2018 2018 2018 2019 2019 2019 2019 2020 2020 2020 2020 2021 2021 2021                                      2018 2018 2018 2018 2019 2019 2019 2019 2020 2020 2020 2020 2021 2021 2021

         Denmark                        Finland                              France
         Germany                        Italy                                The Netherlands
         Poland                         The Czech Republic                   Slovakia                                         Light Industrial/Logistics      Office           Other            TOTAL
         United Kingdom                 TOTAL

                                   1.     Including ‘others’ (three government-let campuses, one leisure / retail property and one hotel in Italy)

                                                                                                                                                                        3Q 2021 Business Update            19
3Q 2021 Leasing Accelerated
Rent reversion +1.2% across the portfolio in 3Q 2021, with 41.8% income expiry up to 31 Mar 2022 de-risked

     Occupancy largely boosted by strong leasing in the light industrial / logistics portfolio in Denmark, offset by weakness
      in Polish office sector

                            Sqm leased / leases                                              Rent reversion                      Tenant-customer retention rate
 3Q 2021                        45,532 sqm
                                47 new and renewed leases1
                                                                                                       +1.2%                                     47%
 YTD 2021                       130,700 sqm
                                160 new and renewed leases2
                                                                                                       +4.3%                                     51%

 Lease expiry as at 30 September 2021
                                                                                                                                            62.8%

     41.8% of breaks and expiries until
     31 Mar 2022 have been de-risked                                                                                                                   35.4%
                                                                           Long WALE (4.7 years) and WALB (3.2 years)
            as of 30 Sep 2021                                              Top 10 tenant-customers’ WALE is 5.9 years
                                                    26.3%
                                                                                             19.4%
                                    12.0%                                                                                    12.7%
                                                                              10.1%                            8.8%
     6.3%          6.3%

            2021                             2022                                     2023                            2024                   2025 and beyond

                                                         % by WALE                                     % by WALB

                           1.     Comprises 29 new leases (24,821 sqm) and 18 renewals (20,711 sqm)
                           2.     Comprises 104 new leases (62,952 sqm) and 56 renewals (67,748 sqm)
                                                                                                                                         3Q 2021 Business Update   20
3Q 2021 CEREIT Light Industrial / Logistics Portfolio Performance
Assets in most countries are close to or at 100% occupancy, reflecting strong tenant-customer demand from 3PL, ecommerce and “just in case” inventory

       Positive +2.7% rent reversion and higher tenant-customer retention across all countries in 3Q 2021 as compared to YTD 2021
       Majority (~65%) of vacancies coming up in next six months already de-risked, nearing full occupancy for the sector

                                             Sqm leased / leases                                                Rent reversion                           Tenant-customer retention rate
    3Q 2021                                    34,918 sqm                                                                 +2.7%                                                55%
                                               25 new and renewed leases1
    YTD 2021                                   101,258 sqm                                                                +3.6%                                                48%
                                               98 new and renewed leases2
            Country              %3                      Occupancy (as at)                                              WALE (as at)                                     WALB (as at)
                                             30 Sep 21         30 Jun 21            Variance           30 Sep 21         30 Jun 21       Variance            30 Sep 21    30 Jun 21       Variance
    Denmark                     9.3%          86.9%               80.0%               6.9 p.p.           3.4 years       3.5 years      (0.1) years          3.2 years     3.3 years     (0.1) years
    France                     37.9%          93.5%               92.6%              0.9 p.p.            5.2 years       5.3 years      (0.1) years          2.1 years     2.0 years      0.1 years
    Germany                    22.8%          96.2%               95.6%              0.6 p.p.            5.4 years       5.3 years       0.1 years           5.2 years     5.2 years           -
    Italy                       7.5%          99.6%               99.7%             (0.1) p.p.           3.7 years       3.0 years       0.7 years           1.9 years     1.1 years      0.8 years
    The Netherlands             7.4%          100.0%             100.0%                   -              3.1 years       3.2 years      (0.1) years          3.1 years     3.2 years     (0.1) years
    The Czech
                                6.7%          99.6%               99.6%                   -              6.5 years       6.7 years      (0.2) years          6.5 years     6.7 years     (0.2) years
    Republic
    Slovakia                    7.0%          100.0%              99.6%              0.4 p.p.            5.1 years       5.0 years       0.1 years           4.8 years     4.8 years           -
    United Kingdom              1.3%          100.0%                  -                   -              9.7 years           -                -              4.6 years         -               -
    TOTAL                                     95.6%               94.3%              1.3 p.p.           4.8 years        4.8 years            -              3.4 years    3.3 years       0.1 years

                                                                                              Lease expiry profile
            64.9% of breaks and expiries until 31 Mar 2022
                have been de-risked as of 30 Sep 2021                                                                                                                     57.3%
                                                                     28.2%                                                                                                             31.4%
                                                      17.4%                                      11.9%          19.3%                                16.9%
                4.2%          4.3%                                                                                                     9.2%

                       2021                                   2022                                        2023                                2024                         2025 and beyond
                                                                                         % by WALE         % by WALB

                                        1.     Comprises 14 new (20,962 sqm) and 11 renewals (13,956)
                                        2.     Comprises 66 new (55,246 sqm) and 32 renewals (46,012 sqm)                                                            3Q 2021 Business Update           21
                                        3.     Percentage of light industrial / logistics sector by valuation
Active Leasing of Light Industrial / Logistics Vacancy
Portfolio management highlights for 3Q 2021

 Denmark                                                              Germany

  5,495 sqm new leases signed with two tenant-customers in            8,674 sqm lease renewal with a single tenant-customer in
   Priorparken 800, increasing the occupancy rate of the asset from     Siemensstraße 11, Stuttgart-Frickenhausen
   36% to 74%                                                          4,345 sqm new lease signed with single tenant-customer in Duisburg

 France                                                               Slovakia

  6,307 sqm new leases and 2,913 sqm renewals signed with a             4,335 sqm ten-year lease with a single tenant-customer at Nove
   number of tenant-customers across several assets. 2,048 sqm of         Mesto III
   these are with a single tenant-customer in Bois du Tambour,
   increasing the occupancy rate of the asset from 63% to 75% QoQ

                                                                                                                3Q 2021 Business Update      22
3Q 2021 CEREIT Office Portfolio Performance
CEREIT has good exposure to the Dutch office market, which is seeing good demand from recovery

        -0.7% rent reversion largely due to a small sample size of one lease renewal of hotel meeting rooms in France
        Occupancy in Polish portfolio dropped predominantly due to pressure from new supply

                                        Sqm leased / leases                                                Rent reversion                           Tenant-customer retention rate

 3Q 2021                                    10,614 sqm                                                                 -0.7%                                                43%
                                            22 new and renewed leases1
 YTD 2021                                   28,227 sqm                                                                 +7.3%                                                52%
                                            60 new and renewed leases2
         Country                  %3                       Occupancy (as at)                                           WALE (as at)                                 WALB (as at)

                                            30 Sep 21            30 Jun 21            Variance           30 Sep 21     30 Jun 21        Variance        30 Sep 21    30 Jun 21           Variance

 Finland                       8.5%           81.8%                82.8%               (1.0) p.p.          3.1 years    3.1 years           -           2.9 years     2.8 years         0.1 years

 France                        5.3%           85.6%                84.2%               1.4 p.p.            3.0 years    2.7 years       0.3 years       2.0 years     1.9 years         0.1 years

 Italy                        24.7%           98.5%                98.5%                   -               5.1 years    5.4 years     (0.3) years       2.3 years     2.6 years         (0.3) years

 The Netherlands              43.6%           97.5%                97.3%               0.2 p.p.            4.5 years    4.7 years     (0.2) years       4.1 years     4.3 years         (0.2) years

 Poland                       17.9%           88.5%                93.5%              (5.0) p.p.           2.9 years    2.9 years           -           2.5 years     2.5 years              -

 TOTAL                                        93.2%                94.3%              (1.1) p.p.         4.1 years      4.2 years     (0.1) years       3.1 years    3.2 years          (0.1) years

    Lease expiry profile
                                                                                                                                                                    61.4%
         18.3% of breaks and expiries until 31 Mar 2022
             have been de-risked as of 30 Sep 2021                                                                                                                                41.1%
                                                                 18.3%                                      20.1%
             8.7%          8.8%                   10.0%                                    9.9%                                 10.0%           11.7%

                    2021                                  2022                                      2023                                2024                          2025 and beyond
                                                                                    % by WALE              % by WALB

                                       1.    Comprises 15 new (3,859 sqm) and 7 renewals (6,755)
                                       2.    Comprises 38 new (7,706 sqm) and 22 renewals (20,521 sqm)                                                         3Q 2021 Business Update                23
                                       3.    Percentage of office sector by valuation
Active Leasing of Office Vacancy
Portfolio management highlights for 3Q 2021

 Poland                                                             Italy

  2,771 sqm new leases and renewals signed across a number of        9-year lease extension signed with a single tenant-customer
   assets, 1,635 sqm of these are a renewal with a single tenant-      occupying 1,744 sqm in Pianciani, Roma
   customer in Business Garden, Poznan

 Finland                                                            The Netherlands

  2,744 sqm new leases and renewals signed across a number of       Single tenant-customer has signed renewal of 790 sqm and taken
   assets                                                             up an additional 258 sqm space for a term of 7 years in Blaak -
                                                                      Rotterdam

                                                                                                              3Q 2021 Business Update   24
European Office Market Update
Prime offices are still in demand, but secondary office vacancy rates are rising

 Office vacancy rates (%)                                            Office rents (€ per sqm)

   20                                                                1,000

   16                                                                 800

   12                                                                 600

       8                                                              400

       4                                                              200

       0                                                                0

           Ile-de-France           Paris CBD                                 Ile-de-France        Paris CBD
           Milan CBD               Amsterdam Zuidas (CBD)                    Milan CBD            Amsterdam Zuidas (CBD)
           Warsaw City Centre      Helsinki - Helsinki City Centre           Warsaw City Centre   Helsinki - Helsinki City Centre

Office vacancy rates for main office markets in Europe 3Q 2021 (%)
 16%
 12%                                                                                                             Average 8.5%
  8%
  4%
  0%

                                                                                                  3Q 2021 Business Update           25
Cromwell European Office Market Insights
On-the-ground insights based on direct market feedback and tenant-customer engagement

                                                                                        3Q 2021 Business Update
4.
 European Economic and
 Market Update
Parc de Villeneuve-Lès-Béziers, 2, rue Charles Nicolle,   An der Kreuzlache 8-12, Bischofsheim,
Villeneuve-lès-Béziers, France                            West Germany

                                                                                                  27
Eurozone Maintaining Strong Momentum
Pent-up demand to fuel recovery in consumption

   Europe 3Q 2021 GDP growth printed 2.2% quarter-on-quarter                Eurozone GDP growth & contributions (%)
    expansion, exceeding expectations, with France and Italy +3.0%
                                                                               6
    and +2.6% respectively
                                                                               4
   Free-spending consumers and investments are expected to
    continue to drive 5.0% and 4.5% GDP growth in 2021/22 (Oxford              2

    Economics)                                                                 0

   Consumer spending is expected to grow by 3.7% this year and               -2

    7.1% in 2022, after the 8.0% drop in 2020                                 -4

   Some supply side restrictions will lead to less strong industrial         -6

    production offset by the Next Generation EU recovery plan,                -8
    expanding overall investment activity of 4~4.5% in 2021/22                     2015 2016 2017 2018 2019 2020 2021 2022 2023
                                                                                     Consumption              Investment
   Vaccination progress is expected to keep infection rates in check in             Stockbuilding            Government Spending
    the winter, and the death rate has continued to decline but the risk             Net Exports              GDP growth

    of further restrictions has not disappeared. Lingering restrictions on   Eurozone consumption growth (%)
    some indoor activities and a degree of voluntary social distancing        8
    could dampen services activity, particularly if the Delta variant         6
    causes a surge in infections                                              4
                                                                              2
   October CPI printed at 4.1% year-on-year, up from 3.4% in
                                                                              0
    September, with core inflation at 2.1%, above ECB target of 2.0%,
                                                                              -2
    even deducting high energy prices. This should feed through to            -4
    higher rent growth, given CPI reviews in each CEREIT lease                -6
                                                                              -8
                                                                             -10
                                                                                   2015 2016 2017 2018 2019 2020 2021 2022 2023

                        Source: Oxford Economics                                                                                    28
                                                                                                     3Q 2021 Business Update
European Real Estate Investment Volumes
Strong pick-up in activity in 3Q 2021

  Commercial real estate investment                                    Investment volume by sector¹
   volumes reached €61 billion in 3Q 2021,
   down 9% from 2Q 2021                                                  € Billions
                                                                        400
  The office sector accounted for 31% of
   total investment volume during the first
   three quarters of the year, with strong                              350
   demand for quality assets in well-
   connected locations                                                  300

  Industrial activity accounted for 21% of
   the total investment volume or €38 billion,                          250
   over the same period
  The share of investments into the retail                             200

   sector has increased slightly to 10% or
   €18.4 billion, as investors continued to                             150
   rebalance their portfolios and focus on
   strategic assets and locations
                                                                        100
  Investor demand for real estate assets is
   expected to remain firm in the final                                  50
   quarter of 2021, driven by higher returns
   compared to other asset classes
                                                                          0
                                                                              2007 2008 2009 2010 2011 2012 2013 2014 2015 2016 2017 2018 2019 2020 2021

                                                                                 Apartment         Hotel              Industrial             Office
                                                                                 Retail            Other              10 Year Average

                        Source: Real Capital Analytics as at Oct 2021
                                                                                                                                   3Q 2021 Business Update   29
COVID-19 Vaccine Rollout in Europe

Progress in the vaccine uptake among adults (18+) in CEREIT’s countries of operation¹                                                         The EU-27 countries have
                                                                                                                                               already achieved 80.2%
                                                                                                                                               cumulative uptake of at least
                                                                                                                                               one vaccination and 75.1% of
          Portugal                                      91.3%                                            7.3% 98.6%
                                                                                                                                               the population are fully
            Spain                                   83.9%                                        7.1% 91.0%                                    vaccinated1 (adults aged 18
           France                                 80.5%                                        9.0%     89.5%                                  and above)
         Denmark                                      88.1%                                       1.2%89.3%                                   EU has successfully achieved
          Finland                                 80.8%                                       6.8% 87.6%                                       its target to fully vaccinate 70%
                                                                                                                                               of adults (aged 18 and above)
             Italy                                80.1%                                       7.4% 87.5%
                                                                                                                                               in August2
  The Netherlands                                 79.5%                                      7.7%     87.2%
                                                                                                                                              Progress in countries’
   United Kingdom                                 79.3%                                      7.4% 86.7%                                        vaccination campaigns and
          Sweden                                   81.7%                                      3.9% 85.6%                                       containment measures have
         Germany                                  79.3%                                    3.4% 82.7%
                                                                                                                                               given reason to governments
                                                                                                                                               across the region to lift travel
  European Union                                75.1%                                   5.1% 80.2%
                                                                                                                                               restrictions within Europe
      Luxembourg                                75.2%                                 2.2%77.4%
                                                                                                                                              The EU Digital COVID
The Czech Republic                          66.8%                             1.1%67.9%                                                        Certificate is now being used
           Poland                        61.2%                           3.0% 64.2%                                                            across Europe
         Slovakia                    52.8%                      1.3%54.1%                                                                     More European countries are
                    0.0%        20.0%             40.0%              60.0%               80.0%              100.0%             120.0%
                                                                                                                                               introducing 'green passes' to
                                                                                                                                               control who can enter indoor
                           Share of people fully vaccinated against Covid-19                                                                   venues such as restaurants
                           Share of people only partly vaccinated against Covid-19

                           1.   Source: European Centre for Disease Prevention and Control & coronavirus.data.gov.uk as at 29 October 2021
                           2.   Source: Reuters, “EU says it has reached goal of vaccinating 70% of adults”, 31 August 2021
                                                                                                                                                       3Q 2021 Business Update     30
5.
                      Key Takeaways

Nove Mesto One Industrial Park III, Slovakia   Kingsland Estate, Warrington, United Kingdom

                                                                                  31
Key Takeaways and Priorities for 4Q 2021
Beyond the ongoing COVID-19 pandemic, key focus is on lifting light industrial / logistics exposure

                                           Income resilience has been supported by the post-COVID-19 lockdown rebound in European
  Executing the strategy                    economic conditions, the effectiveness of active asset management strategy and the accretive light
  yields results                            industrial / logistics acquisitions
                                           CEREIT is among the largest recent additions to the FTSE EPRA Nareit global Index series
                                            (Developed Asia) and is a constituent of more than 370 indices, resulting in improved liquidity and
                                            market performance
                                           Continued ESG commitment and integration in day-to-day management of portfolio and operations

                                           YTD 2021 indicative DPU +2.1% higher on like-for-like1 basis vs. pcp
  Portfolio diversification                Positive 3Q 2021 rent reversion at +1.2%; YTD 2021 rent reversion at +4.1%
  continues to underpin                    +2.8% YTD 2021 NPI growth on a like-for-like basis vs. pcp, with the light industrial / logistics portfolio
  performance in 3Q                         delivering an even higher +3.3% increase
  2021                                     Record occupancy at 95.3% as at 30 September 2021, +1 p.p. up from 94.3% as at September 2020
                                           WALE profile maintained at 4.7 years

                                           Europe’s continued economic recovery is providing positive momentum and confidence
  FY 2021 priorities
                                           CEREIT’s ongoing pivot towards a 50% portfolio weighting to light industrial / logistics is supported
  support long-term                         by the sector’s continuing strength, and underpinned by the structural shift towards e-commerce
  growth in DPU and                        Advanced pipeline of ‘New Economy’ opportunities under review in Western Europe, including
  NAV per unit                              Germany, the Netherlands, Italy and the UK. These aspirations can be funded by CEREIT’s cash
                                            position of €76.9 million and help CEREIT to access to diverse funding sources and capital recycling
                                           Actively exploring further diversification of capital sources to make CEREIT’s portfolio more future-
                                            ready via acquisitions, divestments and redevelopments
                                           YTD 2021 results demonstrate pan-European execution capabilities and validate focus on active
                                            asset and capital management, acquisitions, divestments and redevelopments

                      1.   Like-for-like excludes the €2.8 million of realised capital gains that were included in distributable income in FY 2020

                                                                                                                                                     3Q 2021 Business Update   32
6.
Appendix
6a.
                European Real Estate Update and
                Outlook
Parc des Docks, 50 rue Ardoin, Saint   Folkstoneweg 5-15, Schiphol
Ouen, France                           The Netherlands

                                                                     34
Cross-Border Investment in European Real Estate
International capital continues to look to Europe for investment opportunities

Capital and gateway cities are targets for international investors

European real estate market review                                           Cross-border activity: 12 months to 3Q 2021

 Capital inflows into the European real estate
  market reached €19.7 billion in 3Q 2021

 Industrial property investment across Europe in
  2021 has so far proven to be exceptional.
  Transaction volume year-to-date is up 56%
  versus the same period in 2020 and up by 85%                                                                          €66.2
  in comparison to a five-year pre-pandemic                                                                            BILLION
                                                                                            €48.7
  average                                                                              BILLION                        EUROPE NON-
                                                                                                                        DOMESTIC
                                                                                        THE AMERICAS
 The UK sits ahead of Germany in the                                                                  EUROPE                            €12.6
  investment rankings for both the quarter and                                                                                           BILLION
  the year, with strong demand for industrial
                                                                                                                                          APAC
  stock in particular driving the recovery from the
  COVID-19 pandemic                                                                                                €4.0
                                                                                                                 BILLION

 France is the only one of Europe’s top five                                                                   MIDDLE EAST AND
                                                                                                                     AFRICA

  countries where deal volume was lower in the
  third quarter than a year ago. The Parisian
  office market, which usually accounts for
  around 50% of all investment in France, has
  slowed in 2021 after a relatively buoyant 2020

                              Source: Real Capital Analytics – data as of 29 October 2021                                         3Q 2021 Business Update   35
6b.
3Q and YTD 2021 Portfolio Highlights
CEREIT Property Portfolio Statistics
Low capital values and high reversionary yields provide further growth potential for NAV and NPI, through rental reversion, index inclusion, higher
occupancy and asset enhancement initiatives
                                                   No. of                   Valuation       Reversionary                         NPI        Number of
                                                            NLA (sqm)                                      Occupancy (%)
                                                   Assets                  (€ million)        Yield (%)                       (€ million)    Leases
 The Netherlands (total)                            12       224,194          639.8              6.0             98.0            22.0          194
 •    Office                                         7       177,902          572.3              6.0             97.5            19.5           52
 •    Light Industrial & Logistics                   5       46,292           67.5               6.4            100.0            2.5           142
 Italy (total)                                      19       505,278          517.8              6.0             99.4            23.6           89
 •    Office                                        12       142,177          324.0              5.6             98.5            12.8           52
  •   Light Industrial & Logistics                   2       186,526          67.9               7.5             99.6            3.3            28
  •   Others                                         5       176,575          125.9              6.2            100.0            7.5            9
  France (total)                                    21       282,396          413.8              7.4             92.6            19.3          240
  •   Office                                         3       34,320           70.1               8.1             85.6            4.4            31
  •   Light Industrial & Logistics                  18       248,076          343.7              7.2             93.5            14.9          209
  Germany (total) – Light Industrial &               15      226,985          207.3              5.7             96.2            7.9            63
  Logistics
  Poland (total) – Office                            6       111,241          235.8              8.4             88.5            12.1           98
  Finland (total) – Office                           11      61,949           111.8              7.5             81.8            4.5           209
  Denmark (total) - Light Industrial / Logistics     11      129,817          84.8               8.4             86.9            4.0           110
  The Czech Republic (total) - Light Industrial      7       59,499           61.1               5.7             99.6            1.7            13
  / Logistics
 Slovakia (total) - Light Industrial / Logistics     5       74,355           63.4               6.2            100.0            2.2            10
 United Kingdom (total) - Light Industrial /         1        9,764           11.6               5.3            100.0            0.1            1
 Logistics
 Office (total)                                     39       527,589         1,314.0             6.5             93.2            53.3          442
 Light Industrial and Logistics (total)             64       981,314          907.3              6.8             95.6            36.6          576
 Others (total)                                      5       176,575          125.9              6.2            100.0            7.5            9
 TOTAL                                              108     1,685,478        2,347.3             6.6             95.3            97.4         1,027

                                                                                                                          3Q 2021 Business Update       37
6c.
CEREIT Overview
CEREIT Overview
Focus on resilience and diversification

                                                                                                                                  FINLAND
CEREIT is a diversified, pan-European REIT with a
                                                                                                                                  Properties   11
commercial real estate portfolio valued at €2.4 billion
                                                                                                                                  POLAND
CEREIT is managed by Cromwell EREIT Management
Pte. Ltd. (“Manager”), a wholly-owned subsidiary of
                                                                                   €2.4 BILLION2                                  Properties    6
                                                                                  DIVERSIFIED PORTFOLIO
CEREIT’s sponsor, Cromwell Property Group
(“Cromwell”). Cromwell is an experienced property
                                                                                                                                  DENMARK
manager with a 20+ year track record in Europe, with 17                                                                           Properties   11
offices in 12 European countries
                                                                                                                                  THE
                                                                                                                                                                GERMANY
                                                                                                                                  NETHERLANDS
Investment Strategy
                                                                                                                                                                Properties    15
                                                                                                                                  Properties   12
 Long-term target portfolio of at least 75% or more within
  Western Europe and at least 75% or more in office and                           1092                                                                          THE CZECH
  light industrial / logistics                                                     PRIMARILY FREEHOLD                                                           REPUBLIC
                                                                                   PROPERTIES
                                                                                                                                                                Properties    7
 Tactically targeting towards a 50% portfolio weighting to
  light industrial / logistics
                                                                                                                                                                SLOVAKIA
Highlights                                                                                                                                                      Properties     5

 Resilient portfolio of predominantly office and light                                                                                                         FRANCE
  industrial / logistics properties, diversified across                             10
  geographies, tenant-customers and trade sectors                                  EUROPEAN                                                                     Properties    21
                                                                                   COUNTRIES
 85% weighted to Western Europe and ~95% office and
                                                                                                                                                                ITALY
  light industrial / logistics assets
                                                                                                                                                                Properties    20
 Blend of Core (60%)1, Core Plus (32%) and Value-add
  (8%) assets with a long WALE of 4.7 years                                                                                                                     UK
 Investment-grade rating ‘BBB-’ (stable) by Fitch Ratings
                                                                                  1.7 million sqm                                                               Properties    1
 Cromwell owns 28% of CEREIT, its largest investment,                             NET LETTABLE AREA
  demonstrating strong alignment with unitholders

                              1.   Includes ‘prime’
                              2.   Including the latest acquisition in Mira, Greater Venice, Italy completed on 1 November 2021

                                                                                                                                                    3Q 2021 Business Update        39
CEREIT’s Track Record Since IPO
CEREIT continues to target accretive high-quality assets in strategic, “on-theme” cities and markets

     Close to €500 million raised in equity since IPO to support acquisitions

     Dec 2018: Raised €224             Jun 2019: Raised €150
     million in a rights issue         million in a private
                                                                                                                                                                                                            €2.367
     of 600 million units.             placement of 326 million                                                                                                                                             billion
     More than 99% of                  units. Transaction more                                  €2.082                                                                                                      PORTFOLIO
     Unitholders took up               than 2.4x oversubscribed
                                                                                                billion                                  €2.075
                                                                                                                                                                                                            VALUE
     their pro-rata rights
                                                                                                PORTFOLIO                                                                €2.178                             Oct 2021
                                                             €1.795                                                                      billion
                                      €1.696
                                                                                                VALUE                                                                    billion
                                                             billion                                                                     PORTFOLIO
                                                                                                                                                                                                              1091
                                                                                                Sep 2019
                                                                                                                                                                                                      108
                                                                                                                                                                         PORTFOLIO
                                      billion                PORTFOLIO                                                                   VALUE                           VALUE
                                      PORTFOLIO              VALUE                                                                        Mar 2020                       Dec 2020         107
                                      VALUE                  Feb 2019
                   €1.390                                                                   103           103
                                      Dec 2018                                 102                                                                                                               €2.347
                   billion
                   PORTFOLIO                                                                                  €2.103                 94              95             96                           billion
                   VALUE
                                        93        97                                 €1.993                   billion
                                                                                                                                                                                                 PORTFOLIO
                                 90
                   Jun 2018 -                                                                                                                                                                    VALUE
                   Jul 2018                                                          billion                  PORTFOLIO                                   €2.082                                 Sep 2021
                                                                                     PORTFOLIO                VALUE                                       billion
                                                                                     VALUE                    Dec 2019                                    PORTFOLIO
              75                 77                         €1.716                   Jul 2019
                                                                                                                                                                                             €2.295
74
                                                                                                                                                          VALUE
                                                                                                                                                          Jun 2020 -                         billion
                                                            billion                                                                                       Aug 2020                           PORTFOLIO
 €1.354                               €1.428                PORTFOLIO                                                                                                                        VALUE
                                                            VALUE
 billion                              billion              Jan 2019
                                                                                                                                                                                             Mar 2021
 PORTFOLIO                            PORTFOLIO
 VALUE                                VALUE                                                                     Mar 2021: Raised €100 million in oversubscribed                                   #     Properties
 Nov 2017 -                                                                                                     private placement of 232 million units
 Apr 2018                             Dec 2018

               2017 / 2018                                                     2019                                                           2020                                              2021
                                 1.     Including the new acquisition in the United Kingdom on 4 August 2021 (Kingsland Grange) and the new acquisition in Italy on 1 November (Mira)

                                                                                                                                                                                        3Q 2021 Business Update        40
CEREIT – Executing the Strategy
Resilience of income from enlarged portfolio size and enhanced geographical diversification

Portfolio breakdown by asset class                                                                                Portfolio breakdown by geography

                                10%                                                                                                                       6%
     As at                                                                                                              As at                        8%                         The Netherlands
  31 Dec 2017                                                  Light Industrial /                                    31 Dec 2017                                  34%
                                                               Logistics                                                                                                        Italy
                                €1.35bn            43%                                                                                         23%      €1.35bn                 France
                                                               Office
                          47%                                                                                                                                                   Germany
                                                               Others 2                                                                                    29%                  Denmark

                                                                                                                                         The Czech United Kingdom                        The
                                                                                                                                                         0%        Slovakia              Netherlands
                                                                                                                                          Republic
                                                                                                                                                                     3%                  Italy
     As at                                                                                                              As at               3%
                                                                                                                                              Denmark
  30 Sep 2021                   Others
                                                                                                                     30 Sep 2021                4%                                       France
                                                                                                                                          Finland
                                 5%                                                                                                         5%                The Netherlands
                                                                                                                                                                   27%                   Poland
                                                                                                                                      Germany
                                                  Light Industrial          Light Industrial                                            9%
                                                    / Logistics                                                                                                                          Germany
                                                                            / Logistics
                                                       39%
                                €2.35bn                                     Office                                                    Poland         €2.35bn                             Finland
                                                                                     1
                                                                                                                                       10%
                                                                            Others                                                                                                       Denmark
                 Office                                                                                                                                            Italy
                 56%                                                                                                                           France              22%                   The Czech
                                                                                                                                                18%                                      Republic
                                                                                                                                                                                         Slovakia

                                                                                                                                                                                         United
                                                                                                                                                                                         Kingdom
                          1.     Others include three government-let campuses, one leisure / retail property and one hotel in Italy

                                                                                                                                                                   3Q 2021 Business Update             41
CEREIT – Executing the Strategy
Resilience of income from enhanced tenant-customer base and industry trade sector diversification

Total no. of leases as at 30 September 2021                                                                                                               1,027

Total no. of tenant-customers as at 30 September 2021                                                                                                       839

                        Top 10 tenant-customers                                                                                Industry trade sector breakdown1
                                                                            % of Total
 #          Tenant-customer                         Country
                                                                          Headline Rent1
      Agenzia del Demanio (Italian
 1                                          Italy                              12.0%                                                                     9%              15%
      State Property Office)
                                                                                                                                                  3%
 2    Nationale-Nederlanden                 The Netherlands                     5.6%                                                        3%
                                                                                                                                           4%
 3    Essent Nederland                      The Netherlands                     2.4%
                                                                                                                                          4%                                        14%
      Employee Insurance
 4                                          The Netherlands                     1.9%
      Agency (UWV)2                                                                                                                       8%
      Motorola Solutions Systems
 5                                          Poland                              1.8%
      Polska                                                                                                                                   8%                                 11%
 6    Kamer van Koophandel                  The Netherlands                     1.8%
                                                                                                                                                       10%           11%
 7    Holland Casino3                       The Netherlands                     1.7%
 8    CBI Nederland B.V.                    The Netherlands                     1.4%
 9    Felss Group                           Germany                             1.4%                                 Public Administration             Wholesale - Retail               Financial - Insurance
                                                                                                                     Transportation - Storage          Manufacturing                    IT - Communication
 10   Coolblue B.V.                         The Netherlands                     1.4%
                                                                                                                     Professional - Scientific         Administrative                   Entertainment
                                                                               31.4%                                 Real Estate                       Construction                     Others4

                            1.   By headline rent, as at 30 September 2021
                            2.   Uitvoeringsinstituut Werknemersverzekeringen (UWV)
                            3.   Nationale Stichting tot Exploitatie van Casinospelen in the Netherlands                                                                     3Q   2021 Business Update          42
                            4.   Others comprise Utility / Education / Rural / Human Health / Mining / Other Service Activities / Residential / Water / Miscellaneous Services
.

    Cromwell’s European Presence
    17 regional offices providing on-the-ground local market knowledge and expertise

    Office Locations                                                 Credentials                                  Platform
                                                                     Track record of providing
                                                                     investment management,
                                                                     fund management, asset                                   €3.7bn
                                                                                                                                 1
                                                                     management and debt                                      AUM
                                                                     restructuring

                                                                                                                              160+
                                                                     Specialists                                              properties
                                                                     Specialists in Core+ and
                                                                     Value Add commercial real
                                                                     estate                                                   1,980+
                                                                                                                              tenants
                                                                     Partners
                                                                     Diverse client base of
                                                                                                                              220+
                                                                                                                              people
                                                                     investors including
                                                                     sovereign wealth funds,
                                                                     pension funds, insurance
                                                                     companies, private equity                                12
                                                                     and multi managers2                                      countries

                                                                     1.   Excluding investment capacity.
                                                                                                                              17
                                                                          Figures as at 30 June 2021                          offices
                                                                     2.   Includes past investors in Cromwell’s
                                                                          managed funds

                                                                                                                   3Q 2021 Business Update   43
Non-exhaustive Glossary and Definitions
All figures in this presentation are as at 30 September 2021 and stated in Euro (“EUR” or “€”), unless otherwise stated

 Abbreviations / mentions   Definitions
 3Q 2020 / 3Q 2021 / 9M     “3Q 2020” refers to the period from 1 July 2020 to 30 September 2020; “3Q 2021” refers to the period from 1 July 2021 to 30 September 2021; “9M (YTD) 2020” refers to
 (YTD) 2020 / 9M (YTD)      the period from 1 January 2020 to 30 September 2020; “9M (YTD) 2021” refers to the period from 1 January 2021 to 30 September 2021; “FY 2020” refers to the period
 2021 / FY 2020 / FY 2021   from 1 January 2020 to 31 December 2020; “FY 2021” refers to the period from 1 January 2021 to 31 December 2021
 CAPEX                      Capital expenditure

 CPI                        Consumer price index-linked

 DI                         Distributable Income available for distribution to unitholders

 DPU / cpu                  Distribution per Unit / cents per Unit

 EMTN                       Euro medium-term note
                            Estimated rental value, typically representing valuers' opinion of the open market rent which, on the date of valuation, could reasonably be expected to be obtained on a
 ERV                        new letting or rent review of a property
 GDP                        Gross domestic product

 NAV                        Net asset value

 NOI                        Net operating income

 NPI                        Net property income

 P.a.                       Per annum

 pcp                        Prior corresponding period

 P.p.                       Percentage points

 RCF                        Revolving credit facility
                            Calculated as a percentage representing a fraction with a numerator the new headline rent of all modified, renewed or new leases over the relevant period and denominator
 Rent reversion             the last passing rent of the areas being subject to modified, renewed or new leases
                            Valuers’ term; typically calculated as a percentage representing a fraction with a numerator the net market rental value per annum (net of non-recoverable running costs
 Reversionary Yield         and ground rent) expressed and denominator he net capital value.
 Sponsor                    CEREIT’s sponsor, Cromwell Property Group

 Sqm / NLA                  Square metres / Net lettable area
 Tenant-customer            Tenant-customer retention rate by ERV is the % quantum of ERV retained over a reference period with respect to Terminable Leases, defined as leases that either expire
 retention rate             or in respect of which the tenant-customer has a right to break over a relevant reference period
 YoY / QoQ                  Year-on-year / quarter-on-quarter

 WADE                       Weighted average debt expiry

                            WALE is defined as weighted average lease expiry by headline rent based on the final termination date of the agreement (assuming the leases are not terminated on any of
 WALE / WALB                the permissible break date(s), if applicable); WALB is defined as the weighted average lease break by headline rent based on the earlier of the next permissible break date
                            at the tenant-customer’s election or the expiry of the lease

                                                                                                                                                                     3Q 2021 Business Update              44
Disclaimer
This presentation provides interim business update on the operational and financial performance of Cromwell European Real Estate Investment Trust’s
(“CEREIT”) for the third quarter ended 30 September 2021.

This presentation is for information purposes only and does not constitute or form legal, financial or commercial advice, or a recommendation of any kind, part of
an offer, invitation or solicitation of any offer to purchase or subscribe for any securities of CEREIT in Singapore or any other jurisdiction nor should it or any part
of it form the basis of, or be relied upon in connection with, any contract or commitment whatsoever. Nothing herein should be or deemed to be construed, or
relied upon, as legal, financial or commercial advice or treated as a substitute for specific advice relevant to particular circumstances. It is not intended nor is it
allowed to be relied upon by any person. The value of units in CEREIT (“Units”) and the income derived from them may fall as well as rise. The Units are not
obligations of, deposits in, or guaranteed by Cromwell EREIT Management Pte. Ltd, as manager of CEREIT (the “Manager”), Perpetual (Asia) Limited (as trustee
of CEREIT) or any of their respective affiliates. The past performance of CEREIT is not necessarily indicative of the future performance of CEREIT.

This presentation may contain forward-looking statements that involve risks and uncertainties. Actual future performance, outcomes and results may differ
materially from those expressed in forward-looking statements as a result of a number of risks, uncertainties and assumptions. These forward-looking statements
speak only as at the date of this presentation. No assurance can be given that future events will occur, that projections will be achieved, or that assumptions are
correct. Representative examples of these factors include (without limitation) general industry and economic conditions, interest rate trends, cost of capital and
capital availability, competition from similar developments, shifts in expected levels of property rental income, changes in operating expenses, including
employee wages benefits and training, property expenses, governmental and public policy changes and the continued availability of financing in the amounts and
the terms necessary to support future business.

Prospective investors and unitholders of CEREIT (“Unitholders”) are cautioned not to place undue reliance on these forward-looking statements, which are based
on the current view of the Manager on future events. No warranties, representations or undertakings, express or implied, is made as to, including, inter alia, the
fairness, accuracy, completeness or correctness for any particular purpose of such content, nor as to the presentation being up-to-date. The content of this
presentation should not be construed as legal, business or financial advice. No reliance should be placed on the fairness, accuracy, completeness or correctness
of the information, or opinions contained in this presentation. None of the Manager, the trustee of CEREIT or any of their respective advisors, representatives or
agents shall have any responsibility or liability whatsoever (for negligence of otherwise) for any loss howsoever arising from any use of this presentation or its
contents or otherwise arising in connection with this presentation. The information set out herein may be subject to updating, completion, revision, verification
and amendment and such information may change materially. An investment in Units is subject to investment risks, including possible loss of the principal
amount invested.

Unitholders have no right to request that the Manager redeem or purchase their Units while the Units are listed. It is intended that Unitholders may only deal in
their Units through trading on Singapore Exchange Securities Trading Limited (the “SGX-ST”). Listing of the Units on the SGX-ST does not guarantee a liquid
market for the Units.

                                                                                                                                          3Q 2021 Business Update          45
THANK YOU
If you have any queries, kindly contact:
Cromwell EREIT Management Pte. Ltd.,
Chief Operating Officer & Head of Investor Relations, Ms Elena Arabadjieva at
elena.arabadjieva@cromwell.com.sg, Tel: +65 6920 7539,
or SEC Newgate Singapore at cereit@secnewgate.sg
You can also read