CPTU identification of regular, sensitive, and organic clays towards evaluating preconsolidation stress profiles
←
→
Page content transcription
If your browser does not render page correctly, please read the page content below
AIMS Geosciences, 7(4): 553–573.
 DOI: 10.3934/geosci.2021032
 Received: 05 August 2021
 Accepted: 15 September 2021
 Published: 13 October 2021
http://www.aimspress.com/journal/geosciences

Research article
CPTU identification of regular, sensitive, and organic clays towards
evaluating preconsolidation stress profiles
Shehab S Agaiby1,* and Paul W Mayne2

1
 Department of Public Works, Faculty of Engineering, Cairo University, Giza, Egypt
2
 Geosystems Engineering, Georgia Institute of Technology, Atlanta, GA 30332–0355 USA

* Correspondence: Email: shehabagaiby@cu.edu.eg; Tel: 201011105111.

Abstract: Soil classification by piezocone penetration tests (CPTU) is mainly accomplished using
empirical soil behavior charts (SBT). While commonly-used SBT methods work well to separate
fine-grained soils from granular coarse-grained soils, in many instances, the groupings often fail to
properly identify different categories of clays, specifically: (a) ―regular‖ clays that are inorganic and
insensitive, (b) sensitive and quick clays; and (c) organic soils. Herein, a simple means of screening
and sorting these three clay types is shown using three analytical CPTU expressions for evaluating
the preconsolidation stress profile from net cone resistance, excess porewater pressure, and effective
cone resistance. A number of case studies are utilized to convey the methodology.

Keywords: clays; cone penetration; organic soils; piezocone; sensitive soils

1. Introduction

 Cone penetration testing (CPT), particularly piezocone testing (CPTU), obtains detailed
stratigraphic profiling of soil layers by collecting three distinct measurements with depth: (a)
cone tip resistance, q t; (b) sleeve friction, f s; and (c) porewater pressure, u 2, during the
advancement of an electronic steel probe that is hydraulically pushed vertically at a constant rate
of 20 mm/s. Since soil sampling is not normally conducted during cone penetration testing,
different approaches are used for post-processing piezocone data to identify and classify soil type:
(a) relating CPT readings to the logs of adjacent boreholes and recovered samples subjected to
laboratory testing; (b) relying on rules-of-thumb; (c) using empirical soil behavioral type (SBT)
charts; (d) adopting probabilistic methods [1].
 The most common method of soil classification by CPTU employs empirical soil behavioral type

554 (SBT) charts which have been developed by various researchers such as Robertson [2], Lunne et al. [3], Eslami and Fellenius [4], Schneider et al. [5], and Jefferies & Been [6]. One of the most popular charts is comprised of 9 soil zones that relies on normalized piezocone parameters (termed SBTn), namely: (1) normalized cone resistance, Q = qnet/vo’, (2) normalized sleeve resistance, F (%) = 100∙fs/qnet, and (3) normalized porewater pressure, Bq = u2/qnet, where qnet = qt − vo, u2 = u2 − u0, vo = total overburden stress, u0 = hydrostatic porewater pressure, and vo’ = effective vertical stress [3]. An update uses a modified form of Q that is termed Qtn where the vo’ term has a power law format, as detailed by Robertson [7]. While all the charts include zones for sand, silt, and clay, the delineations by Eslami and Fellenius [4] do not include a zone specific for organic soils, while the method of Jefferies & Been [6] does include organic soils, but not a distinct region to identify sensitive soils. The SBTn charts generally work well in differentiating gravelly sands (zone 7) from clean sands (zone 6), sandy mixtures (zone 5), silts (zone 4), and clays (zone 3), as shown in Figure 1 for regular clays. However, clay soils that have a special nature, including sensitive clays (zone 1) and organic soils (zone 2), can be mis-classified as zone 3 (clays to clayey silts). For sensitive and quick clays, several studies have indicated the shortcomings of SBTn charts in correctly assigning the appropriate zone 1 (e.g., [1,8–14]). Figure 1 illustrates a summary plot for a number of sensitive fine-grained soils, as compiled and reported by Agaiby [1], falling incorrectly in zones 3 and 4 instead of zone 1. This is important because sensitive clays are unstable, prone to landsliding, and susceptible to collapse. A similar issue arises when the SBTn misplaces clays that should locate in zone 2 (organic soils) but instead classifies the soils as either zone 1 (sensitive), zone 3 (clays), or zone 4 (silts) as noted by several authors [1,15–21]. Figure 1 shows the Q-F and Q-Bq charts with representative CPTU data from 24 organic fine-grained soil sites, where only 1 or 2 of the organic clays are properly identified as zone 2 [1]. Again, the misdiagnosis can be important because organic clays are associated with high compressibility, large foundation, settlements, undrained and drained creep, and bio-degradation issues. The same issues for CPTU in sensitive and organic clays arise when plotting these groups on alternate classification charts. Figure 2a illustrates the data on the Unicone Chart [22] where there is no zone provided for organic clays and several sensitive clays are misidentified. Moreover, the CPTU classification chart by Jefferies & Been [6] has no specific zone allocated for sensitive and structured clays, while it misses correctly classifying many of the organic clays, as presented in Figure 2b. 2. Analytical CPTU solutions for clays Herein, an alternate means of identifying clay types by CPTU are grouped into three categories: (1) ―regular‖ clays that are insensitive and inorganic; (2) sensitive clays; and (3) organic soils. This is accomplished using effective preconsolidation stress (p’) profiles developed from the CPTU readings that are based on an analytical solution that evaluates overconsolidation ratio (OCR = p’/vo’) as functions of qnet, u2, and qE. For regular clays and sensitive clays, a separate closed-form limit plasticity approach evaluates the effective friction angle characteristics of the clay. AIMS Geosciences Volume 7, Issue 4, 553–573.
555 1000 1000 Ic = 1.31 **** In Pink - Sensitive Clays Very stiff Ic = 2.05 Gravelly OC sand Sands Ic = 2.60 ++++ In Green - Organic Clays Normalized Cone Tip Resistance, Qtn to clayey Gravelly Normalized Cone Tip Resistance, Qtn sand Ic = 2.95 Sands xxxx In Blue - Regular Clays (zone 7) Ic = 3.60 (zone 8) Very stiff (zone 7) OC clay Zone 1 to silt Zones 8 and9 Sands (zone 9) Sep 8 from 9 (zone 6) Series1 Sands 100 100Series7 (zone 6) Series8 Series9 Sandy Mix Series12 (zone 5) Silt M ix Series14 (zone 4) Series15 Series16 Sandy M ixtures Series17 (zone 5) Series18 Series19 10 10Series20 Series21 Series22 Series23 Clays Series24 Series25 (zone 3) Sensitive Clays Clays Series26 and Silts (zone 3) Series27 Series28 Sensitive (zone 1) Organic Soils Series29 Organic (zone 2) Series30 (zone 2) (zone 1) 1 1Series31 0.1 1 10 Series32 -0.6 -0.4 -0.2 0.0 0.2 0.4 0.6 0.8 1.0 1.2 1.4 Series33 Series34 Normalized Friction, Fr = 100 fst/(qt - vo) (%) Series35Normalized Porewater, Bq = u2/(qt-vo) Series36 Series37 Figure 1. A compilation of CPTU data from regular, sensitive, and organic clays using empirical SBTn charts: (a) Qtn-Fr; (b) Qtn-Bq (after [1]). Organics 100 Site Center of Circle +++++ In Pink - Sensitive ClaysBallina Sandy Gravel ѲѲѲѲ In Green - Organic ClaysBarra da Tijuca - CM1 Effective Cone Tip Resistance, qE (MPa) xxxxx In Blue - Regular Clays Barra da Tijuca - Gleba Doelpolder Noord 1000 Gammelgården Dimensionless Parameter: Q(1 - B q)+1 Radius Ic* = 1.25 1.80 2.40 2.76 Hjoggböle Huaiyan Sands Ipojuca KIJK, Zuid Gravelly Lianyan Expressway Kuala Lumpur 10 Sands Markermeer Mexico City Clay 100 MN - TH19 Sands to MN - TH23 MN - TH241 Sand some silt Ic* = New Orleans London Ave 3.22 Nicholette, MN Raszynka River valley Silty Sands to Sandy Silts Silty Clays Recife RRS1 Recife RRS2 1 to Clays Saint Paul, MN Sensitive 10 Clay Silt Clayey Sarapui II Sherman Island, CA Silts Stargard Clay Silt Suisun Bay, CA Sunderbyn Umeå bangård Västerslätt Organic Soils Webasca-Desmarais, AB 1 0.1 0.1 1 10 1 10 100 1000 Sleeve Friction, fs (kPa) Friction Ratio, FR = f s/(qt - vo) (%) (a) (b) Figure 2. Misidentification of sensitive and organic clays on: a) the Unicone Chart by Fellenius & Eslami [22]; and b) Jefferies & Been [6] classification chart. AIMS Geosciences Volume 7, Issue 4, 553–573.
556 2.1. SCE-CSSM solution A hybrid formulation of spherical cavity expansion (SCE) and critical state soil mechanics (CSSM) expresses the overconsolidation ratio (OCR) of clays in three separate formulations using net cone tip resistance (q net = qt − vo), excess pore pressure (u 2 = u2 − u0), and effective cone resistance (qE = qt − u2). Details of the solution for insensitive inorganic clays are given by Mayne [23], Chen & Mayne [24], and Burns & Mayne [25], whereas the application in sensitive and structured clays is provided by Agaiby & Mayne [26]; Mayne et al. [27,28]; DiBuöet al. [29]; and Mayne & Benoît [14]. Three separate algorithms relate the OCR to normalized CPTU parameters: Q = qnet/vo’ and U = u2/vo’, where qnet = qt – vo = net cone resistance and u2 = u2 − u0 = excess porewater pressure. These are expressed by the following: 1/ / 1 = 2 ∙ (1) 0.667 ∙ ln + 1.95 1/ ∗ − 1 = 2 ∙ (2) 0.667 ∙ 2 ∙ ln − 1 1/ − 1 ∙( ∗ −1) 2 = 2 ∙ (3) 1.95 ∙ 1 + 1 2 where = 1 – Cs/Cc = plastic volumetric strain potential, Cs = swelling index, Cc = virgin compression index, IR = G/su = undrained rigidity index, M = 6·sin’/(3-sin’) = frictional parameter in q-p’ space. The value of Mc1 is defined at peak strength (i.e., ’ at qmax) whereas Mc2 is the value defined at large strains which occurs at maximum obliquity (i.e., ’ when the ratio [1’/3’] max). For insensitive clays, the value of ’ at qmax is equal to ’ at (1’/3’)max, and thus Mc = Mc1 = Mc2. For insensitive clays, the value of = 0.80, whereas for sensitive clays, a value of ≈ 1.0 is more suitable. While equations (1) and (2) both depend on the IR of the clay, Equation (3) is independent of the IR and is obtained by combination of the first two formulations. The rigidity index is thus given directly from [30]: 1.5 + 2.925 ∙ 1 ∙ = (4) 2 − 1 ∙ where aq = (U – 1)/Q = (u2 – σvo)/(qt – σvo). The parameter aq can be determined as a single value for any clay layer or uniform clay deposit by taking the slope of a plot of the parameter (U-1) versus Q, or alternatively taken as the slope of (u2 – σvo) versus (qt – σvo). Using regression analyses, slightly different slope values for aq are obtained. 2.2. NTH solution for ’ from CPTU In the event that laboratory-measured values from triaxial compression tests are not available, the effective friction angle can be evaluated using an effective stress limit plasticity solution for undrained penetration developed by Senneset et al. [31] and Sandven et al. [10,11] at the AIMS Geosciences Volume 7, Issue 4, 553–573.

557 Norwegian University of Science and Technology (NTNU), formerly NTH. For soft to firm clays, it can be adopted that effective cohesion intercept c’ = 0, where an approximate expression is given by Mayne [32,33]: ′ = 29.5°⋅ 0.121 [0.256 + 0.336 ⋅ + ] (5) which is valid for the following parametric ranges: 20°≤ ’ ≤ 45° and 0.1 ≤ Bq ≤ 1.0 and OCRs < 2.5. Additional details for NC and OC insensitive clays are provided by Ouyang & Mayne [34,35], while ’ from CPTU in sensitive clays is addressed by Mayne et al. [28], DiBuo et al. [29], and Mayne & Benoît [14]. 2.3. Simplified approach for insensitive and inorganic clays A series of simplifications can be made for insensitive inorganic clays, or ―regular‖ and ―normal‖ clays. For one, equation (2) can be approximated by: 1/ ≈ 2 ∙ (6) 0.667 ∙ 2 ∙ ln As noted previously for regular clays which are inorganic and insensitive, the values Mc = Mc1 = Mc2, therefore equation (3) reduces to: 1/Λ 1 − 2 = 2 ∙ (7) 1.95 + 1 ’ For a first-order estimate of p’ in regular clays, further simplifications are achieved by: (a) setting the exponent = 1 to reduce the power law format to linear equations; (b) adopting a characteristic effective friction angle of clay ’ = 30°(Mc = 1.2), and (c) using a default value of IR = 100 [33,36]. The reduced expressions become simple linear trends: p’ ≈ 0.33 qnet = 0.33 (qt − vo) (8) p’ ≈ 0.53 u2 = 0.53 (u2 − uo) (9) p’ ≈ 0.60 qE = 0.60 (qt − u2) (10) Table 1 lists several selected examples of regular or normal clays that have been subjected to both field CPTU and drilling with soil sampling operations. Laboratory testing was performed on recovered samples using standard classification methods and one-dimensional consolidation. Illustrative examples of CPTU soundings in four regular clays are presented in Figure 3 showing their three readings with depth: qt, fs, and u2. Applying equations (8), (9), and (10) to the piezocone soundings, Figure 4 shows the good comparison matching of OCR = p/vo’ profiles from the CPTU with reference values from laboratory consolidometer testing on undisturbed samples. For the presented cases listed in Table 1, all three OCR expressions from the CPTU agree with each other and are verified with lab benchmark values obtained from consolidation testing, thereby indicating the signature of regular clays. AIMS Geosciences Volume 7, Issue 4, 553–573.
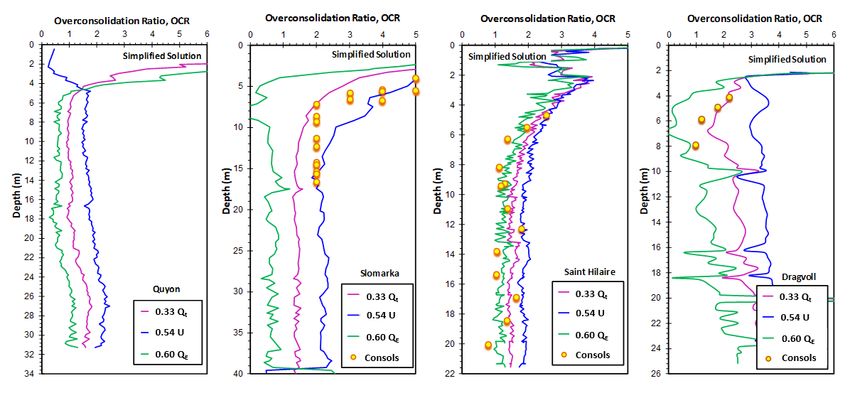
558 Table 1. Select CPTU database of ―Regular‖ clays that are inorganic and insensitive. Clay Site Location OCR Reference Measurement Reference(s) Method*** Onsøy soft clay, Historic NTS* Norway IL [37,38,39] Busan soft clay* South Korea IL [40,41] Ballina soft clay NTS* Australia CRS [42,43,44] Bothkennar soft clay NTS* United Kingdom CRS, IL, RF [45] Chicago soft clay, NTS* NWU**, Illinois, USA IL [21] San Francisco, soft Bay Mud California, USA CRS [20] Lower Troll East soft clay North Sea IL [46] Port of Brisbane, soft clay Australia IL [46] Notes: * NTS = national test site and presented in current study; ** NWU = Northwestern University; *** IL = Incremental load oedometer tests; RF = Restricted flow consolidation tests; CRS = Constant Rate of Strain consolidation tests. 3. Piezocone screening of sensitive clays A selected group of 8 sensitive clays that have been field tested by CPTU has been compiled and listed in Table 2. The sources of data and information are given here, along with the calibrated values of 1’ and 2’ using the modified SCE-CSSM formulations. Figures 5 and 6 present the CPTU soundings for these sensitive clays. Initially, the set of simplified expressions for OCR from CPTU are applied to these eight clays, with the results shown in Figures 7 and 8. The stress history estimates using equations (8), (9), and (10) clearly show mismatching of the OCR profiles amongst each other and evident disagreement when compared to lab reference values from consolidation tests. Moreover, a consistent hierarchy can be observed which gives the signature identification of sensitive clays: 0.60 qE < 0.33 qnet < 0.53 u2 (11) Additional screening of sensitive clays verifies this approach and hierarchy of the qnet, u2, and qE equations, as documented for the following: Gloucester NTS, Ontario [26], Haney sensitive clay, BC [27], sensitive Tiller-Flotten clay, Norway [28], and sensitive Presumpscot clay in NH [14]. AIMS Geosciences Volume 7, Issue 4, 553–573.
559

 Figure 3. Piezocone soundings for ―regular‖ clays that are insensitive and inorganic: a)
 Onsøy, Norway; b) Busan, Korea; c) Ballina, Australia; and d) Bothkennar, UK.

 Figure 4. Simplified OCR expressions for regular clays from CPTU along with lab
 reference values from consolidation tests for: a) Onsøy; b) Busan; c) Ballina; and d)
 Bothkennar.

AIMS Geosciences Volume 7, Issue 4, 553–573.

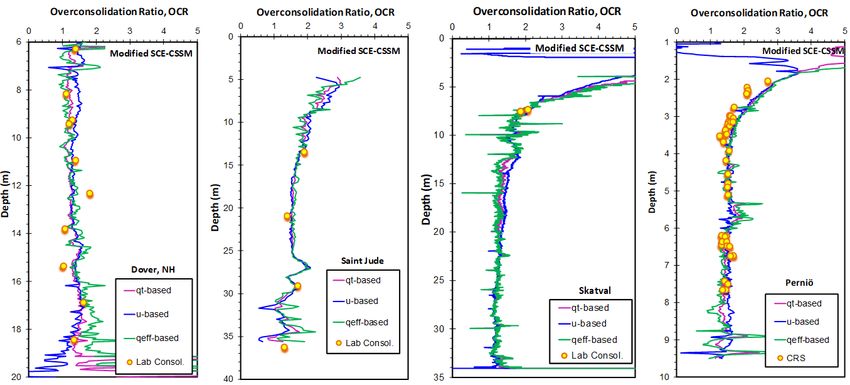
560 Table 2. Select CPTU database of sensitive clays used for case study applications. Clay Site Location OCR 1’ at peak 2’ at maximum Undrained Reference(s) Method strength obliquity Rigidity Index, IR Dover, NH* USA IL 28.7 36.7 260 0.9 [14,47] Saint Jude, QC* Canada IL 29.0 30.0 200 0.95 [48,49,50] Skatval* Norway CRS 23.0 31.0 123 1.0 [51] Perniö* Finland CRS 30.0 33.4 140 1.0 [29,52,53] Quyon, QC* Canada NA 26.0 34.0 151 0.95 [54,55] Slomarka* Norway IL 22.0 34.0 100 0.95 [51] St. Hilaire, QC* Canada IL 28.0 32.0 200 0.95 [56,57] Dragvoll* Norway IL, CRS 31.0 38.0 279 1.0 [10,11,58,59] Tiller-Flotten Norway CRS 26.0 36.0 132 0.95 [28] Haney, BC Canada IL 22.5 32.3 181 0.95 [27] Skatval Norway CRS 23.0 31.0 124 1.0 [51] Koa Norway CRS 28.0 41.0 67 1.0 [51] Lempaala Finland CRS NA NA 88 1.0 [29] Masku Finland CRS 30.0 36.9 124 1.0 [29] Paimio Finland CRS 27.5 33.7 138 1.0 [29] Sipoo Finland CRS 25.4 33.7 332 1.0 [29] Note: * = Presented in current study; NA = not available; IL = Incremental load oedometer tests; CRS = Constant Rate of Strain test. Figure 5. Piezocone soundings for sensitive and structured clays: a) Dover, NH; b) Saint Jude, QC; c) Skatval, Norway; and d) Perniö, Finland. AIMS Geosciences Volume 7, Issue 4, 553–573.

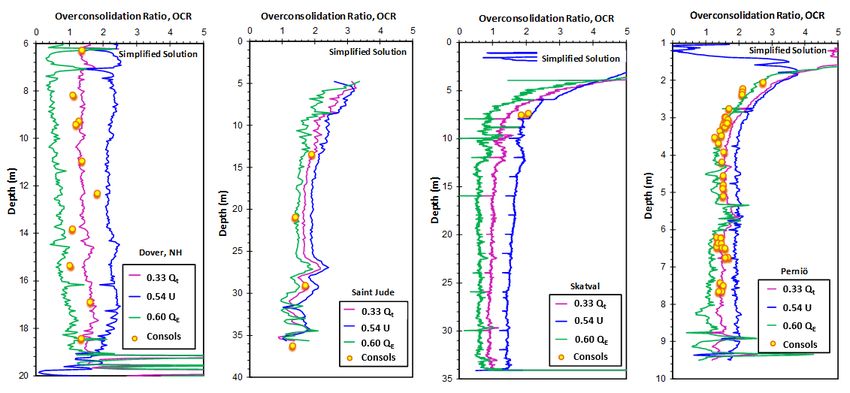
561

 Figure 6. Piezocone soundings for sensitive and structured clays: a) Quyon, QC; b)
 Slomarka, Norway; c) Saint Hilaire, QC; and d) Dragvoll, Norway.

 Figure 7. Simplified OCR expressions for CPTU in sensitive clays along with lab reference
 values from consolidation tests for: a) Dover; b) Saint Jude; c) Skatval; and d) Perniö.

AIMS Geosciences Volume 7, Issue 4, 553–573.
562 Figure 8. Simplified OCR expressions for CPTU in sensitive clays along with lab reference values from consolidation tests for: a) Quyon; b) Slomarka; c) Saint Hilaire; and d) Dragvoll clays. To assess the OCR from CPTU in sensitive clays, equations (1), (2), and (3) are utilized with corresponding Mc1 and Mc2 that can be obtained from the original NTH expression [34] and modified NTH expression [35], respectively. Results from laboratory triaxial compression tests also confirm and validate these values. Appropriate values of 1’, 2’, and for the 8 sensitive clays are listed in Table 2 and applied to the CPTU results for OCR profiles in Figures 9 and 10. The agreement with the three CPTU equations is good as well as reasonable and comparable to the reference OCR profiles obtained from one-dimensional consolidation tests. Figure 9. Modified SCE-CSSM solution for OCR in sensitive clays along with lab reference values from consolidation tests for: a) Dover; b) Saint Jude; c) Skatval; and d) Perniö. AIMS Geosciences Volume 7, Issue 4, 553–573.
563 Figure 10. Modified SCE-CSSM solution for OCR in sensitive clays along with lab reference values from consolidation tests for: a) Quyon; b) Slomarka; c) Saint Hilaire; and d) Dragvoll clays. 4. Piezocone screening in organic clays Organic soils are often associated with high compressibility and low shear strength. Moreover, organic clays commonly exhibit problems in construction, foundation performance, and stability of embankments, excavations, and slopes [60]. Therefore, it is very important to be able to identify these geomaterials when CPTU soundings encounter soft organic clays, organic silts, peats, muskeg, gyttja, and sulfide clays [61,62]. A review of CPTU data on a variety of different organic clays and soils show that when the three expressions from equations (8), (9), and (10) are used, a set of unmatched OCR profiles occur in the following hierarchal order [20]: 0.53 u2 < 0.33 qnet < 0.60 qE (12) Therefore, equation (12) serves as the CPTU signature that is characteristic of organic fine-grained soils. To illustrate this, eight well-documented organic clay and peaty sites are summarized in Table 3. Full piezocone soundings for these sites are presented in Figures 11 and 12. AIMS Geosciences Volume 7, Issue 4, 553–573.
564

 Table 3. Select CPTU database of organic clays used for case study applications.
Clay Site Location OCR Method Reference(s)
SarapuíII soft organic clay* Brazil IL [20,63]
Gammelgarden soft organic clay* Sweden IL, CRS [20,64]
Nichollet soft peat* MN, USA IL [65,66]
Belfast organic silty ―sleech‖* Ireland IL [67,68]
Roback soft organic clay* Sweden IL [69]
Suisun Bay soft organic clay* CA, USA IL [70]
Bolling AFB soft organic clay* Washington, DC, USA IL [20,71]
Lampen soft organic clay* Sweden CRS [72,73]
Soft peat, Toronto Portlands ON, Canada na [21]
Soft peat, Sherman Island CA, USA CRS, IL [21]
Soft peat, Green Lake MN, USA IL [21]
Soft peat, St. Paul MN, USA IL [20]

Notes: * = Presented in current study; IL = Incremental load oedometer tests; CRS = Constant Rate of Strain
consolidation tests; na = not available.

 Figure 11. Piezocone soundings for organic soils located at: a) SarapuíII, Brazil; b)
 Gammelgarden, Sweden; c) Nichollet, Minnesota; and d) Belfast, Ireland.

AIMS Geosciences Volume 7, Issue 4, 553–573.
565

 Figure 12. Piezocone soundings for organic soils at: a) Roback, Sweden; b) Suisun Bay,
 California; c) Bolling AFB, Washington, DC; and d) Lampen, Sweden.

 When the CPTU screening approach is applied to the investigated organic soil deposits as
presented in Figures 13 and 14, the three profiles from the expressions do not agree, thus serving as a
warning sign and identification of organic geomaterials. These profiles show clear disagreement
when compared to lab reference values from consolidation tests. Note that the hierarchical behavior
aforementioned by Equation (12) is evident.

 Figure 13. Simplified OCR expressions for CPTU in organic soils along with lab
 reference values from consolidation tests at: a) Sarapuí II; b) Gammelgarden; c)
 Nichollet; and d) Belfast clays.

AIMS Geosciences Volume 7, Issue 4, 553–573.
566 Figure 14. Simplified OCR expressions for CPTU in organic clays along with lab reference values from consolidation tests for: a) Roback; b) Suisun Bay; c) Bolling AFB; and d) Lampen clays. 4.1. Preconsolidation stress of organic clays from CPTU For evaluating the preconsolidation stress of soft organic soils by CPTU, it has been recommended to lower the coefficients of equations (8), (9), and (10). This could be justified because organic clays and peats exhibit rather high friction angles (’ > 40°) when compared to regular clays [60,61]. By use of a higher friction angle (e.g., M c > 1.2) in equations (1), (2), (3), and (7), the resulting set of simplified equations (8), (9), and (10) would consequently have smaller coefficients for qnet,u2, and qE. For instance, for the soft organic clays of Brazil, modified expressions have been developed [16,74]: p’ = 0.125 qnet (13) p’ = 0.154 qE (14) In another approach, for CPTU in a variety of soil types, a generalized solution retains the 0.33 coefficient of equation (8) and employs a power law algorithm in the form [75,76]: p’ = 0.33 qnetm’ (units of kPa) (15a) where the exponent m’ depends upon the soil behavioral type ( = 1.0 intact inorganic clays; 0.90 organic clays; 0.85 silt mixtures; 0.80 silty sands; and 0.72 clean quartz-silica sands). Figure 15 shows the preconsolidation stresses p’ for various soil types plotted versus the net cone resistance. The corresponding expression in dimensionless terms is given by: p’ = 0.33 qnetm’ (atm/100)1-m’ (15b) AIMS Geosciences Volume 7, Issue 4, 553–573.
567 m' = 1.1 1.0 0.9 10000 Fissured Clays 0.85 Preconsolidation Stress, p' (kPa) General Trend: 0.80 p' (kPa)= 0.33(qt-vo) m' Fissured Clays: m' = 1.1 Silts Intact Clays: m' = 1.0 0.72 1000 Organic Clays: m' = 0.9 Sensitive: m' = 0.9 0.70 Silts: m' = 0.85 Silty Sands: m' = 0.80 Clean Sands: m' = 0.72 100 10 10 100 1000 10000 100000 Net Cone Tip Resistance, qt - vo (kPa) Figure Amherst Anchorage for preconsolidation 15. General relationship Ariake stressBallina of soils and CPT net cone INTACT resistance in different geomaterials (adapted after Agaiby and Mayne [76]). where atm = reference pressure equal to 1 atmosphere ≈ 1 bar = 100 kPa. By adopting equation (15) with exponent m’ = 0.90, the estimated preconsolidation profiles match well with the stress history results from one-dimensional consolidation tests for the 8 case studies involving soft organic clays and peats, as shown in Figures 16 and 17. Figure 16. CPTU profiles for preconsolidation stress in organic soils along with lab reference values from consolidation tests for: a) Sarapuí II; b) Gammelgarden; c) Nichollet; and d) Belfast. AIMS Geosciences Volume 7, Issue 4, 553–573.
568 Figure 17. CPTU profiles for preconsolidation stress in organic soils along with lab reference values from consolidation tests for: a) Roback; b) Suisun Bay; c) Bolling AFB; and d) Lampen. 5. Conclusions The identification of regular clays that are insensitive and inorganic from organic clays and sensitive or quick clays using CPTU is normally handled via empirical soil behavioral classification charts that sometimes miss the mark. As an alternate screening method for separating these three clay categories, a preconsolidation stress approach can be utilized which is based in a hybrid formulation of spherical cavity expansion theory and critical state soil mechanics (SCE-CSSM). For CPTU soundings in ―regular‖ or ―normal‖ soft to firm clays that are inorganic and insensitive, a first order estimate of preconsolidation stresses is found from: p’ ≈ 0.53 u2 ≈ 0.33 qnet ≈ 0.60 qE. When applying this approach to sensitive, quick, and structured clays, a hierarchal sorting shows: 0.60 qE < 0.33 qnet < 0.53 u2. where the three corresponding profiles of p’ and OCR do not agree. Once identified properly, a modified SCE-CSSM solution is used to obtain the undrained rigidity index (IR) based on the normalized cone tip resistance (Q = qnet/vo’) and porewater pressure readings (U = u2/vo’). The modified solution utilizes the effective stress friction angle (’) defined at: (i) peak stress (qmax’) and (ii) maximum obliquity (MO’). These can be obtained from the NTH limit plasticity solution. The derived expressions provide three formulations for clay stress history that relate the OCR to CPTU in terms of net resistance (qt − vo), excess porewater pressures (u2 − u0), and effective cone resistance (qt − u2), all of which agree well with the benchmark laboratory consolidation testing and corresponding profiles of preconsolidation stress at the site. In contrast, when the simplified SCE-CSSM approach is applied to organic soils, a reversed hierarchal sorting shows: 0.53 u2 < 0.33 qnet < 0.60 qE. Once properly recognized, the preconsolidation stress of organic clays can be evaluated from a power law expression with net cone resistance. AIMS Geosciences Volume 7, Issue 4, 553–573.
569 Several case study examples from regular clays, sensitive clays, and organic soils that have been tested both in the laboratory (e.g., index parameters, plasticity, sensitivity, organic content, consolidation, triaxial) and by field CPTU soundings are presented in the paper to show the validity of the hierarchal approach. Acknowledgments The authors appreciate the assistance of ConeTec Group of Richmond, BC in supporting research on in-situ testing at the Georgia Institute of Technology. Conflict of interest The authors declare no conflict of interest. References 1. Agaiby S (2018) Advancements in the interpretation of seismic piezocone tests in clays and other geomaterials. School of Civil & Environmental Engineering, Georgia Institute of Technology, Atlanta, GA USA, 925. 2. Robertson PK (1990) Soil classification using the cone penetration test. Can Geotech J 27: 151–158. 3. Lunne T, Robertson PK, Powell JJM (1997) Cone Penetration Testing in Geotechnical Practice, EF Spon/CRC Press, London, 352 . 4. Eslami A, Fellenius BH (1997) Pile capacity by direct CPT and CPTU methods applied to 102 case histories. Can Geotech J 34: 886–904. 5. Schneider JA, Hotstream JN, Mayne PW, et al. (2012) Comparing CPTU Q-F and Q-u2/vo’ soil classification charts. Geotechnique Lett 2: 209–215. 6. Jefferies M, Been K (2015) Soil Liquefaction: A Critical State Approach, Second Edition, Taylor & Francis Group, London, 712. 7. Robertson PK (2009) Interpretation of cone penetration tests—a unified approach. Can Geotech J 46: 1337–1345. 8. Shahri AA, Malehmir A, Juhlin C (2015) Soil classification based on piezocone data. Eng Geo 189: 32–47. 9. Valsson SM (2016) Detecting quick clay with CPTU. 17th Nord Geotech Meet. 10. Sandven R, Gylland A, Montafia A, et al. (2016) In-situ detection of sensitive clays—Part I: selected test methods. 17th Nord Geotech Meet, Reykjavik. 11. Sandven R, Gylland A, Montafia A, et al. (2016) In-situ detection of sensitive clays—Part II: Results. 17th Nord Geotech Meet. Reykjavik, Iceland: Icelandic Geotechnical Society. 12. Gylland AS, Sandven R, Montafia A, et al. (2017) CPTU classification diagrams for identification of sensitive clays. Landslides in Sensitive Clays, Springer Series on Advances in Natural & Technological Hazards Research, Cham, Switzerland, 57–66. 13. DeGroot DJ, Landon ME, Poirier SE (2019) Geology and engineering properties of sensitive Boston Blue Clay at Newbury, Massachusetts. AIMS Geosci 5: 412–447. AIMS Geosciences Volume 7, Issue 4, 553–573.
570

14. Mayne PW, Benoît J (2020) Analytical CPTU Models Applied to Sensitive Clay at Dover, New
 Hampshire. J Geotech Geoenviron Eng 146: 04020130.
15. Long M (2008) Design parameters from in-situ tests in soft ground. Geotechnical and
 Geophysical Site Characterization, Taylor & Francis, London, 90–116.
16. Coutinho RQ, Bello MI (2014) Geotechnical characterization of Suape soft clays, Brazil. Soils
 Rocks 37: 257–276.
17. Mlynarek Z, Wierzbicki J, Gogolik S, et al. (2014) Shear strength and deformation parameters
 of peat and gyttja from CPTu, SDMT, and VST tests, 5th Intl Workshop CPTu DMT Soft Clays
 Organic Soils, 193–209.
18. Nejaim PF, Jannuzzi GMF, Danziger FAB (2016) Soil behavior type of the SarapuíII test site.
 Geotechnical & Geophysical Site Characterization 5, Gold Coast, Australian Geomechanics
 Society, 1009–1014. Available from: www.usucger.org.
19. Zawrzykraj P, Rydelek P, Bąkowska A (2017) Geoengineering properties of Eemian peats from
 central Poland in the light of static cone penetration and dilatometer tests. Eng Geol 226:
 290–300.
20. Mayne PW, Agaiby S (2019) Profiling yield tresses and identification of soft organic clays
 using piezocone tests, Proceedings XVI Pan American Conference on Soil Mechanics &
 Geotechnical Engineering, Paper 0149, Cancun, Mexican Society of Geotechnical Engineering
 (SMIG). Available from: www.issmge.org.
21. Mayne PW, Agaiby SS, Dasenbrock D (2020) Piezocone identification of organic clays and
 peats, GeoCongress 2020: Modeling, Geomaterials, and Site Characterization, (Minneapolis,
 GSP 317), ASCE, Reston, VA, 541–549.
22. Fellenius BH, Eslami A (2000) Soil profile interpreted from CPTU data. Geotech Eng Conf
 Year 2000 Geotech, 18.
23. Mayne PW (1991) Determination of OCR in clays by piezocone tests using cavity expansion
 and critical state concepts. Soils Found 31: 65–76.
24. Chen BY, Mayne PW (1994) Profiling the Overconsolidation Ratio of Clays by Piezocone Tests,
 Report No. GIT-CEE/GEO-94-1 submitted to National Science Foundation by Georgia Institute
 of Technology, Atlanta, 280.
25. Burns SE, Mayne PW (1998) Monotonic and dilatory porewater pressures during piezocone
 dissipation tests in clay. Can Geotech J 35: 1063–1073.
26. Agaiby SS, Mayne PW (2018) Interpretation of piezocone penetration and dissipation tests in
 sensitive Leda Clay at Gloucester Test Site. Can Geotech J 55: 1781–1794.
27. Mayne PW, Greig J, Agaiby S (2018) Evaluating CPTu in sensitive Haney clay using a
 modified SCE-CSSM solution. 71st Can Geotech Conf GeoEdmonton, Paper ID No. 279,
 Canadian Geotechnical Society. Available from: www.cgs.ca.
28. Mayne PW, Paniagua P, L’heureux JS, et al. (2019) Analytical CPTu model for sensitive clay at
 Tiller-Flotten site, Norway, XVII ECSMGE: Geotechnical Engineering Foundation of the
 Future, Paper 0153, Reykjavik, Icelandic Geotechnical Society. Available from:
 www.issmge.org.
29. Di BuòB, D’Ignazio M, SelãnpaãJ, et al. (2019) Yield stress evaluation of Finnish clays based
 on analytical CPTU models. Can Geotech J 57: 1623–1638.
30. Agaiby SS, Mayne PW (2018) Evaluating undrained rigidity index of clays from piezocone data.
 Cone Penetration Testing (Delft), CRC Press/Balkema, 65–72.

AIMS Geosciences Volume 7, Issue 4, 553–573.
571

31. Senneset K, Sandven R, Janbu N (1989) Evaluation of soil parameters from piezocone tests.
 Transp Res Rec, 24–37.
32. Mayne PW (2007) In-situ test calibrations for evaluating soil parameters, Characterization &
 Engineering Properties of Natural Soils, Taylor & Francis, London, 1602–1652.
33. Mayne PW (2007) NCHRP Synthesis 368: Cone Penetration Testing. Transportation Research
 Board, National Academies Press, Washington, DC, 118. Available from: www.trb.org.
34. Ouyang Z, Mayne PW (2018) Effective friction angle of clays and silts from piezocone. Can
 Geotech J 55: 1230–1247.
35. Ouyang Z, Mayne PW (2019) Modified NTH method for assessing effective friction angle of
 normally consolidated and overconsolidated clays from piezocone tests. ASCE J Geotech
 Geoenviron Eng 145.
36. Houlsby GT, The CI (1988) Analysis of the piezocone in clay. Penetration Testing 1988,
 Balkema, Rotterdam, 777–783.
37. Lunne T, Long M, Forsberg CF (2003) Characterization and engineering properties of Onsøy
 clay. Charact Eng Prop Nat Soils, 395–427.
38. Lunne T, Randolph M, Sjursen MA, et al. (2006) Shear strength parameters determined by in-situ
 tests for deep water soft soils. NGI-COFS Report 20041618-1. Joint Industry Project by the
 Norwegian Geotechnical Institute, Oslo and Centre for Offshore Foundation Systems, Perth: 558.
 Available from: Norwegian Geotechnical Institute by request.
39. Gundersen A, Hansen R, Lunne T, et al. (2019) Characterization and engineering properties of
 the NGTS Onsøy soft clay site. AIMS Geosci 5: 665–703.
40. Chung SG, Ryu CK, Min SC, et al. (2012) Geotechnical characterization of Busan clay. KSCE J
 Civ Eng 16: 341–350.
41. Chung SG, Kweon HJ (2013) Oil-operated fixed-piston sampler and its applicability. J Geotech
 Geoenviron Eng 139: 134–142.
42. Pineda JA, McConnell A, Kelly RB (2014) Performance of an innovative direct push piston
 sampler in soft clay. Proc 3rd Symp Cone Penetration Test, 279–288
43. Pineda JA, Suwal LP, Kelly RB, et al. (2016) Characterization of Ballina clay. Géotechnique 66:
 556–577.
44. Pineda JA, Kelly RB, Suwal L, et al. (2019) The Ballina soft soil field testing facility. AIMS
 Geosci 5: 509–534.
45. Hight DW, Paul MA, Barras BF, et al. (2003) The characterization of the Bothkennar clay.
 Characterization and Engineering Properties of Natural Soils, Swets & Zeitlinger, Lisse,
 543–597.
46. Mayne PW (2008) Piezocone profiling of clays for maritime site investigations. Geotechnics in
 Maritime Engineering, Polish Committee on Geotechnics, 333–350.
47. Getchell A, Santamaria A, Benoît J (2014) Geotechnical Test Embankment on soft marine clay
 in Newington—Dover, MS Thesis, Civil Engineering Dept, Univ of New Hampshire. Durham,
 NH: 103. Available from: https://scholars.unh.edu/thesis/825.
48. Locat A (2012) Rupture progressive et étalements dans les argiles sensible. PhD Dissertation,
 UniversitéLaval, Quebec, 216.
49. Locat A, Locat P, Demers D, et al. (2017) The Saint-Jude landslide of 10 May 2010, Quebec,
 Canada: Investigation and characterization of the landslide and its failure mechanism. Can
 Geotech J 54: 1357–1374.

AIMS Geosciences Volume 7, Issue 4, 553–573.
572

50. Locat A, Locat P, Michaud H, et al. (2019) Geotechnical characterization of the Saint-Jude clay,
 Quebec, Canada. AIMS Geosci 5: 273–302.
51. Paniagua P, L’Heureux JS, Carroll R, et al. (2017) Evaluation of sample disturbance of three
 Norwegian clays. 19th ICSMGE Secr Seoul. Available from: www.issmge.org.
52. Lehtonen V (2015) Modelling undrained shear strength and pore pressure based on an effective
 stress soil model in Limit Equilibrium Method, Tampereen teknillinen yliopisto.
 Julkaisu-Tampere University of Technology. Publication, 213.
53. Di Buò B, D’Ignazio M, Selãnpaã J, et al. (2016) Preliminary results from a study aiming to
 improve ground investigation data. 17th Nord Geotech Meet 1: 25–28.
54. Wang B, Brooks GR, Hunter JAM (2015) Geotechnical data from a large landslide site at
 Quyon, Report 7904, Quebec Geological Survey of Canada, 54.
55. Wang B, Brooks GR, Hunter JAM (2015) Geotechnical investigations of a large landslide site at
 Quyon, Québec. 68th Can Geotech Conf.
56. Lafleur J, Silvestri V, Asselin R, et al. (1988) Behavior of a test excavation in soft Champlain
 Sea clay. Can Geotech J 25: 705–715.
57. Chiasson P, Lafleur J, Soulié M, et al. (1995) Characterizing spatial variability of a clay by
 geostatistics. Can Geotech J 32: 1–10.
58. Sandven R, Montafia A, Gylland A, et al. (2015) Detection of brittle materials. Summary report
 with recommendations. Final report. NIFS Report no. 126/2015, 150.
59. Helle TE, Long M, Nordal S (2018) Interpreting improved geotechnical properties from
 RCPTUs in KCl-treated quick clays, Cone Penetration Testing 2018, CRC Press, Taylor &
 Francis Group, London, 339–345.
60. Edil TB, Wang X (2000) Shear strength and K0 of peats and organic soils. Geotechnics of High
 Water Content Materials, American Society for Testing & Materials, West Conshohocken, PA,
 209–225.
61. Den Haan EJ, Kruse GAM (2007) Characterization and engineering properties of Dutch peats,
 Characterization & Engineering Properties of Natural Soils, Taylor & Francis Group, London,
 2101–2133.
62. Mesri G, Ajlouni M (2007) Engineering properties of fibrous peats. J Geotech Geoenviron Eng
 133: 850–966.
63. Jannuzzi GMF, Danziger FAB, Martins ISM (2015) Geological-geotechnical characterization of
 SarapuíII clay. Eng Geol 190: 77–86.
64. Larsson R, Westerberg B, Albing D, et al. (2007) Sulfidjord: geoteknisk klassificering och
 odraneråd skjuvhållfastthet. SGI Report 69, Swedish Geotechnical Institute, Linköping, 138.
65. Lamb RA, Chow LC, Bentler JG (2018) US Highway 14 embankment over soft soils—success
 with ground improvement and modern instrumentation. 66th Annu Geotech Eng Conf, 117–126.
66. Chow LC, Bentler JG, Lamb RA (2019) Primary and post-surcharge secondary settlements of a
 highway embankment constructed over highly organic soils: a case history. Geo Congr 2019
 Embankments Dams Slopes, 109–118.
67. McCabe BA (2002) Experimental investigations of driven pile group behaviour in Belfast soft
 clay, Doctoral dissertation, Trinity College Dublin, 415.
68. Lehane BM (2003) Vertically loaded shallow foundation on soft clayey silt. Proc Inst Civil Eng
 Geotech Eng 156: 17–26.

AIMS Geosciences Volume 7, Issue 4, 553–573.
573

69. Westerberg B, Andersson M (2017) Sulfidjord—kompressionsegenskaper och sättningar. En
 studie av provbankar i Lampen och andra bankar. SGI Publikation 41, Swedish Geotechnical
 Institute, Linköping, 238.
70. Merani JM, Hunt CE, Donahue JL, et al. (2016) CPT interpretation in highly organic soils and
 soft clay soils. Geo Chicago 2016, 412–421.
71. Mayne PW (1987) Determining preconsolidation stress and penetration pore pressures from
 DMT contact pressures. Geotech Test J 10: 146–150.
72. Andersson M (2012) Kompressionsegenskaper hos sulfidjordar: En fält-och laboratoriestudie
 av provbankar, Luleåtekniska universitet, Sweden, 336.
73. Westerberg B, Andersson M, Winter MG, et al. (2015) Compression properties of an organic
 clay. XVI European Conf. Soil Mechanics & Geot. Engrg, Edinburgh, UK, 3091–3096.
74. Baroni M, Almeida MSS (2017) Compressibility and stress history of very soft organic clays.
 Proce Inst Civ Eng 170: 148–160.
75. Mayne PW (2017) Stress history of soils from cone penetration tests. Soils Rocks 40: 203–218.
76. Agaiby SS, Mayne PW (2019) CPT evaluation of yield stress profiles in soils. J Geotech
 Geoenviron Eng 145: 04019104.

 © 2021 the Author(s), licensee AIMS Press. This is an open access
 article distributed under the terms of the Creative Commons
 Attribution License (http://creativecommons.org/licenses/by/4.0)

AIMS Geosciences Volume 7, Issue 4, 553–573.
You can also read