Covid-19 Social Study - Results Release 28
←
→
Page content transcription
If your browser does not render page correctly, please read the page content below

Covid-19 Social Study
Results Release 28

Dr Daisy Fancourt, Dr Feifei Bu, Dr Hei Wan Mak, Prof Andrew Steptoe
Department of Behavioural Science & Health

13th January 2021

                                                               1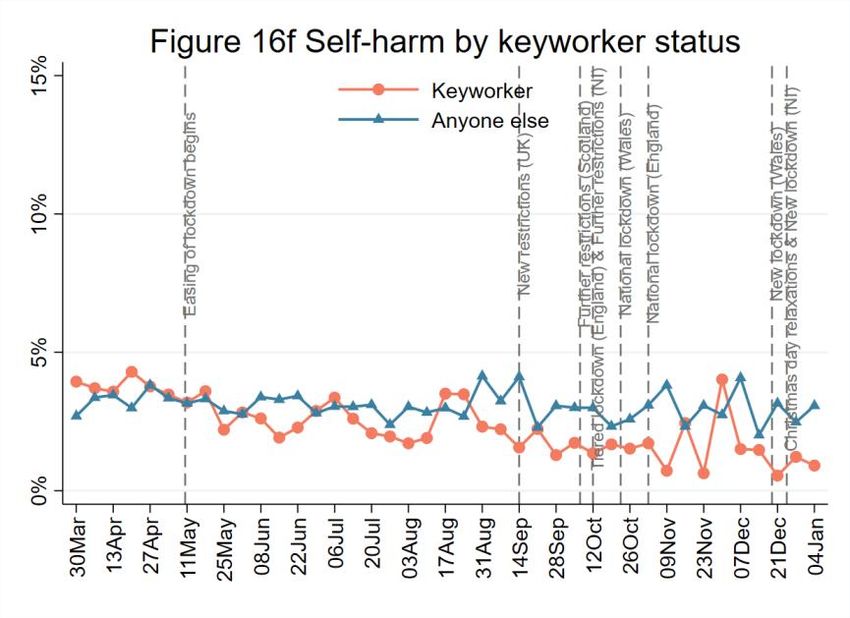
Table of Contents
Executive summary ................................................................................................................................................. 3
    Background ........................................................................................................................................................ 3
    Findings .............................................................................................................................................................. 3
1. Compliance and confidence ............................................................................................................................... 5
    1.1 Compliance with guidelines ......................................................................................................................... 5
    1.2 Confidence in Government ........................................................................................................................ 13
2. Mental Health ................................................................................................................................................... 17
    2.1 Depression and anxiety .............................................................................................................................. 17
    2.2 Stress .......................................................................................................................................................... 24
3. Self-harm and abuse ......................................................................................................................................... 37
    3.1 Thoughts of death or self-harm ................................................................................................................. 37
    3.2 Self-harm.................................................................................................................................................... 41
    3.3 Abuse ......................................................................................................................................................... 45
4. General well-being ............................................................................................................................................ 49
    4.1 Life satisfaction .......................................................................................................................................... 49
    4.2 Loneliness .................................................................................................................................................. 53
    4.3 Happiness ................................................................................................................................................... 57
5. Compliance with guidelines .............................................................................................................................. 61
    5.1 Compliance by the tiered system (England) .............................................................................................. 61
    5.2 COVID-19 rules compliance ....................................................................................................................... 64
    5.3 Test request if developed symptoms of COVID-19 .................................................................................... 69
    5.4 Self-isolation .............................................................................................................................................. 71
Appendix ............................................................................................................................................................... 74
    Methods ........................................................................................................................................................... 74
    Demographics of respondents included in this report .................................................................................... 74

The Nuffield Foundation is an independent charitable trust with a mission to advance social well-being. It funds
research that informs social policy, primarily in Education, Welfare, and Justice. It also funds student programmes
that provide opportunities for young people to develop skills in quantitative and scientific methods. The Nuffield
Foundation is the founder and co-funder of the Nuffield Council on Bioethics and the Ada Lovelace Institute. The
Foundation has funded this project, but the views expressed are those of the authors and not necessarily the
Foundation. Visit www.nuffieldfoundation.org.
The project has also benefitted from funding from UK Research and Innovation and the Wellcome Trust. The
researchers are grateful for the support of a number of organisations with their recruitment efforts including:
the UKRI Mental Health Networks, Find Out Now, UCL BioResource, HealthWise Wales, SEO Works, FieldworkHub,
and Optimal Workshop.

                                                                                     2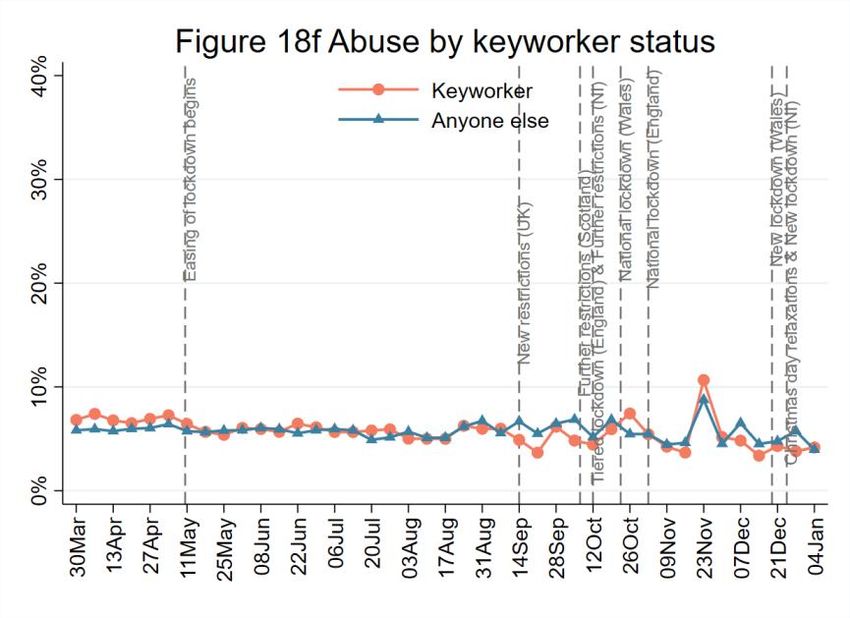
Executive summary
Background
This report provides data from the last 38 weeks of the UK COVID-19 Social Study run by University College London: a panel
study of over 70,000 respondents focusing on the psychological and social experiences of adults living in the UK during the
Covid-19 pandemic.
In this TWENTY-EIGHTH report, we focus on psychological responses to the first forty-two weeks since just before the UK
lockdown was first announced (21/03 to 10/01). We present simple descriptive results on the experiences of adults in the
UK. Measures include:
1. Reported compliance with government guidelines and confidence in the government
2. Mental health including depression, anxiety and stress
3. Harm including thoughts of death or self-harm, self-harm and both psychological & physical abuse
4. Psychological and social wellbeing including life satisfaction, loneliness and happiness
5. ***New in this report*** Compliance by the tiered systems, COVID-19 rules compliance, COVID-19 test request, and
self-isolation
This study is not representative of the UK population but instead was designed to have good stratification
across a wide range of socio-demographic factors enabling meaningful subgroup analyses to understand the
experience of Covid-19 for different groups within society. Data are weighted using auxiliary weights to the
national census and Office for National Statistics (ONS) data. Full methods and demographics for the sample
included in this report are reported in the Appendix and at www.COVIDSocialStudy.org
Findings
Compliance has been increasing since September, especially as stricter measures have been brought in, with
particular improvements since the start of December when news of the new variant became widespread.
Majority compliance with the rules (following them with some ‘bending’ of the rules) is being reported by
96% of people; an improvement since the start of the autumn across all demographic groups. Complete
compliance is being reported by the majority of people (56% for the week ending 10 th January).
The increase in compliance has occurred alongside an increase in people self-reporting that they think they
understand the rules as stricter rules with fewer caveats have come in. As of the week of the 4th January in
England, when there was a new lockdown, 74% reported broadly understanding the rules compared to 65%
in the week of 14th December. However, self-reported complete understanding of the rules remains very low
(just 27% in the week of 4th January compared with 18% across November and December).
Stress about catching Covid-19 or becoming seriously ill from it has increased substantially in the past month
since news of the new more contagious variant was released. 1 in 2 people are now worried; the highest
level since the middle of the first lockdown back in April. Additionally, life satisfaction and happiness have
decreased since stricter rules were brought in across December, with levels now comparable to those during
lockdown in the spring of 2020. Depression and anxiety levels are at a similar level to how they were in
November, but this is higher than during the summer.
Compliance has been highest when people have been living in the highest tier where rules are strictest, but
lowest in Tier 2, where restrictions are looser and may be more open to interpretation (e.g. journeys
limited/work from home “where possible” etc), and where the importance and seriousness of following the
measures may not be as clear. This pattern is found across all age groups, genders, and income groups.
Looking at compliance with specific rules, the rules that people report breaking most often is meeting up
with more than the recommended number of people outdoors (5% saying they never follow this, and 11%
saying they never, rarely or only occasionally follow this) and indoors (4% saying they never follow this, and
10% saying they never, rarely or only occasionally follow this. However, the vast majority of people (76% and
77%) report always following these rules. The percentage of people breaking the rule outdoors is similar
across age groups. However, older adults are stricter on following the rule indoors.
1 in 10 people say they never, rarely or only occasionally wash their hands after contact with others or
surfaces that could be contaminated. However, the majority (55%) do say that they always follow this rule.
Compliance with hand washing is highest amongst older adults, women and in lower income households.
Less than 1% of people say that they never maintain the recommended distance from others, but 8% find
this rule hard to adhere to, reporting that they either do it never, rarely, or only occasionally. 49% say that
they always follow this rule. Compliance with maintaining distance is highest amongst older adults and in
lower income households.
3
Less than 1% of people say that they never wear a face mask where it is recommended, with 93% reporting
that they always do it. Compliance with wearing a face mask is similar across all age groups but slightly higher
in women and amongst higher income households.
Younger adults have been most consistent in requesting tests when they experience symptoms of Covid-19,
with 42% requesting a test every time compared to 37% of adults aged 30-59 and 18% of adults aged 60+.
75% of adults aged 60+ said they had never requested a test despite experiencing symptoms on one or more
occasions since the pandemic started.
Only 62% of people are isolating for the recommended number of days (10 or more) when they develop
symptoms of Covid-19. 39% are isolating for much longer (21 days or more), which could be due to
experiencing ongoing symptoms of the virus. However, 13% are not isolating at all when they develop
symptoms. 80% of people are isolating for the recommended number of days (10 or more) when they are
told they have come into contact with someone with symptoms of Covid-19. 50% are isolating for much
longer (21 days or more). However, 12% are not isolating at all. Younger adults are better at self-isolating for
the recommended number of days both if they develop symptoms or are told to self-isolate from contact
with others and show a much lower rate of not isolating at all.
4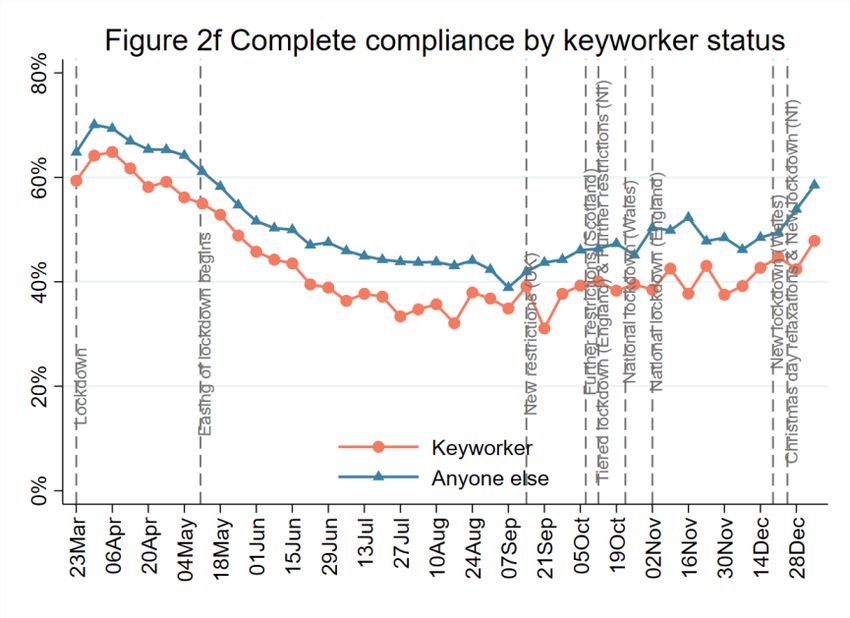
1. Compliance and confidence
                1.1 Compliance with guidelines

                                                               Figure 1b Compliance with guidelines (scores 1-7)
100%

80%

60%

40%

20%

 0%
                                                                                                                                       21-Sep
       23-Mar

                  06-Apr

                           20-Apr

                                    04-May

                                             18-May

                                                                                                                              07-Sep
                                                                                                        10-Aug

                                                                                                                     24-Aug

                                                                                                                                                                  02-Nov

                                                                                                                                                                           16-Nov

                                                                                                                                                                                    30-Nov
                                                                                  13-Jul

                                                                                           27-Jul
                                                      01-Jun

                                                                15-Jun

                                                                         29-Jun

                                                                                                                                                05-Oct

                                                                                                                                                         19-Oct

                                                                                                                                                                                             14-Dec

                                                                                                                                                                                                      28-Dec

                                                               1-Not at all        2       3        4            5       6     7-Very much so

                                                                                               FINDINGS

                Respondents were asked to what extent they are following the recommendations from government such as
                social distancing and staying at home, ranging from 1 (not at all) to 7 (very much so). Of note, we ask participants
                to self-report their compliance, which relies on participants understanding the regulations. Figure 1 shows the
                percentage of people across the whole of the UK who followed the recommendations “completely” (with a score
                of 7) or to a large extent (with a score of 5-7; described below as “majority” compliance).
                Compliance has been increasing since September, especially as stricter measures have been brought in, with
                particular improvements since the start of December when news of the new variant became widespread.

                                                                                                        5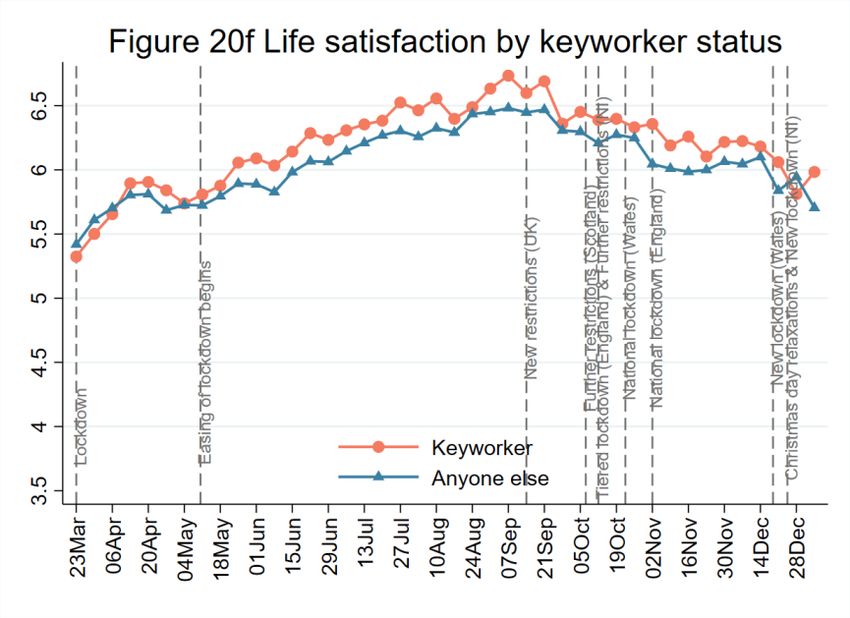
Majority compliance is being reported by 96% of people; an improvement since the start of the autumn across
all demographic groups (Figures 2m-2x). Complete compliance with the rules (i.e. following them with no
bending or even minor infringements) is being reported by the majority of people (56% for the week ending 10th
January) (Figures 2m-2x).
The patterns of compliance remain as they were for the last few months though, with compliance lower in higher
income households, in urban areas, amongst men, and amongst people in good physical health. But the
improvements have been seen across all groups.
It is also important to note that the increase in compliance has occurred alongside an increase in people self-
reporting that they think they understand the rules as stricter rules with fewer caveats have come in. As of the
week of the 4th January in England, when there was a new lockdown, 74% reported broadly understanding the
rules compared to 65% in the week of 14th December. However, self-reported complete understanding of the
rules remains very low (just 27% in the week of 4th January compared with 18% across November and December).

                                                       6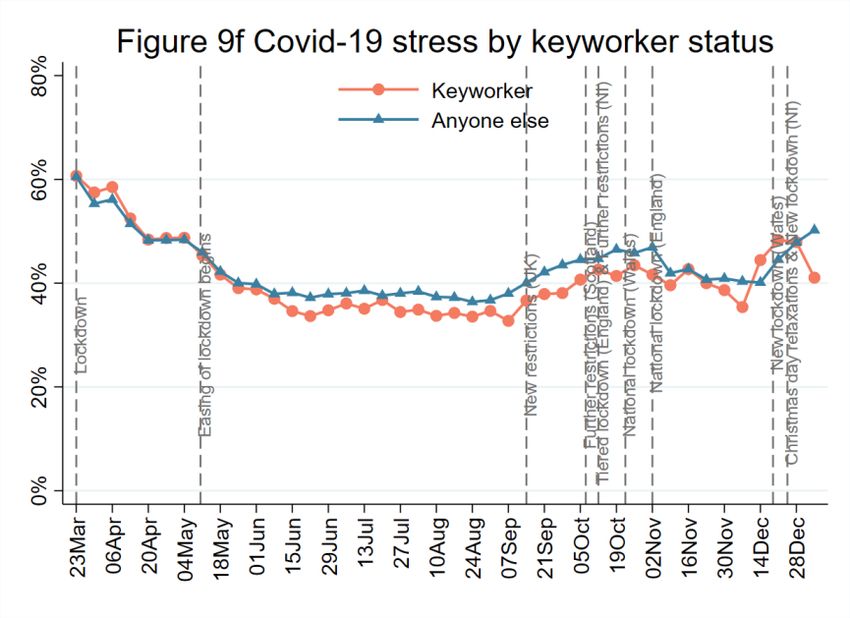
7

8
9

#

    10
11
12
1.2 Confidence in Government

                                                   FINDINGS

Respondents were asked how much confidence they had in the government to handle the Covid-19 epidemic
from 1 (not at all) to 7 (lots). People living in devolved nations were asked to report their confidence in their
own devolved governments.
Levels of confidence in central government to handle the Covid-19 epidemic have not changed over the past
month in England or Wales but have improved after a brief dip in Scotland since tighter restrictions in Scotland
have come in. They remain substantially lower in England than for devolved nations1. They also remain lower in
Wales than they have been since the start of the summer.
For subgroup analyses in Figures 4a-d and 4f-h, we restrict our results to respondents living in England in order
to have sufficient sample sizes for meaningful subgroup analyses (further separate analyses are focusing on
subgroups in devolved nations). In England, confidence in government is still lowest in those under the age of
30. Confidence is also lower in urban areas, amongst people from ethnic minority backgrounds, amongst people
with higher educational qualifications, and in people with a mental health diagnosis. Confidence is also slightly
lower in people of higher household income.

1
 Figures for Northern Ireland have now been removed from our daily tracker graphs due to a small sample size
that makes extrapolation even with statistical weighting unreliable. These data are being analysed in other
papers and reports.
                                                    13
14
15
16
2. Mental Health
2.1 Depression and anxiety

                                                               FINDINGS

Respondents were asked about depression levels during the past week using the Patient Health Questionnaire
(PHQ-9) and anxiety using the Generalised Anxiety Disorder assessment (GAD-7); standard instruments for
diagnosing depression and anxiety in primary care. These are 9 and 7 items respectively with 4-point responses
ranging from “not at all” to “nearly every day”, with higher overall scores indicating more symptoms. Scores of
higher than 10 can indicate major depression or moderate anxiety.
Depression and anxiety levels are at a similar level to how they were in November. This is higher than during the
summer. Although this study focuses on trajectories rather than prevalence, the levels overall are higher than
usual reported averages using the same scales (2.7-3.2 for anxiety and 2.7-3.7 for depression2).
Depression and anxiety are still highest in young adults, women, people living alone, people with lower
household income, people with a long-term physical health condition, people with lower educational
qualifications, people from ethnic minority backgrounds, people living with children, and people living in urban
areas. People with a diagnosed mental illness have still been reporting higher levels of symptoms (as might be
expected) (see Figures 6).

2
  Löwe B, Decker O, Müller S, Brähler E, Schellberg D, Herzog W, et al. Validation and Standardization of the Generalized Anxiety Disorder
Screener (GAD-7) in the General Population. Medical Care. 2008;46(3):266–74. | Tomitaka S, Kawasaki Y, Ide K, Akutagawa M, Ono Y,
Furukawa TA. Stability of the Distribution of Patient Health Questionnaire-9 Scores Against Age in the General Population: Data From the
National Health and Nutrition Examination Survey. Front Psychiatry. NB in the absence of identified directly comparable prevalence estimates
in the UK, these studies look at prevalence in the US in the general population.

                                                                    17
18
19
20
21
22
23
2.2 Stress

                                                    FINDINGS

We asked participants to report which factors were causing them stress in the last week, either minor stress or
major stress (which was defined as stress that was constantly on their mind or kept them awake at night).
Stress about catching Covid-19 or becoming seriously ill from it has increased substantially in the past month
since news of the new more contagious variant was released. 1 in 2 people are now worried; the highest level
since the middle of the first lockdown back in April.
Worries about finance have remained stable over the Christmas period, comparable to their lowest levels of 1
in 4 people over the summer. Similarly, worries about unemployment remain relatively low, concerning just 1 in
8 people. However, worries about accessing food have now increased to 1 in 10 people; the highest level since
lockdown easing began in May.
People with diagnosed mental illness have been more worried about all factors. But other predictors of stressors
have varied. Specifically in relation to worries about Covid-19, these levels are highest in adults over the age of
30, women, and people with diagnosed physical health conditions, but they have been rising across other groups
too. They are similar across most other demographic factors. Concerns about unemployment and finances are
highest in lower income households, amongst those under the age of 60, those living with children, those from
ethnic minority groups, and those living in urban areas. All groups are showing similar concern about accessing
food, although these concerns are highest in people with a diagnosed physical health condition, where going to
supermarkets may be more of a concern.

                                                        24
25
26
27
28
29
30
31
32
33
34
35
36
3. Self-harm and abuse
3.1 Thoughts of death or self-harm

                                                   FINDINGS

Thoughts of death or self-harm are measured using a specific item within the PHQ-9 that asks whether, in the
last week, someone has had “thoughts that you would be better off dead or of hurting yourself in some way”.
Responses are on a 4-point scale ranging from “not at all” to “nearly every day”. We focused on any response
that indicated having such thoughts.
There continues to be no clear change in thoughts of death or self-harm. Percentages of people having thoughts
of death or self-harm have been relatively stable throughout the pandemic. However, they may be rising
amongst adults with a diagnosed mental health condition. This remains to be carefully tracked over the coming
weeks. They remain higher amongst younger adults, those with lower household income, and people with a
long-term physical health condition. They are also higher in people living alone and those living in urban areas.
There is no difference by gender.

                                                       37
38
39
40
3.2 Self-harm

                                                     FINDINGS

Self-harm was assessed using a question that asks whether someone in the last week has been “self-harming or
deliberately hurting yourself”. Responses are on a 4-point scale ranging from “not at all” to “nearly every day”.
We focused on any response that indicated any self-harming.
Self-harm has remained relatively stable over the past month, being reported by around 2-2.5% of people in the
sample. Self-harm remains higher amongst younger adults, those with lower household income, and those with
a diagnosed mental health condition. It is also slightly higher amongst people living in urban areas. It is also
higher amongst people with long-term physical health conditions.
It should be noted that not all people who self-harm will necessarily report it, so these levels are anticipated to
be an under-estimation of actual levels.3

3
 Spikes on particular days are likely due to variability in the data as opposed to indications of particularly
adverse experiences on certain days.

                                                        41
42
43
44
3.3 Abuse

                                                     FINDINGS

Abuse was measured using two questions that ask if someone has experienced in the last week “being physically
harmed or hurt by someone else” or “being bullied, controlled, intimidated, or psychologically hurt by someone
else”. Responses are on a 4-point scale ranging from “not at all” to “nearly every day”. We focused on any
response on either item that indicated any experience of psychological or physical abuse.
Abuse has remained relatively stable in the past few months, including over the Christmas period. It remains
higher amongst people with a diagnosed mental or physical health condition. It is also slightly higher amongst
people with lower household income, those living in urban areas, and people from ethnic minority backgrounds.
It should be noted that not all people who experienced physical or psychological abuse will necessarily report it,
so these levels are anticipated to be an under-estimation of actual levels.4

4
 Spikes on particular days are likely due to variability in the data as opposed to indications of particularly
adverse experiences on certain days.

                                                        45
46
47
48
4. General well-being
4.1 Life satisfaction

                                                             FINDINGS

Respondents were asked to rate their life satisfaction during the past week using the ONS wellbeing scale, which
asks respondents about how satisfied they are with their life, using a scale from 0 (not at all) to 10 (completely).
Life satisfaction has decreased since stricter rules were brought in across December, with levels now comparable
to those during lockdown in the spring of 2020. This decrease since August appears to have occurred across all
age groups, although adults under the age of 60 have lowest levels of life satisfaction. It is also lower in people
living alone, people with lower household income, people with a diagnosed mental health condition, and people
living in urban areas. It is similar across UK nations and amongst key workers. Women have lower levels of life
satisfaction, as do people with a long-term physical health condition and people from ethnic minority
backgrounds (although smaller sample sizes compared to people with white ethnicity mean there has been
greater volatility in these data).
Life satisfaction is still noticeably lower than for the past 12 months (where usual averages are around 7.7), and
wellbeing more generally appears to have decreased substantially in the weeks preceding lockdown 5.

5
  Layard R, Clark A, De Neve J-E, Krekel C, Fancourt D, Hey N, et al. When to release the lockdown: A wellbeing framework for
analysing costs and benefits. Centre for Economic Performance, London School of Economics; 2020 Apr. Report No.: 49.

                                                                 49
50
51
52
4.2 Loneliness

                                                   FINDINGS

Respondents were asked about levels of loneliness using the 3-item UCLA-3 loneliness, a short form of the
Revised UCLA Loneliness Scale (UCLA-R). Each item is rated with a 3-point rating scale, ranging from “never” to
“always”, with higher scores indicating greater loneliness.
Loneliness levels have been relatively stable in the past month but are very slightly higher (2%) than they were
over the summer before new restrictions were brought in. The greatest increase in recent weeks has occurred
in people living alone. Levels are still highest in younger adults, women, people from ethnic minority
backgrounds, people with lower household income, people living with children, people living in urban areas, and
people with a diagnosed mental or physical health condition.

                                                      53
54
55
56
4.3 Happiness
FINDINGS
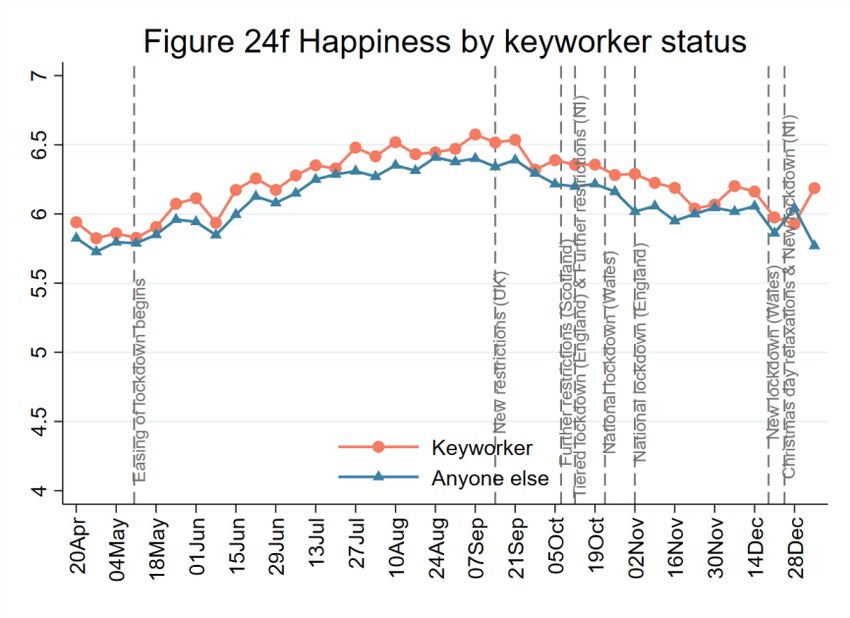
Respondents were asked to rate to what extent they felt happy during the past week using the Office for National
Statistics wellbeing scale on a scale from 0 (not at all) to 10 (completely). Happiness ratings are only available
from 21st April onwards.
Happiness levels have further decreased in the past few month as stricter restrictions have been brought in.
They are now at their lowest level since lockdown back in the spring of 2020. The decrease in recent weeks has
been particularly evident amongst older adults (although they remain higher in this age group compared to
younger adults). Happiness levels are also lower amongst those living alone, those with lower household income,
people with a diagnosed mental or physical health condition, people living in urban areas, women, and people
from ethnic minority backgrounds.
5758
59
60
5. Compliance with guidelines
5.1 Compliance by the tiered system (England)

                  Figure 25 Compliance with guidelines by tiered system
                                       (England)
 100%

  80%

  60%

  40%

  20%

   0%
              Tier 1 (Medium)              Tier 2 (High)            Tier 3 (Very high)      Tier 4 (Highest)

                                1-Not at all    2    3     4    5   6     7-Very much so

                                                         FINDINGS

Focusing on people living in England, we split people’s self-reports of how good their compliance with the
guidelines was (see section 1.1) by the tier they were living in. Where people lived in areas that moved between
tiers we looked at their behaviours in each of their tiers for comparative purposes.
Complete compliance (a score of 7 out of 7) has been highest when people have been living in the highest tier
(51%) where rules are strictest, but lowest in Tier 2 (43%), where restrictions are looser and may be more open
to interpretation (e.g. “journeys limited where possible”, “work from home where possible” etc), and where the
importance and seriousness of following the measures may not be as clear. Majority compliance (a score of 5-7
out of 7) has also been higher in Tier 4 (93%) compared with Tier 2 (92%), although highest in Tier 1 (95%), where
broadly following the rules may involve the smallest changes to everyday life.
This pattern is found across all age groups, genders, and income groups (see Figures 26).

                                                           61
Figure 26b Compliance with guidelines by tiered
Figure 26a Compliance with guidelines by tiered
system (adults aged 30-59)
system (younger adults aged 18-29)
100%
100%
80%
80%
60%
60%
40%
40%
20%
20%
0%
0% Tier 1 (Medium) Tier 2 (High) Tier 3 (Very high) Tier 4 (Highest)
Tier 1 (Medium) Tier 2 (High) Tier 3 (Very high) Tier 4 (Highest)
1-Not at all 2 3 4 5 6 7-Very much so
1-Not at all 2 3 4 5 6 7-Very much so
Figure 26c Compliance with guidelines by tiered Figure 26d Compliance with guidelines by tiered
system (older adults aged 60+) system (female)
100% 100%
80% 80%
60% 60%
40% 40%
20% 20%
0% 0%
Tier 1 (Medium) Tier 2 (High) Tier 3 (Very high) Tier 4 (Highest) Tier 1 (Medium) Tier 2 (High) Tier 3 (Very high) Tier 4 (Highest)
1-Not at all 2 3 4 5 6 7-Very much so 1-Not at all 2 3 4 5 6 7-Very much so
62Figure 26e Compliance with guidelines by tiered Figure 26f Compliance with guidelines by tiered
system (male) system (household income 30k)
100%
80%
60%
40%
20%
0%
Tier 1 (Medium) Tier 2 (High) Tier 3 (Very high) Tier 4 (Highest)
1-Not at all 2 3 4 5 6 7-Very much so
635.2 COVID-19 rules compliance
Figure 27 COVID-19 rules compliance
Wearing a face mask or other face covering where it is
currently recommended
Meeting up with only the recommended number of people
from other households INDOORS
Meeting up with only the recommended number of people
from other households OUTDOORS
Washing your hands thoroughly with soap and water or using
hand sanitising gel after any possible contact with other people
outside of your household or shared surfaces
Maintaining the recommended distance from people not in
your household/bubble
0% 20% 40% 60% 80% 100%
Never Rarely Occasionally Frequently Always
FINDINGS
Across December, we asked people which rules specifically they had been following in relation to controlling the
spread of the Covid-19 virus. These included wearing face masks, following the rules within their tier, washing
their hands, maintaining the recommended distance from others, and meeting up with only the allowed number
of people indoors and outdoors.
The rules that people report breaking most often is meeting up with more than the recommended number of
people outdoors (5% saying they never follow this, and 11% saying they never, rarely or only occasionally follow
this) and indoors (4% saying they never follow this, and 10% saying they never, rarely or only occasionally follow
this. However, the vast majority of people (76% and 77%) report always following these rules. The percentage
of people breaking the rule outdoors is similar across age groups (12% of 18-29 year olds, 11% of 30-59 year olds,
and 12% of those aged over 60, with 77%, 77% and 74% respectively always following the rule). However, older
adults are stricter on following the rule indoors (81% always following it compared to 78% of 30-59 year olds
and 70% of 18-29 year olds). Indoors, compliance is the same amongst men and women (77%) but outdoors it
is slightly higher amongst women (78% vs 74%). Levels are similar indoors amongst people from lower and higher
income households (78% vs 77%) and outdoors (76% vs 77%).
People also report not always washing their hands, with 1 in 10 people (11%) saying they never, rarely or only
occasionally wash their hands after possible contact with others. However, the majority (55%) do say that they
always follow this rule. Compliance with hand washing is highest amongst older adults (60% always do it)
compared with 55% of adults aged 30-59 and 46% of adults aged 18-29. It is also higher amongst women (60%
always doing) than men (50% always doing) and in lower income households (57%) than higher income
households (52%).
Less than 1% of people say that they never maintain the recommended distance from others, but 8% find this
rule hard to adhere to, reporting that they either do it never, rarely, or only occasionally. 49% say that they
always follow this rule. Compliance with maintaining distance is highest amongst older adults (62% always do it)
compared with 49% of adults aged 30-59 and 30% of adults aged 18-29. Levels always complying are comparable
amongst women (50%) and men (49%) but are higher in lower income households (54%) than higher income
households (44%).
64Less than 1% of people say that they never wear a face mask or other covering where it is recommended, with
under 2% reporting finding this rule hard to adhere to (never, rarely, or occasionally) and 93% reporting that
they always do it. Compliance with wearing a face mask is similar across all age groups (94% of adults aged 60+
vs 92% of adults aged 18-59). It is slightly higher in women (94% vs 91% in men) and amongst higher vs lower
income households (94% vs 91%).
Figure 28a COVID-19 rules compliance amongst younger adults
(aged 18-29)
Wearing a face mask or other face covering where it is
currently recommended
Meeting up with only the recommended number of
people from other households OUTDOORS
Meeting up with only the recommended number of
people from other households INDOORS
Washing your hands thoroughly with soap and water or
using hand sanitising gel after any possible contact with
other people outside of your household or shared surfaces
Maintaining the recommended distance from people not
in your household/bubble
0% 20% 40% 60% 80% 100%
Never Rarely Occasionally Frequently Always
Figure 28b COVID-19 rules compliance amongst adults (aged 30-59)
Wearing a face mask or other face covering where it is
currently recommended
Meeting up with only the recommended number of people
from other households INDOORS
Meeting up with only the recommended number of people
from other households OUTDOORS
Washing your hands thoroughly with soap and water or using
hand sanitising gel after any possible contact with other
people outside of your household or shared surfaces
Maintaining the recommended distance from people not in
your household/bubble
0% 20% 40% 60% 80% 100%
Never Rarely Occasionally Frequently Always
65Figure 28c COVID-19 rules compliance amongst older adults (aged
60+)
Wearing a face mask or other face covering where it is
currently recommended
Meeting up with only the recommended number of people
from other households INDOORS
Meeting up with only the recommended number of people
from other households OUTDOORS
Maintaining the recommended distance from people not in
your household/bubble
Washing your hands thoroughly with soap and water or using
hand sanitising gel after any possible contact with other people
outside of your household or shared surfaces
0% 20% 40% 60% 80% 100%
Never Rarely Occasionally Frequently Always
Figure 28d COVID-19 rules compliance amongst female
Wearing a face mask or other face covering where it is
currently recommended
Meeting up with only the recommended number of people
from other households OUTDOORS
Meeting up with only the recommended number of people
from other households INDOORS
Washing your hands thoroughly with soap and water or using
hand sanitising gel after any possible contact with other
people outside of your household or shared surfaces
Maintaining the recommended distance from people not in
your household/bubble
0% 20% 40% 60% 80% 100%
Never Rarely Occasionally Frequently Always
66Figure 28e COVID-19 rules compliance amongst male
Wearing a face mask or other face covering where it is
currently recommended
Meeting up with only the recommended number of people
from other households INDOORS
Meeting up with only the recommended number of people
from other households OUTDOORS
Washing your hands thoroughly with soap and water or
using hand sanitising gel after any possible contact with
other people outside of your household or shared surfaces
Maintaining the recommended distance from people not in
your household/bubble
0% 20% 40% 60% 80% 100%
Never Rarely Occasionally Frequently Always
Figure 28f COVID-19 rules compliance amongst people with
household incomeFigure 28g COVID-19 rules compliance amongst people with
household income >30k
Wearing a face mask or other face covering where it is
currently recommended
Meeting up with only the recommended number of
people from other households OUTDOORS
Meeting up with only the recommended number of
people from other households INDOORS
Washing your hands thoroughly with soap and water or
using hand sanitising gel after any possible contact with
other people outside of your household or shared
surfaces
Maintaining the recommended distance from people
not in your household/bubble
0% 20% 40% 60% 80% 100%
Never Rarely Occasionally Frequently Always
685.3 Test request if developed symptoms of COVID-19
Figure 29 Requested a test if developed symptoms
of COVID-19
Yes every time 33.1%
On some occasions but not others 9.6%
No never 57.3%
0% 20% 40% 60% 80%
FINDINGS
We asked participants if they had requested a test if they developed symptoms of Covid-19 since the pandemic
started.6 33% said that they had requested a test every time they developed symptoms, but 10% said they had
only requested a test on some occasions but not others, and 57% said they had never requested a test even
though they had experienced symptoms. 7
Younger adults have been most consistent in requesting tests when they experienced symptoms, with 42%
requesting a test every time, compared to 37% of adults aged 30-59 and 18% of adults aged 60+. 75% of adults
aged 60+ said they had never requested a test despite experiencing symptoms on one or more occasions.
Women have also been more consistent in requesting tests (39% always requesting them vs 27% of men). People
in higher income households have also most consistently requested tests (39% every time vs 28% in lower
income households).8
6
NB Testing has not been continuously available across the pandemic to everyone, so these results combine
people who may not have been able to request tests with people who may have simply chosen not to request
a test.
7
Adults who had not experienced symptoms were excluded from these analyses
8
NB These analyses do not specify whether tests were taken through the free Track & Trace system or if
people paid for tests privately.
69Figure 30a Requested a test if developed Figure 30b Requested a test if developed
symptoms by age groups symptoms by gender
60+
Female
30-59
Male
18-29
0% 20% 40% 60% 80% 100% 0% 20% 40% 60% 80% 100%
No never On some occasions but not others Yes every time No never On some occasions but not others Yes every time
Figure 30c Requested a test if developed
symptoms by household income
Household income 30k
0% 20% 40% 60% 80% 100%
No never On some occasions but not others Yes every time
705.4 Self-isolation
Figure 31 Days of self-isolation
Days of self-isolation when told they had come into
contact with somebody else who developed
symptoms of COVID-19
Days of self-isolation if developed symptoms of
COVID-19
0% 20% 40% 60% 80% 100%
0 1 to 5 6 to 9 10 to 14 15 to 20 21 +
FINDINGS
We asked people how long they have been isolating if they either developed symptoms of COVID-19 or were
told that they had come into contact with someone else who had developed symptoms. For people who had
experienced either event more than once, we asked people to report the shortest amount of time they had
isolated for. The rules are that individuals should isolate for 10 days in either circumstance.
Only 62% of people are isolating for the recommended number of days (10 or more) when they develop
symptoms of Covid-19. 39% are isolating for much longer (21 days or more), which could be due to experiencing
ongoing symptoms of the virus. However, 13% are not isolating at all when they develop symptoms, 16% are
only isolating for 1-5 days, and 9% are only isolating for 6-9 days. Adults aged 18-59 are better at self-isolating
for the recommended number of days (63% vs 61% of those aged 60+), and show a much lower rate of not
isolating at all (3% for those aged 18-29 vs 13% of those aged 30-59 and 26% of those aged 60+). The percentage
of people self-isolating for the recommended length of time is the same across genders (62%) but the number
not isolating at all is higher in men (17%) than women (10%). People in higher income households are also
showing a slightly higher level of self-isolating for the recommended length of time (63% vs 61%) and are much
less likely not to isolate at all (9% vs 18%).
80% of people are isolating for the recommended number of days (10 or more) when they are told they have
come into contact with someone with symptoms of Covid-19. 50% are isolating for much longer (21 days or
more). However, 12% are not isolating at all when they are told they have come into contact with someone with
Covid-19, 5% are only isolating for 1-5 days, and 3% are only isolating for 6-9 days. Younger adults are better at
self-isolating for the recommended number of days (85% vs 74% of those aged 60+), and show a much lower
rate of not isolating at all (2% for those aged 18-29 vs 13% of those aged 30-59 and 21% of those aged 60+). The
percentage of people self-isolating for the recommended length of time is the same across genders (80-81%)
but the number not isolating at all is higher in men (13%) than women (10%). People in higher income
households are also showing a higher level of self-isolating for the recommended length of time (83% vs 76%)
and are much less likely not to isolate at all (8% vs 15%).
71Figure 32a Days of self-isolation amongst Figure 32b Days of self-isolation amongst adults
younger adults (aged 18-29) (aged 30-59)
Days of self-isolation when told they had Days of self-isolation when told they had
come into contact with somebody else who come into contact with somebody else who
developed symptoms of COVID-19 developed symptoms of COVID-19
Days of self-isolation if developed Days of self-isolation if developed
symptoms of COVID-19 symptoms of COVID-19
0% 20% 40% 60% 80% 100% 0% 20% 40% 60% 80% 100%
0 1 to 5 6 to 9 10 to 14 15 to 20 21 + 0 1 to 5 6 to 9 10 to 14 15 to 20 21 +
Figure 32c Days of self-isolation amongst older Figure 32d Days of self-isolation amongst female
adults (aged 60+)
Days of self-isolation when told they had
Days of self-isolation when told they had come into contact with somebody else who
come into contact with somebody else who developed symptoms of COVID-19
developed symptoms of COVID-19
Days of self-isolation if developed Days of self-isolation if developed
symptoms of COVID-19 symptoms of COVID-19
0% 20% 40% 60% 80% 100% 0% 20% 40% 60% 80% 100%
0 1 to 5 6 to 9 10 to 14 15 to 20 21 + 0 1 to 5 6 to 9 10 to 14 15 to 20 21 +
72Figure 32e Days of self-isolation amongst male Figure 32f Days of self-isolation amongst people
with household income 30k
Days of self-isolation when told they had
come into contact with somebody else who
developed symptoms of COVID-19
Days of self-isolation if developed
symptoms of COVID-19
0% 20% 40% 60% 80% 100%
0 1 to 5 6 to 9 10 to 14 15 to 20 21 +
73Appendix
Methods
The Covid-19 Social Study is a panel study of the psychological and social experiences of adults in the UK during the
outbreak of the novel coronavirus run by University College London and funded by the Nuffield Foundation, UKRI and
the Wellcome Trust. To date, over 70,000 people have participated in the study, providing baseline socio-demographic
and health data as well as answering questions on their mental health and wellbeing, the factors causing them stress,
their levels of social interaction and loneliness, their adherence to and trust in government recommendations, and
how they are spending their time. The study is not representative of the UK population, but instead it aims to have
good representation across all major socio-demographic groups. The study sample has therefore been recruited
through a variety of channels including through the media, through targeted advertising by online advertising
companies offering pro-bono support to ensure this stratification, and through partnerships with organisations
representing vulnerable groups, enabling meaningful subgroup analyses.
Specifically, in the analyses presented here we included adults in the UK. We used new cross-sectional data from
individuals as they entered the study and also included weekly longitudinal data as participants received their routine
follow-up. In this report, we treated the data as repeated cross-sectional data collected daily from the 21st March 2020
to the 10th January 2021 (the latest data available). Aiming at a representative sample of the population, we weighted
the data for each day to the proportions of gender, age, ethnicity, education and country of living obtained from the
Office for National Statistics (ONS, 2018). Where results for subgroups show volatility, this could be a product of the
sample size being smaller so caution in interpreting these results is encouraged.
The study is focusing specifically on the following questions:
1. What are the psychosocial experiences of people in isolation?
2. How do trajectories of mental health and loneliness change over time for people in isolation?
3. Which groups are at greater risk of experiencing adverse effects of isolation than others?
4. How are individuals’ health behaviours being affected?
5. Which activities help to buffer against the potential adverse effects of isolation?
The study has full ethical and data protection approval and is fully GDPR compliant. For further information or to
request specific analyses, please contact Dr Daisy Fancourt d.fancourt@ucl.ac.uk. To participate or to sign up for the
newsletter and receive monthly updates on the study findings, visit www.COVIDSocialStudy.org
Demographics of respondents included in this report
Table: Demographics of observations from participants in the pooled raw data (unweighted; data are weighted for analyses)
For full demographics weighted to population proportions, see the User Guide at www.covidsocialstudy.org/results
Number of % Number of %
observations observations
Age Education levels
18-29 48,124 5.91 GCSE or below 114,590 14.1
30-59 449,982 55.2 A-levels of equivalent 140,887 17.3
60+ 316,732 38.9 Degree or above 559,361 68.7
Gender Any diagnosed mental health conditions
Male 204,781 25.2 No 678,087 83.2
Female 606,775 74.8 Yes 136,751 16.8
Ethnicity Any diagnosed physical health conditions
White 780,042 96.0 No 470,189 57.7
Ethnic minority 32,273 3.97 Yes 344,649 42.3
UK nations Keyworker
England 657,236 81.5 No 644,462 79.1
Wales 98,775 12.2 Yes 170,376 20.9
Scotland 50,887 6.31 Living with children
Living arrangement No (excluding those who live alone) 462,126 71.7
Not living alone 644,417 79.1 Yes 182,291 28.3
Living alone 170,421 20.9 Living area
Annual household Village/hamlet/isolated dwelling 203,649 25.0
income
>30k 438,582 59.7 City/large town/small town 611,189 75.0You can also read