COVID-19, Labor Market Shocks, and Poverty in Brazil: A Microsimulation Analysis1 - World ...
←
→
Page content transcription
If your browser does not render page correctly, please read the page content below
Public Disclosure Authorized

                               COVID-19, Labor Market Shocks, and Poverty in
Public Disclosure Authorized

                               Brazil: A Microsimulation Analysis1

                                                                                    Fabio Cereda, Rafael M. Rubião, and Liliana D. Sousa
                                                                                         Poverty and Equity Global Practice, World Bank
                                                                                                                           July 31, 2020
Public Disclosure Authorized

                               Abstract:
                               In this note we estimate the short-term economic impact of the COVID-19 crisis on Brazilian families vis-
                               a-vis labor shocks. The analysis, using a microsimulation model which incorporates subnational shocks
                               from a computable general equilibrium growth model, shows that over 30 million workers in Brazil may
                               see significant reductions in their labor income in 2020 due to the COVID-19 pandemic. Two-thirds of
                               these workers are informal workers or own-account workers, groups without access to unemployment
                               protection. These household shocks would reduce average per capita income by 7.6 percent, with the largest
                               impact on the second and third quintiles of the income distribution. These income shocks are inequality-
                               increasing: without any mitigation measures, inequality would increase by 4 percent. The country’s first
                               line of defense, its existing unemployment insurance system, reduces the income shock to 5.3 percent. Even
                               so, an additional 8.4 million Brazilians could fall into poverty. The policy responses announced by the
                               government, and particularly the Auxilio Emergencial (AE) transfer, have the potential to fully absorb the
Public Disclosure Authorized

                               labor income shock for the poorest 40 percent and reduce poverty. Yet, these results reflect annualized
                               income, obscuring the sharp reduction in monthly income if demand shocks persist after the AE ends.
                               Looking towards the next phase of the response, considering extensions of AE that are either less generous
                               or more restricted provide a fiscally prudent approach for continuing to support Brazil’s most vulnerable.

                               1This is a background note for: World Bank. 2020. “COVID 19 in Brazil: Impacts and Policy Responses.” World Bank,
                               Washington, DC. © World Bank. https://openknowledge.worldbank.org/handle/10986/34223 License: CC BY 3.0 IGO..

                                                                                                                                                   1
Acknowledgements
The authors recognize the contributions of the broad team who worked on “COVID-19 in Brazil: Impacts
and Policy Responses,” in particular Marek Hanusch, Cornelius Fleischhaker, Joaquim Bento de Souza
Ferreira Filho, Xavier Ciera, and Antonio Soares Martins Neto, as well as the team who has contributed to
BraSim, especially Matteo Morgandi, Katharina Maria Fietz, Alison Rocha De Farias, and Jia Gao.
The authors worked under the guidance of Paloma Anos Casero, Ximena Del Carpio, Rafael Munoz
Moreno and Pablo Acosta. The authors are grateful for comments received from Gabriela Inchauste and
Hernan Winkler.
2Contents
Section 1. Brazilian’s economic vulnerability to COVID-19 ....................................................................... 6
Section 2: Methodology .............................................................................................................................. 10
2.1 Modeling COVID-19 income shocks ............................................................................................... 11
2.2 Modeling unemployment protection ................................................................................................. 13
2.3 Modeling the Bolsa Familia queue ................................................................................................... 15
Section 3: Results........................................................................................................................................ 16
3.1 Impact on household income ............................................................................................................ 17
3.2. Impact on Poverty and Inequality .................................................................................................... 21
3.3 Caveat: Perfect Targeting of AE ....................................................................................................... 27
3.4 After the Auxilio Emergencial ends.................................................................................................. 28
Section 4: Conclusion ................................................................................................................................. 31
Annex .......................................................................................................................................................... 33
Annex 1: Poverty Headcount, by scenario .............................................................................................. 33
Annex 2: Poverty Headcount Growth, by scenario ................................................................................. 34
Annex 3: CGE Model Results................................................................................................................. 35
Annex 4: Poverty Gap, by scenario ........................................................................................................ 36
Annex 5: Poverty and population distribution, by region ....................................................................... 37
Annex 6: Official Unemployment Insurance eligibility rules ................................................................. 38
Annex 7: FGTS modelling rules and detailed assumptions .................................................................... 39
Annex 8: Average income, by definition, by disposable income quintile .............................................. 41
Annex 10: Downside Scenario................................................................................................................ 42
Annex 11: AE rules and their presence in BraSim model ...................................................................... 43
3The first case of COVID-19 in Latin America was identified in Brazil on February 26, 2020. Since
then, the virus has spread throughout the country, reaching from Brazil’s largest cities to isolated
communities in the Amazon. By July 16, 2020, the number of officially recorded cases of COVID-19 in
Brazil was over 2 million (the second highest in the world) with more than 76,000 deaths.2 The economic
effects of the pandemic are being widely felt throughout the country as the country falls into one of the
most severe recessions of its history with projections of a contraction in excess of 8% of GDP for 2020. In
this note, we present initial estimates of the economic costs of this pandemic on households in Brazil.
Most Brazilian households are economically vulnerable to labor income shocks in general, but there
are additional risks due to the specific timing and nature of the COVID-19 crisis. There is a confluence
of several factors worsening the prospects for Brazilian households. First, the pandemic hit Brazil while it
was still in recovery from the 2014-16 domestic crisis. The income of its poorest 40 percent in 2019 was
below its 2014 level, unemployment levels remained near crisis levels, and household debt had grown
significantly. In all, more than half of Brazilian households are either poor or vulnerable to falling into
poverty. The ability of these households to weather a further shock was already strained. Second, while
Brazil has a wide social protection system, has made significant strides in increasing formality in its labor
market, and has a relatively large and generous unemployment insurance system, two in five Brazilians live
in households where the majority of income is from unprotected employment. Third is the exposure of the
vulnerable population to the idiosyncratic features of the COVID-19 crisis. Two-thirds of children and
youth are in this category, leaving them exposed to long term human capital shocks through school
interruptions, possible increases in school dropouts, and high youth unemployment. A majority of the
economically vulnerable live in high-density urban areas and with often precarious sanitary conditions
while depending on informal work in sectors that have been highly impacted. At the same time, while the
pandemic began in major cities, it has swiftly moved into rural areas including the Amazon, with heavy
tolls in some of the most rural states in the country, home to rural poor, including traditional and indigenous
peoples, and forest communities, who have low access to health care.
In this note, we focus on the short-term impact of the COVID-19 crisis on household income through
labor income shocks. For this, we need to consider two angles – first, which sectors will suffer job and
labor income losses, and, second, how these losses affect household income. We do this by first estimating
demand shocks across states and sectors using a macroeconomic model of the Brazilian economy. Given
the uncertain climate, we modeled a baseline and a downside scenario. Based on these demand shocks, the
model generates expected impacts on wages and wage bills. Second, we distribute these wage shocks to
individual workers using a microsimulation tool, which generates estimates of the magnitude of the shock
to overall family income. Along with the shock, we use the tool to model the role of the unemployment
insurance system and two critical policies quickly implemented during the onset of the pandemic.
The true impact of the pandemic on households depends on the social insurance policies already in
place and those designed to address the shocks. This note focuses on three of these policies: the
unemployment insurance system, and two important emergency income support measures that were quickly
implemented by the Brazilian Government in response to the crisis - the expansion of the Bolsa Familia
Program (PBF), and the Emergency Aid transfer program. The expansion of the country’s flagship social
protection program PBF added a 1.2 million new families from the program’s waiting list. The Emergency
Aid (Auxilio Emergencial, AE) program, a BRL 600 (equivalent to US$7.40 per day in 2011 PPP) cash
transfer of three months targeting informal, own-account, and unemployed workers living in low-income
households as well as PBF beneficiaries, is expected to cover between 53 to 68 million workers. As the
2 WHO (World Health Organization), Coronavirus Disease (COVID-19) Situation Report - 155 https://www.who.int/docs/default-
source/coronaviruse/situation-reports/20200623-covid-19-sitrep-155.pdf?sfvrsn=ca01ebe.
4situation is quickly evolving, including ongoing policy discussions of how to continue public support in the
near future, it is important to note that the note reflects the response programs implemented as of late June
2020. The AE, for example, is likely to be extended for an additional two months.
We find that without mitigation measures, this sharp economic contraction has the potential to
severely impact households and push millions into poverty. This impact would be felt throughout the
whole income distribution, but particularly workers in the second and third quintiles, whose income depend
more on vulnerable labor and less on government transfers. In our baseline scenario, annual household
income is expected to decrease by 7.6 percent. The second and third quintiles can expect the largest losses
at around 14 percent, and up to 21 percent in our downside scenario. The richest quintile, on the other hand,
is expected to lose only 4.6 percent of their income. Unemployment insurance protects almost all quintiles’
income, buffering 30 percent of the average income reduction, though with a smaller effect for the lowest
quintile where very few are formal sector workers.
The AE has the potential to absorb much of this shock and, for the poorest, represents a sizeable
though temporary boost to income. With high coverage rates in the first two quintiles and its relative
generosity – with payments about 6 times higher than the average PBF benefit – this program is expected
to increase annualized household income by 14 percent for the poorest 20 percent and 3 percent for the
second quintile.
Given the notable vulnerability of millions of Brazilian households and the significant progression of
the disease in the country, the economic impact of the pandemic in Brazil could be especially strong
compared to other nations. The Global Economic Prospects released in June 2020 by the World Bank
projects a global recession of 5.2% and a decrease of 8.0% in the Brazilian GDP.3 According to this report,
the more substantial impact of the crisis in Brazil is related to the continued growth of COVID-19 cases in
the country, the fall in commodity prices, low private investment due to higher uncertainty, and low public
investment due to the limited government’s fiscal space. The generous transfer provided by the AE comes
in good time and can, at least temporarily, mitigate the impact on lower income households.
The main question that nevertheless remains is what to do after the AE ends if the crisis persists and
employment does not recover? The first beneficiaries of the AE began to receive it in April – most
beneficiaries will have ended their three months before September. New proposals for extending cash
transfers beyond the AE are being floated by policy makers and the public alike. With estimates of up to
68 million eligible beneficiaries, the AE is expected to cost up to BRL 135 billion, 2 percent of the projected
GDP for 20204. Given the fiscal costs of AE on one hand and the continuing health crisis on the other, it is
likely that a program of continued income support at lower generosity levels than the AE will be maintained
into the second half of 2020. The simulations suggest that, if unemployment persists, reducing the payment
by half would still be enough to absorb the impact on the poorest 40 percent. Similarly, reducing the
coverage of the AE by imposing stricter income eligibility could generate fiscal savings without increasing
poverty.
At the same time, short-term income protection is only one part of the puzzle. Brazil is currently one
of the most adversely affected country in terms of case and death counts related to the pandemic. To plan
future actions, it is useful to consider the three stages that countries must pass to overcome the COVID-19
3 World Bank. 2020. Global Economic Prospects, June 2020. Washington, DC: World Bank. DOI: 10.1596/978-1-4648-1553-9.
License: Creative Commons Attribution CC BY 3.0 IGO.
4 World Bank. 2020. Global Economic Prospects, June 2020. Washington, DC: World Bank. DOI: 10.1596/978-1-4648-1553-9.
License: Creative Commons Attribution CC BY 3.0 IGO.
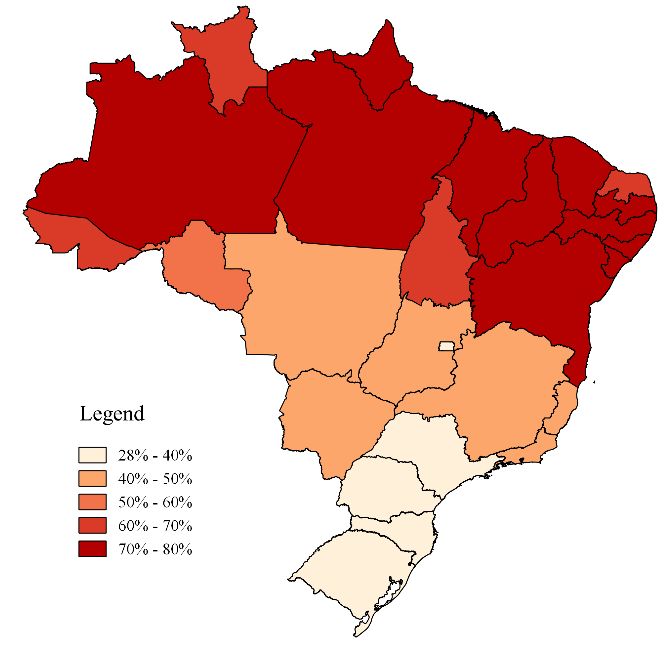
5crisis.5 Brazil is currently in the relief stage, which involves an emergency response to the health threat posed by COVID-19 and its immediate social, economic and financial impacts. Once the pandemic shows signs of being under control, the country will need to enter a restructuring stage focused on strengthening health systems for pandemic readiness, restoring human capital, and restructuring firms and sectors, debt resolutions for firms, as well as recapitalization of companies and financial institutions. Finally, the resilient recovery stage entails taking advantage of new opportunities to build a more sustainable, inclusive and resilient future in a world transformed by the pandemic. Given the expected wide-spread destruction of employment, especially for lower income workers, reactivating these workers during the next phases will need to be a priority. As the country saw after its 2014-16 crisis, employment opportunities for the poorest took significantly longer to recover than for skilled workers. In the likely event of a segmented job recovery and accelerated structural transformation, strategies will be needed to facilitate labor reallocations. This process may leave some workers dislocated and in need of prolonged income support during this process. Strong attention will be needed to the incentive-compatibility of temporary benefits and unemployment insurance, for instance by including training or job search requirements during paid time off from work. Active interventions can equip vulnerable workers with skills and information to navigate these changes. Given the scale of benefit recipients and social distancing measures, training and intermediation policies will likely need to be digitally enabled. Affordable and wide access to internet and digital literacy itself will be an essential skill. This note is organized as follows. In Section 1 we present the Brazilian context, discussing key aspects of the vulnerability of Brazilian households to the pandemic shock. In Section 2 we explain key methodological aspects of our modelling. In Section 3 we present our simulation results for both the pandemic shock and the policy-responses. The results are organized to first look at the impact on household income, then the impact on inequality and poverty, and then considering future extensions of the AE program. In Section 4 we conclude our analysis by putting our main results into perspective and discussing further resilience and vulnerabilities of Brazil when facing the COVID-19 pandemic. Section 1. Brazilian’s economic vulnerability to COVID-196 Even before the pandemic, half of Brazilians (52%) were economically vulnerable, being either already in poverty (living on less than US$5.50 per day in 2011 PPP) or at risk of falling into poverty (living on per capita income between US$5.50 to US$13 per day). This is particularly the case in the North and Northeast regions of Brazil, where in most states, between 70 and 80 percent of the population falls into this category (Figure 1). This population is mostly employed in precarious and unprotected jobs, urban, and young, including more than 7 out of 10 Brazilian children and youth7. They belong to groups expected to suffer a higher income shock. Relatively few households can weather significant labor income shocks. Particularly important is to consider that Brazil’s poorest were still recovering from the 2014-2016 crisis, as the income of the bottom 40 percent is still below the pre-crisis level. Between these years over 5.6 million Brazilians fell into poverty 5 World Bank, 2020. COVID-19 Crisis Response Approach Paper: Saving Lives, Scaling-up Impact and Getting Back on Track. Washington, DC: World Bank. 6 This section is largely derived from World Bank (2020) “COVID 19 in Brazil: Impacts and Policy Responses”. 7 The poor represent 20% of the Brazilian population and include 36% of all Brazilian children (
(defined as living on less than $5.50 per day in 2011 PPP terms) and the inequality, measured by the Gini
Index, changed its downward trend and increase significantly between 2015 and 2018. The fall in labor
income from 2014 to 2019 occurred more sharply in the already vulnerable groups such as young people
between 20 and 24 years old (-17.8%), and individuals with low education (-15.1%)8. Moreover,
unemployment rates remain near crisis-level (Figure 2) and household debt burden is high at 45 percent of
household income, reflecting increased non-mortgage debt since 2017 (Figure 3). At the same time, few
Brazilians have savings: only 32 percent of individuals in Brazil declared saving in the previous year,
compared to 73 percent in OECD countries, 37% in countries with similar GDP per capita, and 48% in the
world.9 These factors suggest many households have little room to absorb another shock.

    Figure 1: Subnational economic vulnerability Figure 2: Unemployment rates
    (Percent of state population who is poor or (percent of labor force, 2012Q1-2020Q1)
    vulnerable, 2018)

                                                                 35
                                                                 30
                                                                 25
                                                                 20
                                                                 15
                                                                 10
                                                                   5
                                                                   0
                                                                       2012 2013 2014 2015 2016 2017 2018 2019 2020

                                                                                      All        Youth: 18-24

    Source: World Bank estimates based on SEDLAC                Source: IBGE unemployment indicators, downloaded on
    (World Bank and Cedlas).                                    June 9, 2020.
    Note: This map shows the percentage of the state
    population living on less than $13/day (2011 PPP).

There is an important overlap between vulnerability in income (ability to pay for food and rent) and
vulnerability in living conditions (adequate housing and services). Poorer households have less access
to improved sanitation, running water, and private bathrooms (Figure 4) – all important services to reduce
the spread of illness. About one in five Brazilians live in slum or substandard housing, and another 32,000
are homeless. Epidemiological models find that COVID-19 is likely to spread more in high-density areas,
such as slums, placing the urban poor as particularly exposed. At the same time, rural populations, including
indigenous peoples, forests, and traditional communities, are also facing additional risks arising from
barriers to access of basic services, including healthcare.

8 Neri, M. 2019. “A escalada da desigualdade – Qual foi o impacto da crise sobre a distribuição de renda e a pobreza?” FGV
Social – Center for Social Policies.
9 Source: Relatório de Cidadania Financeira (2018). Banco Central do Brasil. Available at:

. This report uses data from the Global Findex Database (World Bank)

                                                                                                                             7
Figure 3: Household debt burden Figure 4: Lack of access to adequate sanitation
(Percent of household disposable income, 2007- (Percent, 2018)
20)
Mortgage borrowing
Non-mortgage borrowing
Total debt
Overall
56%
50
Poor (5.5 USD PPP11)
40
36%
30 26%
21%
%
15%
20 10% 08%
03%
10
Trash Connection to Connection to Private
0 collection public water sanitation bathroom
system system
jun/09
abr/10
jun/14
abr/15
dez/16
jun/19
out/07
ago/08
fev/11
dez/11
out/12
out/17
ago/13
ago/18
fev/16
Source: World Bank based on Central Bank of Brazil. Source: World Bank estimates based 2018 PNADC.
Figure 5: Share of population by majority The key transmission channel through which the
income source Covid-19 crisis is expected to affect household
(Percent, 2018) welfare is through market demand and supply
shocks that translate into labor income losses. A
Pensions and Pensions
public transfers; and public large proportion of Brazilian households face a high
23% transfers, risk of losing their income: Two in five Brazilians
59% 31%
protected rely mostly on unprotected income sources (Figure
CLT (>6 months CLT (>6 months 5), defined as the population for whom a majority of
protection); 27% protection); 15% household income comes from informal jobs, own-
account work and formal employment with less than
six months of salary protection in case of job loss.10
Informality 50%
Informality and own-
For the poorest 20 percent, the share of people
41%
and own-
unprotected account relying on unprotected income increases to half of
account work; 43%
work; 32% the population.
Exposure to pandemic-related unemployment or
All Poorest 20%
labor income shocks is heterogenous, affecting
Source: World Bank based on BraSim and 2018 some types of workers more than others. Informal
PNADC. and own-account workers have no formal income
protection mechanisms in place, whereas public
sector workers and most formal private sector salary workers, called Consolidação das Leis do Trabalho
(CLT) contracts, have employment protection and access to unemployment insurance, severance pay, and
10The analysis uses job and worker characteristics to simulate unemployment insurance eligibility, severance pay (multa) and
employer-funded savings account (FGTS) balances as described in Section 2. Based on these amounts, we calculate how many
months of protected salary each formal private-sector salary worker will have in the event of a layoff.
8employer-funded savings accounts. At the same time, economic sectors are differentially exposed. The risk
of employment interruption is higher for sectors with heavy reliance on face-to-face interactions. Low wage
workers and women are more likely to be in these sectors (See Figure 6 and 7), and hence more likely to
suffer the employment shock first.
As a way of minimizing the impacts of the pandemic, the Government as well as private employers
are changing regulations and adapting to new forms of work relations. The 2017 labor reform that
regulated part-time work and the recent Benefício Emergencial de Manutenção do Emprego e da Renda
(BEm) introduced flexibility for firms to suspend paid work as a strategy to reduce the amount of outright
job destruction. Under the BEm wage subsidy, firms are able to temporarily reduce their labor demand, by
reducing hours or imposing temporary layoffs, while protecting the employment relationship. While the
BEm program is not modeled explicitly in this note, it is implicitly part of the unemployment insurance
response in the results reported below since temporarily laid off workers under this program receive benefits
equivalent to UI. In 2014, only 8 percent of workers were allowed to telework11 so, in response to the
pandemic, emergency measures were adopted to facilitate the adoption of telework options. However, few
workers and firms were ready or able to transition to telework options with telework largely limited to
higher paid skilled workers.12
Figure 6: Face to face interactions by salary Figure 7: Face to face interactions by gender
(Average score by income decile, formal sector) (Average and median score, formal sector)
0,64
0,58 0,56 0,58
0,54 0,54 0,54
0,51 0,5
0,47 0,46 0,45 0,47 0,46
Average f2f score
Male Female
Average f2f score Median f2f score
Source: Avdiu, B., X. Cirera, G. Nayyar and A. Soares Martins (2020) “The Impact from COVID-19’s Social
Distance Measures in Brazil. Who are the Most Vulnerable Groups?” The World Bank.
Brazil possesses some notable sources of resilience, especially as compared to many other middle-
income countries, which have allowed it to roll out a strong response to the economic crisis. First,
Brazil benefits from also having a relatively large formal sector workforce with some unemployment
protection and savings mechanisms in place. Second, Brazil has provided near-universal access to pensions
and/or social security to its older population, which is also the most vulnerable to COVID-19. Third, Brazil
has in place a robust infrastructure for delivery of its emergency measures, notably its beneficiary registry,
11 Mello, A., & Dal Colletto, A. (2019). Telework and its effects in Brazil. In Telework in the 21st Century. Edward Elgar
Publishing.
12 We do not model telework explicitly. However, as described below, the allocation of labor shocks in this analysis are
determined by reductions in demand at the sectoral level, not by necessity of social distancing. In this way, telework options do
not affect the distribution of labor shocks.
9the Cadastro Único, with 76.4 million Brazilians registered, complemented by other tools, including an
existing network of NGOs supporting government actions in the slums. This existing infrastructure allowed
for quick implementation of the AE and increases the likelihood of the AE benefit to reach eligible
individuals.
Two of the policy responses implemented by the Government are particularly important for
alleviating the economic impact of the crisis on lower-income Brazilian households and are thus the
focus of this analysis.13 First, the expansion of the Programa Bolsa Familia (PBF) to include families who
were already eligible but were not receiving the benefit due to program budget constraints. The expansion
of PBF is expected to add 1,225,000 families to the program who were in the queue. This increases the total
coverage of the program by 8.6 percent to 14.26 million families at an estimated annual cost of BRL 3.1
billion (0.05 percent of GDP based on 2020 projection). The ‘Auxílio Emergencial’ (AE) is a temporary
emergency program targeting families living in poverty and informal or own account workers. The program
is making three monthly transfers of BRL 600, just under 60 percent of the minimum wage, to individuals
with family income below half the minimum salary per capita, with a maximum value per family of BRL
1200.14
Section 2: Methodology
We build on the BraSim microsimulation tool to estimate the impact of employment shocks and
expanded social protection measures on the income of Brazilian households. A microsimulation model
of the Brazilian population developed in 2019 by the World Bank, BraSim is a tool designed to analyze and
model reforms to the tax and social protection system and how these affect equity, the efficiency of public
spending, and fiscal outcomes (public spending and tax revenue). It is an incidence analysis tool that models
partial equilibrium distributional implications of changes to policies. The tool does not model behavioral
changes or consider general equilibrium implications. That is, the model assumes that household and
individual decisions, such as employment and consumption level, are not affected by changes in policies.
The tool works on a synthetic population based on the household survey that was adjusted to better
approximate official tax collection, program participation rates, and the composition of the labor
market, including detailed modeling of various contract types. It functions by applying the rules of each
transfer program, direct and indirect taxes, pension system contributions, and employer contributions to
simulate the effect of these changes on the after-fiscal policy income of each household. Following the
Commitment to Equity (CEQ) methodology,15 BraSim estimates the incremental impact of different fiscal
policy (taxation and benefits) on take home income. BraSim estimates four of the CEQ concepts of income:
1) gross market income is household income received from market activities prior to any taxation or
subsidy16; 2) net market income is the gross market income minus direct taxes and social security
contributions; 3) disposable income adds government transfers to the net market income; and 4) consumable
income deducts indirect taxes from disposable income.
The income definition used in this analysis is disposable income. Fiscal policy in Brazil, particularly its
relatively generous non-contributory pension programs, increases the disposable income of quintiles 1 and
13
A number of other steps are being taken to reduce food insecurity, including daily monitoring of food prices and allowing
distribution of food acquired by the National School Food Program to the families of school-going children while classes are
suspended. Additional measures to protect vulnerable populations include distributing PPE and hygiene items; temporarily
eliminating utility-cutoffs due to non-payment; and installation of hand washing stations.
14 Single mothers who qualify for the AE can receive BRL 1,200 per month.
15 Lustig, N. 2018. CEQ Handbook Estimating the Impact of Fiscal Policy on Inequality and Poverty. CEQ Institute at Tulane
University and Brookings Institution Press.
16 Contributory pensions, which can be considered deferred employment income, can also be included in this definition.
102 relative to their gross market income (Figure 8).17 For the top 3 quintiles, the disposable income is lower
than market income due to taxation, particularly of formal labor income. BraSim also models eight different
labor contract types, including different private and public sector formal dependent workers, formal sector
own-account workers, and informal own-account and dependent workers.18 The lowest two income deciles
rely heavily on informal employment (both dependent and own-account work) while formal dependent
workers are a crucial part of the middle of the income distribution (see Figure 9).
Figure 8: Average income, by quintiles of gross Figure 9: Percentage of each type of labor
market plus pensions income income, by wage decile
Q1 Q2 Q3 Q4 Q5 (RHS Axis) 100%
1600 4500
80%
1400 4000
1200 3500 60%
3000
1000
2500 40%
800
2000
600
1500 20%
400 1000
200 500 0%
1 2 3 4 5 6 7 8 9 10
0 0
Gross market Net market Disposable Consumable CLT Public workers
income plus income income income Military MEI
pension SIMPLES Contractor
Informal own-account Informal salary
Source: World Bank estimates based on BraSim microsimulation model.
Note: Figure 8 reports the average per capita monthly income of each income quintile. Due to its far higher value,
quintile 5 (Q5) is reported on the right-hand side (RHS) axis. See Annex 9 for a table of average income reported
in this figure. Figure 9 reports the distribution of workers by contract type, across decile of per capita disposable
income.
For the analysis of COVID-19 and mitigation strategies, three extensions were made to BraSim. First,
a methodology was implemented to translate sector-level payroll shocks from a computable general
equilibrium (CGE) model of the Brazilian economy into unemployment shocks in the BraSim population.
Second, it was necessary to model the monetary value of unemployment protection available to each formal
dependent worker. As job destruction in the public sector is not expected during the short-term, this was
done only for private sector workers. And third, it was necessary to model the Bolsa Familia Program’s
(PBF) “queue” – a population of approximately 1.5 million families that had qualified for the PBF in late
2019 but had not yet been added to the program. These are detailed below.
2.1 Modeling COVID-19 income shocks
To model labor interruptions related to COVID-19, BraSim was linked with a CGE model which
simulates sectoral and subnational economic impacts (see Box 1). Two GDP growth scenarios were
17 Benefício de Prestação Continuada (BPC) and rural pensions cover 35 percent of the 65 and older population and pay at least
one minimum salary per month.
18 BraSim distinguishes between private sector dependent worker (CLT, Consolidação das Leis do Trabalho ), public servants, and
the military, as each of these groups have different tax treatment and rights. There are three types of formal own-account workers
in BraSim: 1) contractor (trabalhador autonomo), microentrepreneur (MEI, Microempreendedor Individual), and small business
owner (SIMPLES). Finally, informal workers are distinguished between own-account and dependent workers.
11modeled for 2020: a baseline growth scenario of -8 percent, and a downside scenario of -10.9 percent. For
each of these scenarios, we obtained from the CGE model a different variation of wage bills and
consequently, impacts with varying levels of intensity in BraSim. While we can think of them as
unemployment shocks, more accurately they are reductions in labor income. For example, workers in the
formal sector whose employers take advantage of the BEm program may not be technically unemployed
but will see their wages reduced to unemployment insurance levels. At the same time, informal workers
like street vendors may see a reduction in sales without necessarily becoming unemployed or even reducing
their hours.
The CGE model calculates reductions in wages across 75 cells, defined by the intersection of 15
regions and 5 productive sectors (see Annex 3). By construction, the CGE model assumes no
unemployment and no labor market frictions. While this works well in the CGE framework, it does not
reflect the labor dynamics in Brazil. Like most countries, Brazil has sticky wages and enforceable labor
contracts, which mean that, especially in the formal sector, productivity and output shocks cannot be fully
reflected in adjusted wages or hours. Instead, these shocks are more likely to translate into reduced hours
(when legally feasible) or unemployment spells. We used the CGE’s sector-level wage bill shocks to
generate employment or earnings interruptions in BraSim for private sector workers, excluding the primary
sector.
Box 1. Subnational distribution of economic projections using the TERM-BR CGE Model
Based on World Bank projections, the Brazilian GDP is projected to fall by 8 percent in 2020, in the
baseline scenario, and by 10.9 percent in the downside scenario. Real consumption of households is
projected to fall by 15 percent in the baseline scenario, and by 25 percent in the downside scenario. As
shown by the severity of the contraction of real consumption, this shock is primarily driven by a sharp
reduction in families’ spending. Therefore, the sectorial and regional effects of the macroeconomic
downturn will be driven by where families spend the most, especially services.
In this analysis, the TERM-BR CGE model was used to distribute the projected national economic shock
across the different regions and sectors of Brazil. The TERM-BR belongs to the broader model family
named TERM (The Enormous Regional Model), which was originally developed by Victoria
University’s Center of Policy Studies - CoPS. TERM models have been adapted to several countries
since then, including Brazil, as in the work of Ferreira Filho and Horridge (2016)19 and Diniz (2019)20.
The TERM-BR model used in this study is the most recent version of these models for Brazil. It is an
inter-regional, bottom-up, annual recursive dynamic model with detailed regional representation,
distinguishing up to 136 sectors (industries), 136 commodities and 27 regions. These regions are
represented by interdependent models, one for each unit of the federation (26 states and the Federal
District), which are interconnected and can trade through the goods, labor and capital markets. In this
study we used the aggregated results for 15 regions crossed with 5 sectors. These are detailed in Annex
3.
19 Ferreira Filho and Horridge (2016) “Climate change impacts on agriculture and internal migrations in Brazil” Centre of Policy
Studies/IMPACT Centre Working Papers g-262, Victoria University, Centre of Policy Studies/IMPACT Centre.
20 Diniz (2019) "Impactos econômicos e regionais dos investimentos em geração de energia elétrica no Brasil”. PhD Thesis –
USP/Escola Superior de Agricultura “Luiz de Queiroz”.
12Unemployment shocks are distributed across individual workers in each sector based on individual
and household characteristics. This was based on a logit regression to estimate the likelihood of each
worker being employed.21 Each individual within each of the 60 groups (4 sectors x 15 regions) was then
ranked. To make the rank closer to reality, we apply a penalty coefficient for informal workers, decreasing
their likelihood of being employed.22 Following the rank, we select a certain number of individuals to
receive the unemployment shock. For the baseline scenario, the unemployment shock is equivalent to 6
months – a 50 percent loss of annual labor income. The downside scenario implies a loss of 7 months, or
58.3 percent of annual income. We apply these shocks over the individuals in each group until the total
amount of income removed reaches the total CGE wage bill change estimated for each group. Given the
severity of the current shock, there is no labor reallocation in the short-term in our modeling – individuals
lose labor income for 6 or 7 months, depending on the scenario, and are unable to replace it through
employment this year. 23
2.2 Modeling unemployment protection
Private sector dependent workers (CLT) in Brazil have access to three income protection
mechanisms: unemployment insurance (seguro desemprego – SD), employer-funded compulsory savings
account (FGTS), and severance pay (multa), paid by the employer and corresponding to 40 percent of the
FGTS account balance. Throughout this text, we use the term “unemployment insurance”, or UI, to refer to
these three benefits together.
For modelling SD, we first identify who is eligible and then estimate the monthly benefit amount for
each eligible worker. The benefit amount is straightforward to estimate based on the current salary,
following the official rules summarized in Table 1. In our model we consider only workers with job tenure
of 12 months or more to be eligible to SD. In reality, if it is not the first time the worker requests the SD,
he or she may be eligible to receive the benefit as long as their last job tenure was at least 6 months long
(see the official rules in Annex 6). We excluded unemployment coverage for workers with less than 12
months for three reasons: 1) we do not have employment history in BraSim beyond the current job; 2)
official data reveals that the majority (77.4 percent) of SD applications are from first-time applicants;24 and
3) Only 10 percent of the CLT population in BraSim has tenure 6-11 months. Following the rules of the
program, if the laid-off worker has been working for 12-23 months, he or she is eligible to SD equivalent
to 4 months of salary. For workers with job tenure of 24 months or more, the duration of the benefit
increases to 5 months. The main difference between the law and the way SD is modelled in BraSim is for
workers with job tenure between 6 and 11 months.
21 The Employment Logit model used the following covariates: age, age-squared, years of schooling, gender, race, a dummy for
head of the household and the spouse, state fixed-effects, and household income and precarity indicators (roofing material,
possession of fridge washing machine, TV and computer, access to internet, cable TV, and number of rooms), and main earner
characteristics (years of schooling and dummies for sector of activity, except services).
22 We obtain this coefficient from a Logit model running in a panel data linking the PNADC 1 st interview to 5th interview. The
model assesses the likelihood of exiting employment at the individual level using the following covariates: job informality, a
dummy for head of the household and the spouse, age, age squared, gender, education, and state fixed-effects.
23 We treat the primary sector and the public sector differently. Due to its special labor regime and high rate of self-employment,
for private sector wage changes we do not model unemployment shocks for some workers. Instead all workers in each cell
receive the CGE estimated wage change. Based on macroeconomic projections and current legislation, we do not expect layoffs
of public servants in the short term as a consequence of the pandemic hence no public sector effects were modeled.
24 DIEESE, 2017. Anuário do Sistema Público de Emprego, Trabalho e Renda 2016: Seguro-Desemprego: livro 3. Departamento
Intersindical de Estatística e Estudos Socioeconômicos. São Paulo: DIEESE. (page 42)
13In order to consider the full unemployment protection system, it was also necessary to model each
worker’s FGTS account balance and, by extension, severance pay.25 One FGTS account is created for
each CLT contract, and people can have multiple open accounts. Each month, CLT workers contribute with
8 percent of their monthly salary during their whole tenure period, and FGTS accounts yield an interest of
3 percent annually. People can withdraw funds from their FGTS accounts only under certain circumstances
(e.g. lay-offs, sickness, investment in real estates). Recent public measures to boost consumption have
allowed the withdraw of BRL 500 for all FGTS accounts without any condition.
Table 1: Amount of monthly SD entitlement per wage bracket
Wage Bracket Value per month
Up to BRL 1,450.23 MW or 80% of Wage
From BRL 1,450.24 until BRL 2,417.29 (Wage - BRL 1,450.23) x 50% + BRL1,160.80
Over BRL 2,417.29 BRL 1,643.72
Source: LEI 7.998/1990 (LEI ORDINÁRIA) 11/01/1990
BraSim has limited information regarding
Figure 10: Months of CLT protected salary.
Number of workers and share by quintile. job-history and no information about FGTS
15 12,16 12,30 accounts or previous withdrawals. A number
Milhões
of simplifying assumptions were needed to
10 7,98
estimate likely FGTS account amounts per
4,02
5 worker. We assume only one account per CLT
0,25 worker, corresponding to their current primary
0
job – thus implicitly assuming that older accounts
Q1 Q2 Q3 Q4 Q5
have been already cashed out. We apply the
18%
accumulation rule to each worker’s current
23% 28%
34% 35% 41%
salary, which is then multiplied by their job
26%
tenure and discounted by the yearly minimum
29% wage growth rate (see Annex 7).
28%
26% 25%
22% 23%
Guided by administrative data as benchmarks
21%
19% 1% 21% 19% and to account for the substantial withdrawals
2% 18%
3% 33% 2% 3% permitted throughout the life of these
26% 5%
18% 21% 19% accounts, we applied an FGTS withdrawal rate
13%
that decreases with age, starting at 90 percent for
National Q1 Q2 Q3 Q4 Q5 workers aged 18 or under. We apply this
0 to 1 Months 1 to 3 3 to 6 6 to 9 9+ withdrawal rate only to workers who earn BRL
1,000 per month or less- which is the group for
Source: World Bank estimates based on BraSim
which our estimates most differed from the
microsimulation model.
benchmark. This is also the group who are most
likely to need access to their FGTS balances for
25 Severance pay is a direct percentage of the FGTS balance.
14short-term consumption smoothing - the poorer and the younger. After these adjustments, the estimated
FGTS accounts aggregate balance roughly matched the government’s benchmark number (see Annex 8).
The results show that, even with these three sources of income protection benefits, an estimated 40
percent of CLT workers would incur a loss of income if facing an unemployment spell longer than 6
months. Eighteen percent are in a position of greater vulnerability, receiving only 1 month of salary or less
when combining unemployment insurance, severance pay, and employer-funded savings accounts. That is,
beginning in the second month of unemployment, these individuals would have no income. This is because
people whose current job tenure is of less than 12 months are unlikely to be entitled to UI. In scenarios of
unemployment shocks of more than six months, formal income protection mechanisms would gradually
become insufficient to cushion the impact of income loss. The presence of vulnerable CLT workers occurs
throughout the entire income distribution but mostly marked in the bottom quintiles (see Figure 10).
2.3 Modeling the Bolsa Familia queue
In late 2019 and early 2020, PBF’s budget constraint and continued effects of the 2014-16 crisis on
the poorest generated a queue of about one and a half million families who met the eligibility criteria
for inclusion in the PBF but could not be added to the program. In March 2020, as a response to the
COVID-19 crisis, the Government acted to add 1.225 million families from the queue to the program. The
BraSim model, relying on 2017 data, had no queue. All families who qualified for PBF in the tool were
included, which reflected accurately the situation in 2017.
Figure 11: Distribution of type of worker who Figure 12: Coverage (%) of Bolsa Familia before
received income shocks during the creation of (Reference) and after PBF extension
PBF Fila (Simulation), by decile of gross market income
76
70
63
57
31%
4042
47%
18 19
12
22% 4 2
Formal, salary worker Formal, own account
Informal Reference Simulation
Source: World Bank estimates based on BraSim microsimulation model.
In order to update BraSim to the 2020 period, it was necessary to identify the families that had
become eligible for PBF since 2017. To do this, we applied unemployment shocks to the main earner of a
subset of households to simulate a loss of income - which is, in principle, a likely driver of why families
applied for the Bolsa Familia benefit. To select these households, we first excluded those who were unlikely
to qualify for PBF even after a labor income shock, such as families with significant nonlabor income -
particularly pensions (including BPC) and child support beneficiaries. Then, using a logit model, we
identified the main earners, based on household and economic characteristics, who were more similar to
15the current PBF beneficiaries.26 An unemployment shock was then applied to the 1,225,000 main earners
with the highest probability based on the logit model. Nearly half of these main earners who were
reallocated to unemployment were informal workers and another 22 percent were own-account workers
(Figure 11). Even with this shock, not all families became eligible. We were able to model 95 percent of
the total number of new families added, achieving 1,163,000 families, or approximately 3.3 million people.
Figure 12 shows that the vast majority of these newly eligible families are found in the poorest two deciles,
where coverage of PBF increases by 6 percentage points.
Section 3: Results
The simulations suggest that between 31 and 34 million workers will suffer employment interruptions
equivalent to a loss of 6 to 7 months of earnings (Figure 13). As a reference point, in February 2020,
12.3 million Brazilians were unemployed. The informal sector will be the most affected by the
unemployment shocks, though the impact on formal workers will be substantial as well. About 71 percent
of the informal sector, or over 17 million workers, will suffer the unemployment shock. The situation of
these workers is more difficult since they do not count with any mechanism to protect their income. A third
of CLTs, the largest group of formal workers, will also suffer unemployment spells, totaling about 10.8
million workers (under the baseline scenario).
Figure 13: Number of unemployment shocks The microsimulation model estimates the
per occupation and scenario (in millions) impact of employment interruptions or
unemployment spells on annualized household
40
income. Figure 14 shows the distribution of per
35 capita disposable income in the BraSim population.
3,5
30 3,0 It ranges from an average of below BRL 300 per
25 12,4 month for the poorest quintile to close to BRL
10,8
20 3,500 for the wealthiest quintile. This is the pre-
15 crisis income used for the analysis. The first set of
10 17,6 18,5 results presented in this section measures the
5 impact on annualized average income across the
0 income quintiles and across the regions after the
Baseline Downside shock is implemented.
Informal Formal, salary worker Formal, own account
In order to quantify the impact of these
Source: World Bank estimates based on BraSim scenarios on the population, we also estimate the
microsimulation model. effect on inequality and poverty. While Brazil
does not have an official poverty line, we rely on
two important administrative values to assess household need. We proxy extreme poverty using the Bolsa
Familia eligibility, sometimes referred to as the Bolsa Familia poverty line. It corresponds to BRL 178 per
month per capita (the equivalent of US$ 2.25 per day in 2011 PPP). The share of the population living on
less than half a minimum salary is the default definition of poverty used in this analysis. It is an important
proxy of poverty in Brazil since it is the eligibility threshold for Cadastro Único. It is approximately US$
6.30 (2011 PPP) per day. The share of the population living under each of these thresholds in 2019 are
respectively, 7.8 and 29.1 percent (Figure 15). While the simulations are based on the income distribution
26 The logit model for predicting the likelihood of the main earner in the household being in the PBF queue used the following
covariates: age, age-squared, years of schooling, gender, race, number of children and adolescents in the household, state fixed-
effects, and precarity indicators (roofing material, possession of fridge washing machine, TV and computer, access to internet,
cable TV, and number of rooms).
16of BraSim, the results for poverty and inequality are adjusted to use poverty and inequality in 2019 as the
baseline for reporting new poor, for example.27
Figure 14. Average monthly income per Figure 15. Poverty and inequality trends, 2012-
capita, by quintile 2019
4.000 35 55,5
3.500 30 55,0
54,5
Poverty rate, %
3.000 25
54,0
Gini index
2.500 20 53,5
BRL
2.000 15 53,0
52,5
1.500 10
52,0
1.000 5 51,5
500 0 51,0
2012 2013 2014 2015 2016 2017 2018 2019
-
Bolsa Família 1/2 Minimum salary
Gini
Source: World Bank estimates based on BraSim. Source: World Bank estimates based on PNADC 2012-
2019.
3.1 Impact on household income
The effect of the COVID-19 pandemic on household income in Brazil is expected to be largest in the
middle of the distribution. As a consequence of employment and labor income shocks, annual household
per capita income is expected to fall by 7.6 percent nationally – including by 14.9 percent in the second
quintile and 13.9 percent in the third quintile (See Figure 15a).28 These results are based on annualized
income, reflecting a smoothing of income over the year though obscuring the severity of the income shock
(Box 2). These are the quantiles most affected by the crisis, made up families who rely largely on low and
middle-skill employment and with less reliance on government transfers. The poorest and the fourth
quintiles would also suffer significant shocks approaching -9 percent. The richest quintile is the least
affected, with income decreasing by only 4.6 percent. This is in large part explained by the composition of
workers in this quintile, including high skilled workers with access to telework options and large shares of
public servants (no public sector job destruction is expected in the short-term). This disparity in income
shocks is also reflected regionally. As the hardest hit regions are the North and the Center-West, with a 10
percent of income reduction, followed by the Northeast, with an income reduction of 8.2 percent (See Figure
16b). The richest regions, South and Southeast, are expected to be the least affected with an income
reduction of 5.9 and 7.3 percent, respectively.
Brazil’s existing unemployment insurance system is a crucial first line of defense. We estimate that the
UI buffers 30 percent of the income reduction, with the shock mitigated from -7.6 to -5.3 percent nationally.
However, this protection is distributed unequally, as the UI buffers the two richest quintiles’ losses by 34-
38 percent, while, for the poorest quintile, by at most 6 percent (See Figure 16a). The poorer quintiles have
lower formality rates and instead depend more on informal and own-account jobs without income
protection. Accordingly, the UI is also more significant for the richest regions. For instance, for the
27 These rates are calculated from PNADC 2019, while BraSim results are based on adjusted PNADC 2017 data. Therefore, for
calculating the simulated absolute values, such as the number of new poor, we apply BraSim’s simulated changes in poverty rates
to the absolute PNADC 2019 poverty rates.
28 Downside scenario results are reported in Annex 10
17Southeast region the UI reduces the magnitude of the income shock by one third, from -7.3 to -4.9 percent,
while for the North region the buffering is of less than one fourth of the shock, which decreases from -10.1
to -7.7 percent (See Figure 14b).
Figure 16: Income impacts of household employment shocks and the Unemployment Insurance
(a) Effects of the pandemic and UI on household (b) Effects of the pandemic and UI on national household
income, by quintile, baseline scenario poverty, by region, baseline scenario
0% 0%
-2%
-2%
-4% -3,1%
-4%
-6% -4,6%
-5,6% -5,3% -4,2%
-6% -4,9%
-5,2% -5,3%
-8%
-8,2% -7,6% -6,4% -6,1% -5,9%
-10% -8,8% -8,9% -8% -6,9% -7,3%
-7,7% -7,7%
-10,5% -8,2%
-12% -11,1% -10%
-9,9% -10,1%
-14%
-13,9% -12%
-16% -14,9%
Q1 Q2 Q3 Q4 Q5 National
Shock (Baseline) Shock (Baseline) + UI Shock (Baseline) Shock (Baseline) + UI
Source: World Bank estimates based on BraSim microsimulation model.
Box 2. Monthly income shocks
A critical caveat of our analysis is that the results reported are primarily based on annualized
income. The assumption of perfect income smoothing over the year can obscure the severity of the short-
term impact of these income shocks. For instance, in our analysis, a negative shock of BRL 1200 BRL
in one month is translated into a BRL 100 loss per month through the whole year. Therefore, the 3-
months BRL 600 transfer, which amounts to BRL 1800 a year, is converted into a BRL 150 transfer per
month during the whole year of 2020. But in reality, households in the lowest income groups will on
average experience three months with higher than usual income during the onset of the pandemic (mostly
April through July, depending on enrollment date) as a result of the AE. After these transfers end, and if
employment remains weak, these same households will then experience a severe reduction in income.
Hence, to simulate the problem from the households’ perspective, we also estimated the monthly impact
of the crisis, i.e. the variation in income in the month the shock hits.29
29For simulating the monthly income, we removed the 13th salary and Abono Salarial from the annualized income. We then
simulate the pandemic shock and policies by (1) assuming a 100 percent income drop on those affected by the unemployment
shock; (2) adding the monthly unemployment insurance entitlement for those who have it; (3) and giving eligible people one
BRL 600 monthly payment of the Auxílio Emergencial.
18Figure 2.1: Monthly household income effects, Relative to their pre-pandemic income, the
baseline scenario month-after-shock income of the two bottom
0% quintiles would fall by 26 percent on average –
after taking into account unemployment
-5%
-5,1% insurance – and by 30 to 37 percent if we do not,
-10% -7,9% which is a plausible scenario given that the UI is
-10,1% -10,0%
-15% also temporary (See Figure 2.1). If we consider
-16,1%-17,3% -15,0% the Auxílio Emergencial, the situation improves
-20%
substantially. The AE can give the bottom three
-25%
-24,9% quintiles an average income boost of 78, 35 and
-30% -27,1% -26,3%
14 percent in the month of the shock, and can
-30,2%
-35% buffer three-quarters of the monthly losses for the
-40% -36,8% fourth quintile.
Q1 Q2 Q3 Q4 Q5 National
Shock Shock + UI
Source: World Bank estimates based on BraSim
microsimulation model.
The second line of defense against the COVID-19 pandemic’s mass destruction of employment are
the Government’s emergency mitigation measures. According to the microsimulations, the expansion
of the PBF will increase the income of these affected families but, overall, has only a marginal impact on
income. After the PBF extension, the income of the poorest 20 percent increases by 1.5 pp relative to its
level after the shock and unemployment protection are considered. The Auxilio Emergencial will have a
more significant impact on the poorest 40 percent. Assuming that the transfers are well disbursed to all
eligible individuals, the benefit would cover between 52.7 to 67.7 million workers at a cost of BRL 106 to
BRL 135 billion, which is equivalent to 1.6 to 2 percent of the projected GDP for 2020 (Box 3). Importantly,
we use the after-shock income to identify individuals who are eligible for the AE transfer.
Box 3. AE modelling through three different scenarios
According to the Auxilio Emergencial rules, to be a beneficiary, individuals must meet the following
requirements:
1) be over 18;
2) be unemployed or work as informal, contractor or as a microentrepreneur;
3) have family per capita income under ½ minimum salary or family total income under 3 minimum
salaries.
4) cannot be recipient of BPC, Unemployment Insurance, nor pensions.
5) earned less than BRL 28,559.70 in taxable income in 2018.
6) maximum of 2 benefits per household.
To simulate the program, we build three different scenarios. The first, used as the baseline for results in
this note, assumes perfect targeting and perfect compliance: all eligible people will receive the benefit
and that even incomes that the government cannot track would be declared as were declared in the
household survey (informal income, for example). The second estimates the impact of under-coverage
and assumes that 50 percent of all eligible people who are not already Bolsa Familia beneficiaries will
not gain access to the benefit. The third, here called Flexible, relaxes rules 3) and 6) in which the
19You can also read