COVID-19 IMPACT AND RECOVERY - January 5, 2021 - Montgomery County Government
←
→
Page content transcription
If your browser does not render page correctly, please read the page content below

COVID-19 IMPACT AND RECOVERY
        January 5, 2021
RESPONSE: EMERGENCY
ASSISTANCE & DEMAND
COVID-19 RENTAL RELIEF UPDATE: WEEK OF DEC 27–JAN 2
               APPLICATIONS BY WEEK                          APPLICANT HOUSEHOLD CHARACTERISTICS
            11,407 total applications
          (excluding 3,322 duplicate applications in grey)

           APPLICANT CHARACTERISTICS
•   48% matched with landlord application
•   53% unemployed past 90 days
•   30% needed to care for self/others
•   24% self-reported receiving an eviction notice
•   Median household income: $20,962
COVID-19 RENTAL RELIEF UPDATE: WEEK OF DEC 27–JAN 2
APPLICATION PROCESSING APPROVALS
Total Approved Payments: $43.2M
Denials are primarily (4-day workweek in light blue)
due to applicants not
2.1M
2.1M
2.1M
2.0M
1.9M
1.8M
1.7M
having a covid
1.7M
1.7M
1.7M
1.6M
1.5M
1.5M
1.5M
1.4M
1.4M
1.4M
1.3M
financial hardship,
1.2M
1.2M
1.1M
1.1M
1.1M
1.1M
1.1M
1.1M
1.1M
0.9M
0.8M
seeking mortgage
0.8M
support, exceeding
0.3M
income requirements
or not demonstrating
10-11
10-18
10-25
11-15
11-22
11-29
12-13
12-20
12-27
5-31
6-14
6-21
6-28
7-12
7-19
7-26
8-16
8-23
8-30
9-13
9-20
9-27
10-4
11-1
11-8
12-6
6-7
7-5
8-2
8-9
9-6
county residence.
Total Approved Households: 4,225
(4-day workweek in light blue)
ALL-TIME TOTALS
210
202
198
198
186
182
179
165
164
164
153
152
146
143
The current round of funding adds to two previous
137
134
132
130
122
122
119
111
110
109
109
100
rounds of COVID-19 assistance. In total, the Emergency
98
88
72
66
Rental Assistance Program has approved:
24
• $61.1M in payments
5-31
6-14
6-21
6-28
7-12
7-19
7-26
8-16
8-23
8-30
9-13
9-20
9-27
10-4
10-11
10-18
10-25
11-15
11-22
11-29
12-13
12-20
12-27
6-7
7-5
8-2
8-9
9-6
11-1
11-8
12-6
• 8,721 households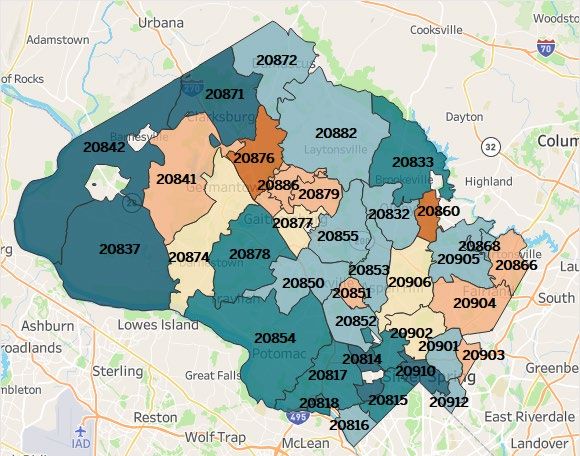
COVID-19 RENTAL RELIEF UPDATE: WEEK OF DEC 27–JAN 2
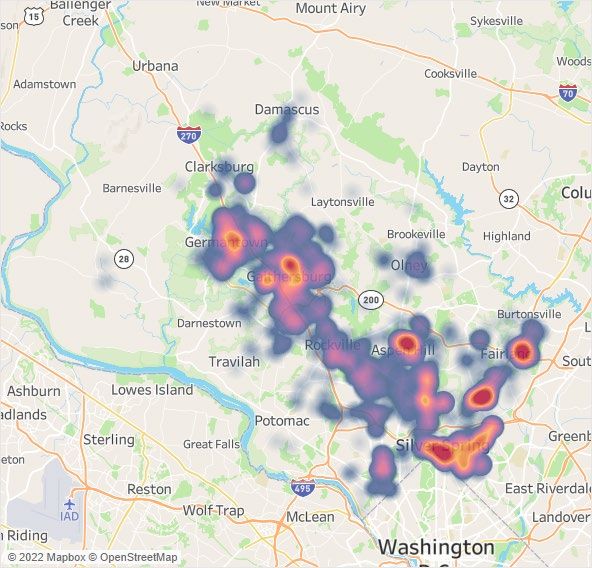
HEATMAP OF RECIPIENT HOUSEHOLDS RECIPIENT RACE/ETHNICITY
ADDITIONAL RECIPIENT CHARACTERISITICS
• Average client payment: $10.2K
• 64% of payments arrears; 36% prospective
• 47% of awarded households are in high-
need areas as defined by the Homeless
Prevention Index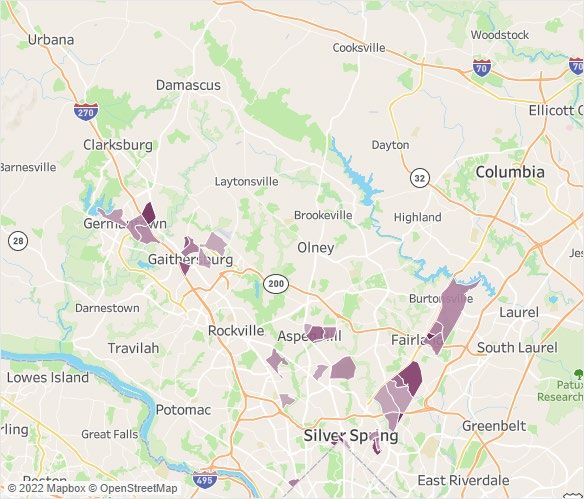
COVID-19 RENTAL RELIEF UPDATE: WEEK OF DEC 27–JAN 2
               DIRECT ERAP EXPENDITURES                                              STATE EXPENDITURES BY COUNTY
                                                                                                           As of 10.31.2021
              Award
                                                                            Montgomery
         $31.4M                                                          Prince George's                                                $14.8M
                                                                                                                                                      $20.4M

                                                  78%                           Wicomico                         $7.4M
                                                                             Washington                       $5.9M
     Current spending and                      OF FUNDS
                                                                           Baltimore City                  $4.5M
         encumbered                                                                  Cecil              $3.3M

         $24.6M                                                                   Charles
                                                                                    Carroll
                                                                                                        $3.1M
                                                                                                    $1.3M
                                                                               Worcester           $1.1M
                                                                                St. Mary's         $1.1M
                                                                                   Calvert         $1.0M
                STATE ERAP EXPENDITURES                                          Caroline          $1.0M
                                                                                    Talbot         $0.9M
              Award                                                              Allegany          $0.9M

          $28.1M                                                           Queen Anne's
                                                                                Somerset
                                                                                                  $0.6M
                                                                                                  $0.4M
                                                  95%                         Dorchester          $0.4M
                                                                                   Garrett       $0.3M
     Current spending and                      OF FUNDS
                                                                                     Kent        $0.1M
         encumbered                                                        Anne Arundel          $0.0M
          $26.7M                                                           Baltimore City
                                                                                Frederick
                                                                                                 $0.0M
                                                                                                 $0.0M

Note: Spending and percentages may shift as payments are reconciled.   Source: Maryland Department of Housing and Community Development, https://bit.ly/3DQSVZV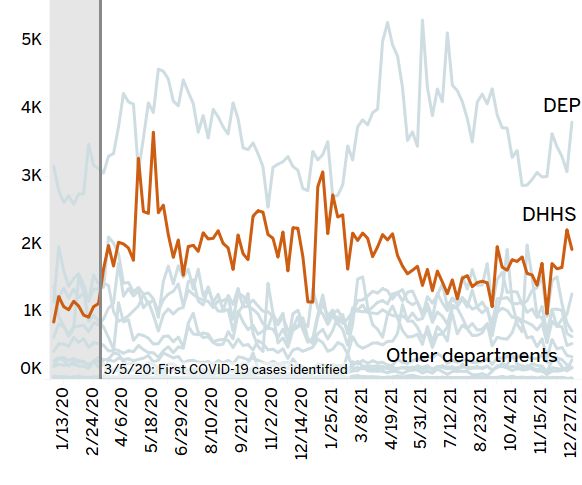
EVICTION TRACKER
NEW WRITS BY WEEK       • 859 residents scheduled for eviction
                          after July 19
                        • 46% of households with writ have
                          applied for emergency rental
                          assistance
                        • Context: fewer than 8% of writs
                          typically result in eviction

                        NOTE: Records on writs for eviction can
                        include commercial tenants as well as
                        multiple notices for a single household.
                        The stats above attempt to capture
                        unique residential households only, but it
                        is not always possible to make such
                        distinctions.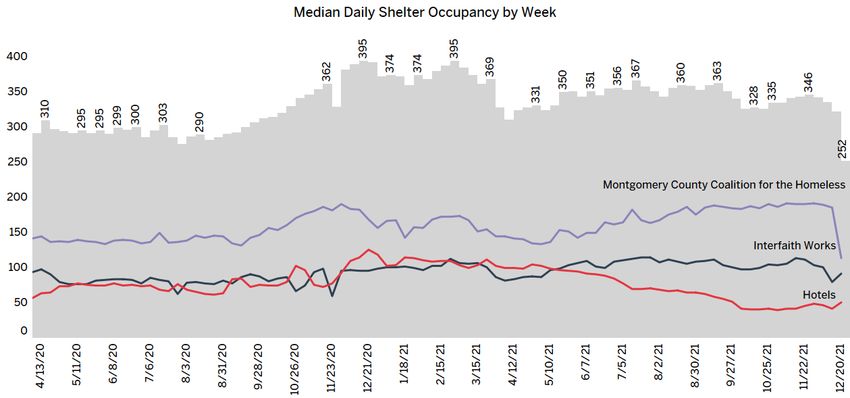
SHELTER OCCUPANCY

Data are updated weekly with a one-week delay.
MC311 WEEKLY CALL VOLUME: DHHS
       WEEKLY CALLS BY DEPARTMENT               WEEKLY CALLS FOR PUBLIC ASSISTANCE

1,921calls last week regarding DHHS services   41 calls last week regarding how to apply
                                                         for public assistance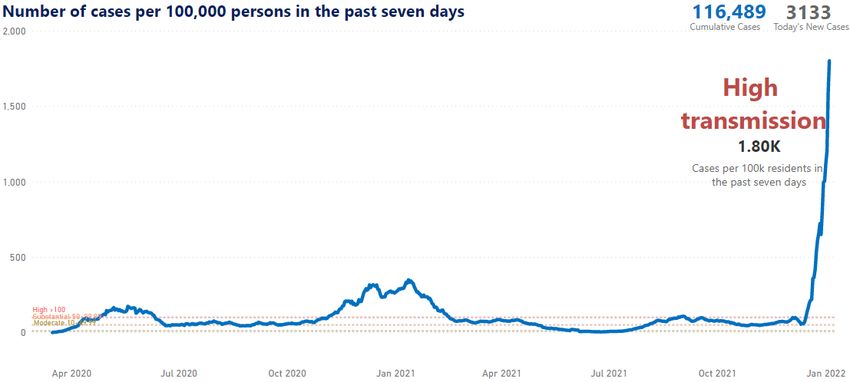
MC311 WEEKLY CALL VOLUME: DHHS
           PUBLIC HEALTH                  SERVICES TO END & PREVENT HOMELESSNESS
1,196 calls last week for Public Health         359 calls last week for SEPH
    86% related to COVID-19                      68% related to COVID-19
UNEMPLOYMENT RATES IN THE REGION
Fairfax County DC-Metro Region Montgomery County
12%
10.2
10%
9.4
8.6 8.6
8.2
8% 7.7
8.5
8.1
6.7
6.6 6.4
5.9
6% 6.7 5.7 5.7 5.7
5.8 4.9
5.6 5.5 5.6
4.3
5.0 5.0
4.8
4%
3.2 2.9 4.2
4.1
2.6 3.1 3.7
2.5 3.6 3.6
2% 2.7
2.3 2.2 2.2 2.3
2.0 1.9
0%
Nov '19
Mar '20
May '20
Nov '20
Mar '21
May '21
Nov '21
Jul '19
Jul '20
Jul '21
Jan '20
Jan '21
Sep '19
Sep '20
Sep '21COVID-19 CASES, VACCINATIONS, & TESTING
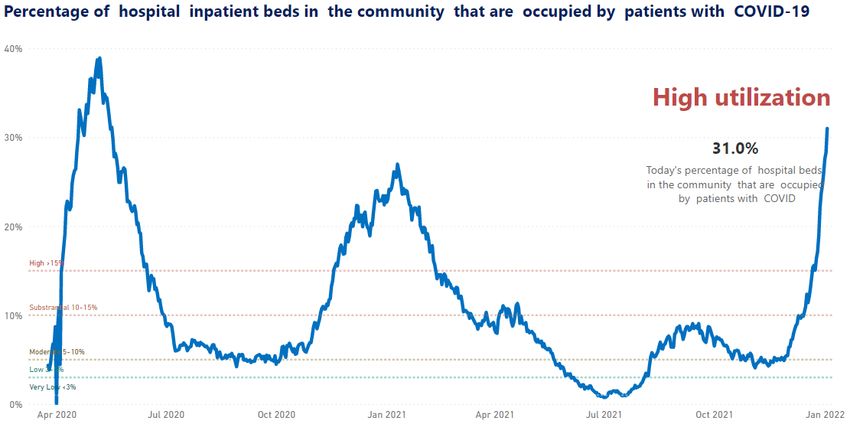
COVID-19 CASES & HOSPITALIZATIONS

As of 1/4/22, the database that provides Montgomery County DHHS with detailed case data
(including age, race/ethnicity, and vaccination status) is still not accessible due to the security
incident at MDH.

                CASES AS OF 1/4/22                                COVID-19 HOSPITAL BEDS AS OF 1/4/22

For real-time updates, visit the COVID-19 Surveillance Dashboard: https://www.montgomerycountymd.gov/covid19/data/
COVID-19 VACCINATIONS: TOTALS FROM CDC
TOTAL VACCINATIONS (AS OF 1/4/22) VACCINATIONS BY AGE GROUP
• ≥95%* of total population received at At Least 1 Fully Vaccinated
≥95% 94% ≥95% ≥95%
least ONE DOSE [N=1,023,734] 89% 84-93%
• 83% of total population received at least 53-57%
TWO DOSES (fully vaccinated) [N=874,872] 35-39%
• 40% of fully vaccinated population
received a BOOSTER/ADDITIONAL
DOSE [N=350,826] AGE 12+ AGE 5+ AGES 12-17 AGES 5-11
Chart reflects percent of total age group population that received doses. Percentage
estimates are reflected as ranges for ages 12-17 and ages 5-11 due to higher margins
* The CDC caps percentages at 95% to account for margins of error in data of error.
entry and population estimates.
• 45% of the fully vaccinated 18+ population
received a BOOSTER/ADDITONAL DOSE
[N=344,668]
NOTE: The CDC vaccination count includes Montgomery
County residents who received their shots in Maryland or • 67% of the fully vaccinated 65+ population
outside the state. It also includes vaccinations administered received a BOOSTER/ADDITIONAL DOSE
in federal entities within Montgomery County. [N=112,898]COVID-19 VACCINATIONS: WEEKLY VOLUME
Due to technical issues with the Immunet database, weekly vaccination data includes vaccination administered
up to Friday, 12/24/21.
Week of December 18, grocery stores & pharmacies
VACCINATIONS BY TYPE
administered 60% of the week’s doses and DHHS
administered 20%.
FIRST DOSES BY AGE GROUP
Unlike the CDC vaccination data, data from Immunet only includes Montgomery County residents who were vaccinated in
Maryland. It does not include vaccinations administered at federal entities within the county.COVID-19 VACCINATIONS: GAPS
TRACTS WITH BELOW AVERAGE FIRST-DOSE RATES FIRST-DOSE RATES BY RACE/ETHNICITY
It is important to focus on the relative rates shown in the chart
below rather than the absolute rates due to underreported
race/ethnicity information in vaccination records.
Across the highlighted tracts above, 29% of the population is White non-
Hispanic, 27% is Black non-Hispanic, 28% is Hispanic, and 12% is Asian/Pacific
Islander.COVID-19 VACCINATIONS: PEDIATRIC VACCINATIONS
FIRST DOSES BY RACE/ETHNICITY VACCINATION RATES BY ZIP CODE
% of population % of 5-11 year olds who received first dose Vaccination rates among residents ages 5-14 are used as a proxy for pediatric
vaccination rates in the map below due to the availability of population
60%
estimates only for certain age categories. Zip codes with fewer than 100
41% residents ages 5-14 are excluded.
40% 34%
26%
20% 19% 18%
20% 13% 13%
8%10%
0%
Black or AA Hispanic Asian or PI White Other
Nearly 1% of vaccinated children identify as Native American; they are included in the “Other”
category. Approximately 6% of pediatric records do not contain race/ethnicity information.
PEDIATRIC VACCINE PROVIDERS
Montgomery County
Physicans'
Montgomery Offices DHHS, in partnership
County DHHS 31% with MCPS, and
40% physicians’ offices have
administered most
pediatric vaccinations in
Hospitals the county since FDA
2% Pharmacies &
Community Organizations Grocery Stores approval in late
2% 25% October.COUNTY GOVT COORDINATED TESTING & VACCINATIONS
DHHS-ADMINISTERED TESTING: 18,641 TESTS ADMINISTERED LAST WEEK
DHHS-ADMINISTERED VACCINATIONS: 6,116 DOSES ADMINISTERED LAST WEEK
14K 13K
12K
12K 11K
10K Pediatric second dose
10K 9K 9K
7K 7K Pediatric first dose
8K 7K
6K 5K Adult additional dose
4K Adult second dose
2K 2K 2K 1K 1K
1K 1K 1K
2K Adult first dose or single dose
0
7/6
7/12
7/19
7/26
8/2
8/9
8/16
8/23
8/30
9/6
9/13
9/20
9/27
10/4
10/11
10/18
10/25
11/1
11/8
11/15
11/22
11/29
12/6
12/13
12/20
12/27
Data are subject to retroactive changes.DATA SOURCES
This report aggregates data from several sources, some of which are publicly available. Nearly all
data are subject to retroactive changes.
• Rental assistance data is generated by DHHS each Sunday prior to the publication of this report.
• Data on evictions are provided by the Montgomery County Sheriff’s Office each Monday for the
week prior.
• Data on shelter occupancy are collected by DHHS weekly.
• MC311 data are downloaded weekly from DataMontgomery.
• Unemployment data are downloaded monthly from FRED.
• Case data are provided by Maryland Department of Health. Real-time data can be found on the
Montgomery County COVID-19 Surveillance Dashboard.
• Vaccine data are downloaded from the CDC website each Tuesday. Additional vaccine data are
provided by Maryland Department of Health.
• Data on county government coordinated testing and vaccinations are collected by DHHS daily.You can also read