COVID-19 and Implications for Automation - Politico
←
→
Page content transcription
If your browser does not render page correctly, please read the page content below
Staff Working Paper/Document de travail du personnel — 2021-25
Last updated: May 31, 2021

COVID-19 and
Implications for
Automation
by Alex Chernoff1 and Casey Warman2

1
 International Economic Analysis Department
Bank of Canada, Ottawa, Ontario, Canada K1A 0G9
2
 Department of Economics, Dalhousie University
and National Bureau of Economic Research

achernoff@bankofcanada.ca, warmanc@dal.ca

Bank of Canada staff working papers provide a forum for staff to publish work-in-progress research independently
from the Bank’s Governing Council. This research may support or challenge prevailing policy orthodoxy. Therefore, the
views expressed in this paper are solely those of the authors and may differ from official Bank of Canada views. No
responsibility for them should be attributed to the Bank.
ISSN 1701-9397                                                                               ©2021 Bank of Canada

Acknowledgements
We thank Geoffrey Dunbar and Ben Tomlin for helpful feedback. The American Community
Survey data comes from the IPUMS-USA, University of Minnesota, www.ipums.org (Ruggles et
al., 2020). The O_NET data is available at https://www.onetonline.org/. The automation
potential and viral transmission risk variables used in this paper constructed from the O_NET
are available from the authors.

                                              i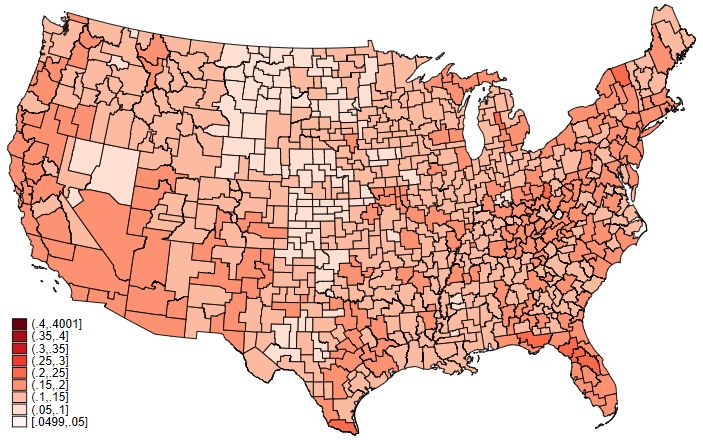
Abstract
COVID-19 may accelerate the automation of jobs as employers invest in technology to
safeguard against pandemics. We identify occupations that have high automation potential
and also exhibit a high risk of viral infection. We examine regional variation in terms of which
U.S. local labor markets are most at risk. Next, we outline the differential impacts COVID-19
may have on different demographic groups. We find that the highest-risk occupations in the
United States are those held by females with mid- to low wage and education levels. Using
comparable data for 25 other countries, we also find that women in this demographic are at
the highest risk internationally. We examine monthly employment data from the United States
and find that women in high-risk occupations experienced a larger initial decline in
employment and a weaker recovery during the pandemic.

Topics: Coronavirus disease (COVID-19), International topics, Labour markets
JEL codes: I14, I24, J15, J16, R12

                                               ii
1   Introduction

The COVID-19 crisis has caused severe economic loss along with record unemployment
rates. While some sectors will recover quickly, for other sectors COVID-19 will have long-
lasting effects. Specifically, COVID-19 and the threat of future pandemics have the potential
to accelerate the process of automation as employers substitute workers with computers and
robots, which are unaffected by pandemics. Autor (2015) notes that many forms of au-
tomation are complimentary to labor, and Bessen (2019) argues that automation may lead
to employment growth in some industries and declines in others. Therefore, it is likely that
COVID-19-induced technological change will increase productivity and wages in some oc-
cupations. However, workers in other occupations may be displaced and face large lifetime
earnings losses. It is therefore important to identify which jobs are at risk from the height-
ened push to automate jobs in response to the COVID-19 pandemic and the possibility of
future pandemics.
    We use information from the O∗ NET database to construct indexes of automation and
viral transmission risk. We identify U.S. local labor markets that may be most affected by the
potential push to automate jobs due to an overlap in viral transmission risk and automation
potential. We also examine the demographic groups in the U.S. and across 25 other countries
that may be vulnerable to automation due to infection transmission risk.
    Similar to previous research, we find that the American Heartland has a high concen-
tration of jobs with automation potential. We also find isolated local labor markets with
elevated risk across the South and along the West Coast. In contrast, viral transmission risk
is highest on the East Coast, although there is some overlap of transmission and automation
in the Heartland. Due to the lack of collocation between transmission risk and automation
potential, there does not appear to be a well-defined spatial pattern in terms of regions that
are highest in the potential risk of COVID-19-induced automation. Instead, we find impor-
tant demographic differences. We find that U.S. females are about twice as likely as males
to be in occupations that are at high risk of both COVID-19 transmission and automation.
When we further disaggregate by earnings, race, and education, we find that this risk is

                                              1
always higher for females relative to males in the same group. Women with low- to mid-
level wages and educational attainment in the U.S. stand out as being at highest risk of both
transmission and automation. Although automation in response to the pandemic is likely
an ongoing process, we look for early indications by examining monthly employment data
from the U.S. Consistent with this hypothesis, women in high-risk occupations experienced
a larger initial decline in employment and a weaker recovery during the pandemic.
   We also use data from the Programme for the International Assessment of Adult Com-
petencies (PIAAC) to estimate the joint risk of automation and viral transmission faced by
workers in 25 other countries. Women are again disproportionately represented in occupa-
tions with high automation potential and viral transmission risk. In all 26 countries in our
analysis, we find a greater fraction of females than males in these high-risk occupations. As
with the U.S., we find that occupations held by females with mid- to low-level wages and
education face the highest risk.
   The main contribution of our paper is the development and analysis of occupation-
specific indexes of automation and COVID-19 transmission risk. Studying these indexes
in tandem provides the first characterization of the demographic groups and local labor
markets that face joint risks from COVID-19 and automation. Our paper is related to a
well-established literature on automation.1 An important finding in this literature is that au-
tomation is most pervasive in the middle of the skills distribution in jobs featuring routine
tasks. Consistent with this literature, we find that the joint risk of automation and COVID-19
transmission is highest for occupations held by females with both low- to mid-level wages
and educational attainment. Although we are examining the enhanced joint impact of au-
tomation and viral transmission risks, the groups that we find are most susceptible are gen-
erally consistent with Blanas et al. (2020) who find that the fall in demand resulting from
automation is felt strongest by low- and medium-skill workers as well as females.
   Our work also contributes to the rapidly growing economic research on COVID-19.
Bridging the research on automation and COVID-19 is the idea that pandemic risk may
   1 See   Autor (2015) for a review of the literature on workplace automation.

                                                       2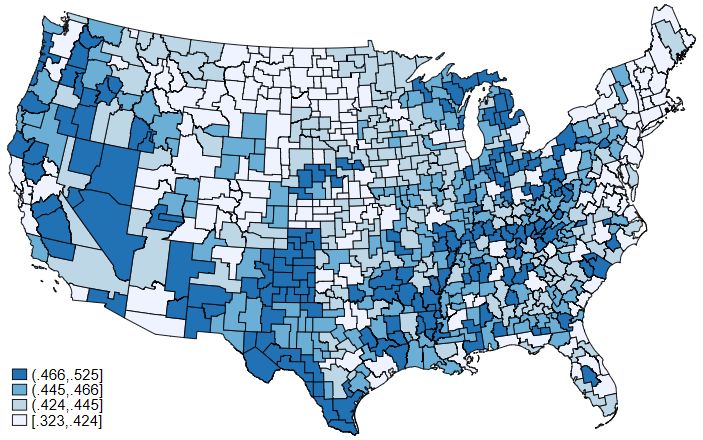
incentivize firms to automate tasks that are generally completed by workers.2 Autor and
Reynolds (2020) refer to this phenomenon as “automation forcing” and argue that the tech-
nologies adopted by firms during the COVID-19 pandemic will likely result in leaner staffing
in many industries post-pandemic. Leduc and Liu (2020) note that the uncertainty during a
pandemic may lower aggregate demand and curb investment; yet, their quantitative general
equilibrium analysis finds that a pandemic may nonetheless stimulate automation as firms
replace workers with technologies that are not susceptible to the virus. Some research on
COVID-19 has identified occupations with the highest risk of exposure,3 while other re-
search has estimated the fraction of jobs that can be completed without putting workers at
risk (Boeri et al., 2020) and the fraction that can be carried out from home (Dingel and
Neiman, 2020). Caselli et al. (2020) study the relationship between robots and COVID-19
risk in Italy. They find that industries that make greater use of robots (pre-COVID-19) face
lower risk from COVID-19 contagion. We focus more broadly on automation. Our ob-
jective also differs in that we aim to characterize the joint relationship between COVID-19
transmission risk and automation potential across U.S. local labor markets and across de-
mographic groups in the U.S. and internationally. As noted by Caselli et al. (2020), this
relationship is inherently endogenous and our objective is to characterize the correlations
between COVID-19 transmission risk and automation potential, using carefully constructed
indexes, which we hope will be useful for future work on this topic.

2    Data and Viral Transmission Risk and Automation Indexes

We use the O∗ NET Database to create measures of an occupation’s risk of viral transmission
as well as the degree to which it can be automated.4 There are several important consider-
ations when constructing a meaningful index. First, we need to decide which variables to
include and how to aggregate the variables. Our index of an occupation’s risk of viral trans-
    2 While  COVID-19 and the threat of future pandemics may accelerate automation, the economic recession
caused by COVID-19 may also increase automation. Hershbein and Kahn (2018) argue that the Great Reces-
sion accelerated the routine-biased technological change, while Jaimovich and Siu (2020) find that over the
past 35 years, almost all the losses in routine occupations occurred during economic downturns.
     3 For Canada, Baylis et al. (2020) developed a tool to determine the degree to which each occupation is at

risk of viral transmission. They use the O∗ NET to consider the characteristics of each occupation as well as
Census data to obtain the characteristics of workers in each occupation.
     4 We use version 24.3 of the O∗ NET.

                                                      3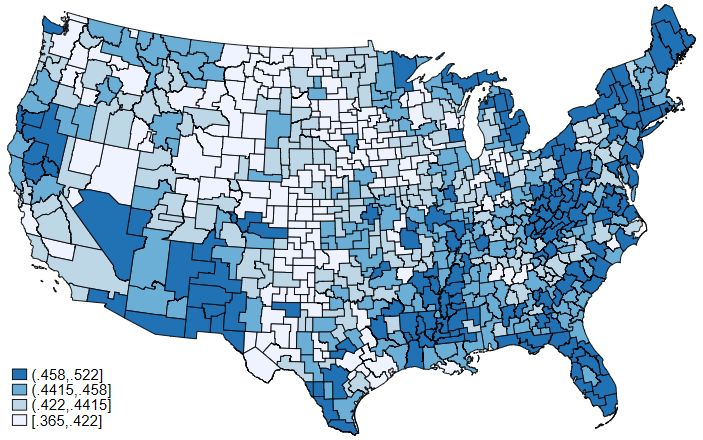
mission is constructed using the three O∗ NET variables physical proximity, face-to-face
discussions, and exposed to disease or infections as well as the average of the two O∗ NET
variables outdoors, exposed to weather and outdoors, under cover, which capture how often
an individual works outside.5
    For our main results, we follow a large literature such as Autor et al. (2003), Acemoglu
and Autor (2011) and others that use the O∗ NET to classify routine and non-routine vari-
ables. We construct the commonly used routine task-intensity measure to capture automa-
tion, which is estimated as follows:

                             RT Ii = RCi + RMi – NRAi – NRIi – NRMi ,                                          (1)

where RT Ii is the routine task intensity for the ith occupation.6 We add together the ag-
gregate routine cognitive (RC) and routine manual (RM) variables. We also subtract the
aggregate non-routine analytical (NRA), interpersonal (NRI) and manual variables (NRM).
We standardize each of these five O∗ NET variables,7 and provide a more detailed description
of these variables in Appendix A.8 We then construct Equation 1 and normalize the resulting
RT I index to be between zero and one and use this as our measure of how automatable an
occupation is.9
    To aggregate the variables used to create the viral transmission risk index, we pursue
    5 Physical  proximity is defined as the extent to which a job requires a worker to perform job tasks in
close physical proximity to other people. It includes the following values: “1. I don’t work near other people
(beyond 100 ft.),” “2. I work with others but not closely (e.g., private office),” “3. Slightly close (e.g., shared
office),” “4. Moderately close (at arm’s length),” “5. Very close (near touching).” The variable face-to-face
discussions is defined as how often workers have to have face-to-face discussions with individuals/team on
the job and the exposed to disease or infections variable is categorized by how often the job requires exposure
to disease/infections. Finally, the two outdoor variables capture how often the job requires working outdoors
and under cover (which could include a structure with a roof but no walls). Potential responses to these latter
four variables are as follows: “1. Never,” “2. Once a year or more but not every month,” “3. Once a month or
more but not every week,” “4. Once a week or more but not every day,” or “5. Every day.” For the two outdoor
variables, we reverse the order of these categories to capture the increasing risk of infection of working indoors.
See https://www.onetonline.org/ for more details.
     6 Frey and Osborne (2017) also provide a very useful “computerisable” index that we use to validate our

automation index.
     7 For standardizing, we readjust the given variable as follows: standardized variable = (X -
                                                                                                        i       i
mean(X))/std(X).
     8 See Mihaylov and Tijdens (2019) for an excellent discussion of the routine task-intensity measure and

the relevant literature.
     9 We normalize the index using the following equation: normalized index
                                                                                                   i = (indexi -
min(index))/(max(index) - min(index)).

                                                        4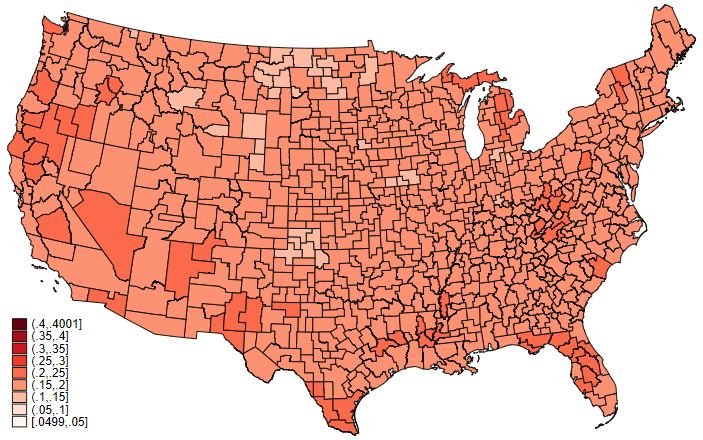
two popular methods in the literature. For our main results, we average the standardized
O∗ NET questions and then normalize the index to be between zero and one, as we did
with our RTI index. Our second method involves performing factor analysis using the U.S.
population from the pooled 2013-2017 ACS data as weights and then normalizing the index
in the same manner as in the first approach. We present the results obtained using the first
method, although our findings are not sensitive to this specification as the two approaches
yield indexes that are highly correlated.
    We match the risk of automation and the viral transmission risk indexes constructed
with the O∗ NET to the 2013-2017 American Community Survey (ACS).10 Unfortunately,
there is no perfect mapping between the 6-digit ACS occupation variable and the O∗ NET,
so we match the remaining occupations with fewer digits and average the variables over the
matching O∗ NET occupations. We restrict our analysis to employed workers and exclude
workers who are either in unpaid family businesses or in the military. We further restrict
the sample to workers between ages 18 and 65. We use these same sample restrictions and
conduct analysis with the January 2018 to February 2021 Current Population Survey (CPS)
to examine the initial impact on trends in employment for high- and low-risk jobs by sex.
For our international comparison, we use PIAAC which provides data that allows us to make
comparable estimates for 25 other countries. We introduce the PIAAC data in greater detail
in Section 4, prior to discussing these estimates.
    In Figure 1 we plot our indexes of viral transmission risk and automation potential. The
high-risk occupations are defined as those with both indexes being greater than or equal to
0.5 and are indicated by red squares. We further differentiate between low-risk occupations
(green triangles) if they are below 0.5 on both indexes and medium-risk occupations (orange
circles) if they have an index value greater than or equal to 0.5 for only one of the two
indexes. The medium-risk occupations can be thought of as containing two categories. First
   10 Although  the 2018 ACS is available, it uses the 2018 Standard Occupational Classification (SOC)
whereas our O∗ NET indexes are based on the 2010 SOC. This limits our ability to merge our indexes to
the 2018 data. In addition, using the 2013-2017 ACS provides a larger sample, which is beneficial for our
analysis of local labor markets as several of the commuting zones we analyze are sparsely populated. How-
ever, we also completed our analysis using the 2018 ACS and obtained similar results to the findings presented
below.

                                                      5
are occupations with high viral transmission risk but a low degree of automation potential.
The second category are occupations with low viral transmission risk but high automation
potential.
    From the scatter plot we see that only 15.3% of the (unweighted) occupations are cate-
gorized as high risk (red squares). Although each index has a larger fraction of occupations
with values of 0.5 or higher (46.3% for automation potential and 34.3% for transmission
risk), the fraction of occupations where both indexes are above this threshold is much
smaller. Based on our ACS sample, workers in high-risk occupations represent around
17.9% of the employed U.S. population for the period 2013 to 2017. Roughly 34.7% of
occupations are designated in the low-risk group (green triangles), representing a little less
than 32% of the employed U.S. population during this period.
    To get a feel for the indexes, Table 1 shows a sample of occupations with their associ-
ated automation potential and viral transmission index values. We also include the number
of workers in each occupation to understand how important a given job is for the U.S. labor
force. The top half of the table includes the four highest and lowest ranked occupations
for each index. According to our automation index, “tire builders” is the occupation with
the highest automation potential. Dental occupations are shown to be the two riskiest jobs
for viral transmission, which is not surprising given that service providers in this profession
are required to work at face-to-face proximity to their clients. Health-related occupations
also make up the next two riskiest jobs.11 At the low end of the index are solitary pro-
fessions (meter readers) and professions that have very minimal exposure to diseases or
infections (tire builders). At the bottom of Table 1 we show “high-,” “medium-,” and “low-
risk” occupations, using the same definitions for these categories as were used in Figure 1.
Specifically, we show examples of the largest occupations in each of these three risk cate-
gories. The largest high-risk occupations are in service-related industries, including retail
   11 One  potential critique of our approach is that we do not consider access to personal protective equipment
used by essential workers, notably including medical and health care workers. However, even with additional
precautions in terms of using protective equipment, there is still heightened risk for these professionals. The
CDC reports that over 750 health care workers have lost their lives to COVID-19 and over 189,000 have been
infected as of October 26, 2020 (Centers for Disease Control and Prevention, 2020). However, these statistics
likely under-represent the actual number of infections and deaths, as the CDC notes that health care personnel
status is not reported for all respondents.

                                                       6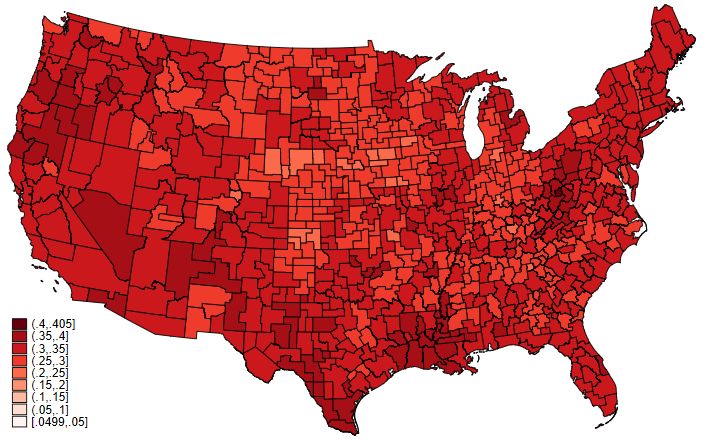
salespersons, secretaries and cashiers, which are jobs involving close contact with clients
and co-workers.
   Some of the high-risk occupations are only marginally classified as such on both indexes.
However, we present several robustness checks below that demonstrate that our results are
not dependent on the precise location of the high-risk cutoff. For a number of occupations, it
might be argued that the automation index values in Table 1 seemingly belie the automation
potential as being too high (e.g., dental hygienists). While we acknowledge that it is unlikely
that these occupations will be fully automated, it is conceivable that partial automation of
some of the tasks associated with these jobs could occur and may be accelerated because of
COVID-19.
   The medium-risk category provides a few interesting cases of professions that are either
high in automation potential and low in transmission risk (janitors and building cleaners), or
vice versa (elementary and middle school teachers and registered nurses).
   Despite there being several jobs with very low index scores in the low-risk category, the
largest occupations in terms of number of workers still have non-negligible index values
across both measures. The medium-risk occupations are similarly large and the minimum
index values are also only moderately low. This shows that most of the large occupations in
the U.S. entail at least some degree of automation potential and viral transmission risk. If
one considers the possibility of at least the partial automation of these jobs, a large fraction
of the U.S. labor force could be affected. Note also that the index distinguishes between
“elementary and middle school teachers” and “post-secondary teachers.” While both have
similar automation potential, the elementary and middle school teachers experience much
higher transmission risk, likely due to the higher degree of physical proximity that these
teachers have with their students.
   An issue noted in Blinder’s (2009) related research on the risk of occupations being
offshored is that the threshold used to define “jobs at risk” is subjective. This point, and
the fact that a high percentage of the U.S. population is employed in low-risk occupations
under our baseline specification, motivates us to also consider a lower threshold of 0.4 for

                                               7
the high-risk cutoff.12 This robustness check is further motivated by the observation that
COVID-19 may lower the threshold at which an employer may decide to automate a job as
firms invest in technology to replace workers that are forced to stay at home due to shelter-in-
place policies or illness.13 We also provide estimates where we characterize the occupations
that are at low risk of pandemic-induced automation. We define occupations as low risk if
both indexes are below a threshold of 0.5. This also allows us to look at this issue in terms
of jobs that are least at risk.
3 Results
Figure 2 (a) shows the fraction of individuals whose automation potential index is over
0.5 for each commuting zone (CZ) in the U.S.14 Similar to Muro et al. (2019), we find a
concentration of CZs with high automation potential in the American Heartland.15 However,
there is also a scattering of CZs with high automation potential across the South and along
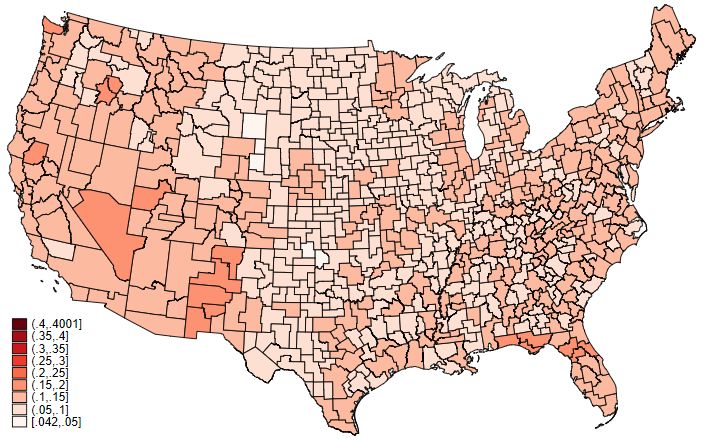
the West Coast. In contrast, Figure 2 (b) shows that CZs with high transmission risk are
more concentrated on the East Coast.
In Figure 3, we map the fraction of individuals with occupational automation potential
and transmission risk both greater than 0.5. The CZs with a relatively large fraction of
individuals in high-risk occupations are evenly distributed across the U.S., which reflects
the lack of collocation in the joint distribution of viral transmission risk and automation
potential. However, there is a relative void in high-risk occupations in the Midwest, where
automation potential and transmission risk are both relatively low for most CZs.
In Table 2, we report the mean automation and transmission risk indexes for females and
12 Inanother robustness check we considered a higher threshold of 0.6 for defining high-risk occupations.
Our findings are qualitatively similar under this alternative specification. As can be seen from Figure 1, it is
difficult to consider thresholds above 0.6 as there are very few occupations with both automation and trans-
mission risk above this value.
13 Some of these investments may involve partially automating jobs while other occupations may be fully
replaced by computers and robots. This also motivates the use of a lower threshold as jobs that have poten-
tial for partial automation will have a lower index value yet may nonetheless experience pandemic-induced
automation.
14 We reweight the Public Use Microdata Area (PUMA) to get commuting zones using the
weights provided by Peter McHenry (see https://wmpeople.wm.edu/site/page/pmchenry/
crosswalksbetweenpumasandczs).
15 We follow Muro et al. (2019) in using DeVol’s (2019) definition of the American Heartland as including
the following states: ND, MN, WI, MI, SD, IA, IL, IN, OH, NE, KS, MO, KY, OK, AR, TN, MS, AL, LA.
8males and further disaggregate by additional demographic characteristics. We also show
corresponding maps for both indexes ≥ 0.5 by sex in Figure 4, and then for both indexes ≥
0.5 by sex and education level in Figure 5.
Overall, the columns titled “Both ≥ 0.5” indicate that females are about twice as likely
as males to be in occupations that are at high risk of both COVID-19 transmission and
automation. This result cannot be explained by the preponderance of females in medical
professions. The row titled “Non-Medical” in Table 2 removes medical professions16 and
shows that females remain over twice as likely as males to have high occupational risk of
both COVID-19 transmission and automation.
The columns titled “Both ≥ 0.4” show the fraction of females and males whose au-
tomation and transmission risk indexes are both above 0.4. Using this lower threshold im-
plies classifying a much larger percentage of the U.S. population as high risk, and we again
see that females are approximately 31% more likely than males to be in high-risk occupa-
tions. This shows the robustness of the disparity between men and women to using a lower
threshold. It also addresses the critique that a lower threshold may be justified due to the
heightened incentive to automate resulting from the pandemic risk currently facing the U.S.
workforce.
Another way to examine this issue is to look for corroborating evidence when we flip
the analysis and look at workers in jobs least at risk. The columns titled “Both < 0.5” show
the fraction of females and males in occupations that are at low risk of both automation and
COVID-19 transmission. Males are much more likely than females to be in these low-risk
occupations. Together with the high-risk results, this indicates that females are also more
concentrated in medium-risk occupations.17 The relative concentration of males in low-risk
occupations partially explains why using alternative values for the high-risk threshold does
not change our main finding, which is that women are more likely than men to be employed
16 Medical professions are defined as occupations in the “healthcare practitioners and technical occupations”
and “healthcare support occupations” Standard Occupational Classification (SOC) major groups. These health
care occupations have a transmission risk of around 0.85 but only make up around 8.47% of our weighted
sample and so do not have much impact on the overall transmission risk.
17 Recall from Figure 1 that medium-risk occupations (orange circles) are defined as having only one of the
index values greater than or equal to 0.5.
9in high-risk occupations.
To better understand our main result, we further disaggregate the average index val-
ues for women and men across other demographic characteristics.18 We begin by showing
differences in automation and transmission risk by sex and race. Some differences are ap-
parent, including that occupations held by non-white individuals are at a slightly higher risk
of both automation and transmission. However, the racial differences are smaller than the
differences based on sex. Interestingly, for each racial group females are more likely to be
at high risk of both automation and transmission compared with males of the same race.
Next, we consider differences based on sex across low-, medium-, and high-paying oc-
cupations. We follow the OECD’s (2019) definition of low and high pay. Specifically, the
upper cutoff for lower pay is two-thirds of median state-level earnings and the lower thresh-
old for high pay is one and a half times the median state-level earnings. Medium-pay occu-
pations are defined as those paying between the low- and high-pay cutoffs. We find that the
occupations held by low- and mid-income earning individuals entail the highest risk. This
result holds for both sexes, although the differences are more stark for females than males.
Females at each income level are also more likely to be at high risk of both automation and
transmission as compared with males with the same average income level.
Table 2 also considers the risk associated with the occupations of males and females
across different educational attainment levels.19 For each level of educational attainment,
females are again at a higher risk of both transmission and automation. However, females
with low- and mid-level educational attainment (some post-secondary but less than a bach-
elor’s) stand out as the highest-risk sub-group. Figure 5 shows this geographically and il-
lustrates that the higher-risk occupations held by females with low- and mid-level education
are evenly distributed across CZs in the U.S.
We also see some notable differences along sex and education demographics for the low-
18 Inthe remainder of this section we mainly focus on the results for our baseline definition of “high risk,”
which is defined as an occupation having both indexes greater than or equal to 0.5. However, as can be seen
from Table 2, we find qualitatively similar results using the lower threshold of 0.4.
19 High school or less is defined as individuals with a high school diploma or GED, or an education level
below this. Some post-secondary but less than a bachelor’s includes individuals with some college to those
with an associate’s degree. Bachelor or higher includes a bachelor’s, master’s, and doctoral degrees, and
professional degrees beyond a bachelor’s.
10risk category (i.e., columns titled “Both indexes < 0.5” in Table 2). Low- and mid-level-
educated workers are the least likely to be in the low-risk category; this is particularly so
for females. Further, low- and mid-level-educated males are more concentrated in low-risk
occupations than females with higher levels of education. Adjusting the high-risk threshold
from 0.5 to 0.4, the low- and mid-level-educated females, in particular, are much more
concentrated in “high-risk” occupations. Together, the columns labelled “Both < 0.5” and
“Both ≥ 0.4” highlight that low- and mid-level-educated females are the demographic group
with the highest risk of pandemic-induced automation.
Finally, we consider differences in automation and transmission risk by sex and age in
the final rows of Table 2. While there is relatively little variation across age groups, for each
age group we find that women are more likely than men to be in occupations that have a
high risk of both automation and transmission.
To summarize, our main finding is that women are more likely than men to be in occupa-
tions that are at high risk of both COVID-19 transmission and automation. This finding adds
to an emerging literature that suggests that women are more exposed to loss of employment
as a result of the COVID-19 pandemic. While not related to automation per se, recent work
by Bartik et al. (2020) and Cajner et al. (2020) finds that the drop in employment at the
onset of the COVID-19 pandemic recession has been greater for women than for men. Our
results also indicate that the occupations held by women with low- to mid-level wages and
educational attainment face the highest risk of pandemic-induced automation, which links
our paper to the job polarization literature. Autor and Dorn (2013) argue that the growth
of in-person service occupations largely explains the employment and wage growth in the
lower tail of the skills distribution. Our analysis indicates that some of these service occu-
pations now face a confluence of automation and viral transmission risk. While these jobs
often require physical dexterity and interpersonal skills that are difficult to codify, the grow-
ing pressure on employers to adapt the production process in response to the pandemic risk
may spur technological changes that result in at least the partial automation of some of the
tasks in these occupations.
113.1 Trend in Employment is Worse for High-Risk Females in the U.S. during the
COVID-19 Crisis
The results in the preceding sections do not address whether the jobs we define as high
risk have actually been automated. The data required to answer this question are not yet
available. It may take time for jobs to be automated as forward-looking firms take into
consideration both the current risks and those associated with the possibility of future pan-
demics. Yet, we can get early insights by looking at recent CPS employment data during the
COVID-19 pandemic.
Figure 6 plots the percentage change in monthly employment relative to its pre-pandemic
2018–19 average values for females and males. For each sex, we differentiate between
high-risk occupations and those with at least one index below 0.5. For males, employment
in high-risk occupations largely followed a similar trend to other occupations throughout
the pandemic to date. In contrast, female employment in high-risk occupations incurred a
larger initial drop and experienced a weaker recovery. Although automation is one of many
possible factors that explains this trend, it is nonetheless consistent with our finding that
females are more likely than males to experience job losses from automation during the
COVID-19 pandemic.
4 International Comparisons
Our analysis highlights the U.S. occupations and demographic groups at greatest risk of
viral transmission and automation. In this section we broaden our focus to examine the
demographic profile of workers that face these risks in other countries, using data from
PIAAC.
PIAAC is a survey of adult cognitive and workplace skills, with approximately 5,000
adults being surveyed in each of the programme’s 40 participating countries. PIAAC is
designed to be valid for cross-cultural and international comparisons, with occupations clas-
sified using the International Standard Classification of Occupations 2008 (ISCO-08).
Our methodological approach involves using the Bureau of Labor Statistics’ (BLS) 2010
SOC to ISCO-08 crosswalk to convert our O∗ NET automation potential and transmission
12risk indexes to the ISCO-08 (4-digit) unit groups classification.20 We use the PIAAC Public
Use File, which unfortunately does not include ISCO-08 unit groups for a number of coun-
tries, notably the U.S. We therefore present the ACS-based demographic group averages
alongside the PIAAC-based means for the same groups.21
We use several filters to match our PIAAC sample as closely as possible to the ACS
sample. Specifically, we include only employed workers and exclude workers in unpaid
family businesses and workers younger than 18 or older than 65 years of age. We also drop
the PIAAC observations that do not report ISCO-08 unit groups as well as the ISCO-08
occupations that cannot be merged to the 2010 SOC. Applying these filters leaves us with a
sample of 86,740 adults from 25 different countries.22
Figure 7 plots country-specific fractions of populations that work in occupations with
automation potential and transmission risk indexes both greater than or equal to 0.5. The
country-specifics fraction of the population in these high-risk occupations range from 18%
in Ecuador to 29% in Japan.23 Figure 7 also shows that our findings regarding the higher risk
U.S. female workers face is also apparent internationally. In all 26 countries in our analysis,
we find a greater fraction of females than males in high-risk occupations.
Next, we further analyze demographic differences across different levels of wages and
educational attainment as well as different age cohorts. We specify these demographic
groups for our PIAAC sample in parallel with our U.S. ACS specifications, to the great-
est extent possible.
We measure wages by using PIAAC’s purchasing power parity (PPP) adjusted measure
of hourly earnings excluding bonuses.24 Mirroring our ACS specification, we follow the
20 BLS’s 2010 SOC to ISCO-08 crosswalk was downloaded from the url: https://www.bls.gov/soc/
soccrosswalks.htm. ISCO-08 has 436 unit groups, whereas 2010 SOC has 840 (6-digit) detailed occupa-
tions. For many-to-one mappings, we average the indexes across the SOC 2010 codes corresponding to each
ISCO code.
21 We acknowledge that differences in the level of aggregation between the 2010 SOC and ISCO-08 may
confound comparisons between the U.S. and PIAAC countries. Nevertheless, our results in Figures 7–10
indicate that our U.S. mean group estimates are of a comparable magnitude to the corresponding estimates for
other countries.
22 For the countries used in the analysis, the sample sizes range from 1,690 (Russia) to 4,955 (Peru) obser-
vations.
23 For this figure and all bar graphs in this section, we order by ranking the countries by the fraction of the
overall population in high-risk occupations.
24 PIAAC converts earnings into constant U.S. dollars using an OECD PPP measure.
13OECD (2019) in defining the three wage levels (low, medium and high), based on the low-
and high-wage cutoffs. Specifically, the upper cutoff for the lower wage is two-thirds of
the median PPP adjusted earnings, and the lower threshold for the high wage is one and a
half times the median PPP adjusted earnings.25 As is the case for the U.S., the high-wage
earners in our sample of PIAAC countries are the least likely to be in high-risk occupations.
Averaging across our PIAAC sample, low- and mid-wage earners are more likely to be
in high-risk occupations by 11 and 9 percentage points, respectively, compared to high-
wage earners. Figure 8 shows that for males and females alike, low- and mid-wage workers
typically face higher risk than their high-wage counterparts across the 26 countries in our
analysis.
Educational attainment levels are defined using the International Standard Classification
of Education (ISCED) classifications codes that are provided in PIAAC. We follow the same
approach in defining low-, medium- and high-level educational attainment levels as we did
with our ACS specification. Adults are classified as having low educational attainment if
they have obtained an upper secondary level of education or lower, mid-level educational at-
tainment if they have some post-secondary but less than a bachelor’s degree, and high-level
educational attainment if they have a bachelor’s degree or higher. In our PIAAC sample,
workers with low- and medium-level education are more likely to be in high-risk occupa-
tions, by a margin of 6 and 7 percentage points, respectively, compared to workers with
high-level educational attainment. Figure 9 also shows that the differential between workers
with high- and low-to-mid-level education is more stark for females than for males.
Finally, we consider differences between younger and older workers’ likelihoods of be-
ing in high-risk occupations.26 For our sample of PIAAC countries, the likelihood is higher
for younger workers by approximately 4 percentage points. As can be seen in Figure 10, the
risk differential between younger and older workers is greater for females relative to males,
on average, across our sample of PIAAC countries.
25 Incalculating median wage earnings, we exclude self-employed individuals and those working fewer
than 30 hours per week.
26 As with the ACS, we define younger workers as those between the ages of 18 and 49, and older workers
as being from 50 to 65 years of age.
145 Conclusion
We provide the first analysis of the demographic groups and U.S. local labor markets that
face joint risks from COVID-19 and automation. Geographically, with few exceptions we
find that regions with high automation potential largely do not overlap with areas of high
viral transmission risk. As a result, commuting zones where both automation potential and
transmission risk are high are diffusely distributed across the U.S. In contrast, we find a
concentration of risk among certain demographic groups. In particular, we find that fe-
males are about twice as likely as males to be in occupations that are at high risk of both
COVID-19 transmission and automation. Females with low- to mid-level wages and educa-
tional attainment face the highest joint risk from COVID-19 transmission and automation.
Internationally our analysis shows that the higher risk among women in this demographic is
pervasive across the 25 PIAAC countries in our sample.
The COVID-19 pandemic is forcing firms and workers to re-imagine the potential of
information technology in the workplace. More generally, Frey and Osborne (2017) point
out that automation is no longer limited to routine tasks, and Brynjolfsson and McAfee’s
(2014) observations regarding the remarkable pace of technological change highlight the
challenges of predicting the occupations that may be automated in the near future. These
observations motivate future research on the evolving relationship between automation and
viral transmission risk in response to COVID-19 and future pandemics.
15References
Acemoglu, Daron and David Autor. 2011. Skills, tasks and technologies: Implications
for employment and earnings. In Handbook of Labor Economics, Handbook of Labor
Economics, vol. 4, eds. O. Ashenfelter and D. Card, chap. 12. Elsevier, 1043–1171. URL
https://ideas.repec.org/h/eee/labchp/5-12.html.
Autor, David and Elisabeth B. Reynolds. 2020. The nature of work after the COVID crisis:
Too few low-wage jobs. Essay, Brookings.
Autor, David H. 2015. Why are there still so many jobs? The history and future of workplace
automation. Journal of Economic Perspectives 29, no. 3:3–30.
Autor, David H. and David Dorn. 2013. The growth of low-skill service jobs and the polar-
ization of the US labor market. American Economic Review 103, no. 5:1553–1597.
Autor, David H., Frank Levy, and Richard J. Murnane. 2003. The skill content of re-
cent technological change: An empirical exploration. The Quarterly Journal of Eco-
nomics 118, no. 4:1279–1333. URL https://ideas.repec.org/a/oup/qjecon/
v118y2003i4p1279-1333..html.
Bartik, Alexander W., Marianne Bertrand, Feng Ling, Jesse Rothstein, and Matthew Unrath.
2020. Measuring the labor market at the onset of the COVID-19 crisis. BPEA Conference
Draft .
Baylis, Patrick, Pierre-Loup Beauregard, Marie Connolly, Nicole Fortin, David A. Green,
Pablo Cubillos, Samuel Gyetvay, Catherine Haeck, Timea Molnar, Simard-Duplain
Gaëlle, Henry Siu, Maria teNyenhuis, and Casey Warman. 2020. The distribution of
COVID-19 related risks. Working Paper 27881, National Bureau of Economic Research.
URL http://www.nber.org/papers/w27881.
Bessen, James. 2019. Automation and jobs: when technology boosts employment. Eco-
nomic Policy 34, no. 100:589–626.
Blanas, Sotiris, Gino Gancia, and Sang Yoon (Tim) Lee. 2020. Who is afraid of ma-
chines? Economic Policy 34, no. 100:627–690. URL https://doi.org/10.1093/
epolic/eiaa005.
Blinder, Alan S. 2009. How many US jobs might be offshorable? World Economics 10,
no. 2:41–78.
Boeri, Tito, Alessandro Caiumi, and Marco Paccagnella. 2020. Mitigating the work-safety
trade-off. COVID Economics 2:60–66.
Brynjolfsson, Erik and Andrew McAfee. 2014. The second machine age: Work, progress,
and prosperity in a time of brilliant technologies. W.W. Norton Company, New York and
London.
Cajner, Tomaz, Leland D. Crane, Ryan A Decker, John Grigsby, Adrian Hamins-Puertolas,
Erik Hurst, Christopher Kurz, and Ahu Yildirmaz. 2020. The U.S. labor market during
the beginning of the pandemic recession. BPEA Conference Draft .
16Caselli, Mauro, Andrea Fracasso, and Silvio Traverso. 2020. Mitigation of risks of Covid-19
contagion and robotisation: Evidence from Italy. COVID Economics 17:174–188.
Centers for Disease Control and Prevention. 2020. Cases, data surveillance cases in
the U.S. URL https://www.cdc.gov/coronavirus/2019-ncov/cases-updates/
cases-in-us.html.
DeVol, Ross. 2019. Perspectives on defining the American heartland. Report, The Walton
Family Foundation.
Dingel, Jonathan I and Brent Neiman. 2020. How many jobs can be done at home? Working
Paper 26948, National Bureau of Economic Research. URL http://www.nber.org/
papers/w26948.
Flood, Sarah, Miriam King, Renae Rodgers, Steven Ruggles, and J. Robert Warren.
2020. Integrated Public Use Microdata Seriess, Current Population Survey: Version 8.0
[Machine-readable database]. IPUMS-USA, Minneapolis: University of Minnesota. URL
www.ipums.org.
Frey, Carl Benedikt and Michael A. Osborne. 2017. The future of employment: How
susceptible are jobs to computerisation? Technological Forecasting and Social
Change 114:254–280. URL http://www.sciencedirect.com/science/article/
pii/S0040162516302244.
Hershbein, Brad and Lisa B. Kahn. 2018. Do recessions accelerate routine-biased tech-
nological change? Evidence from vacancy postings. American Economic Review 108,
no. 7:1737–1772.
Jaimovich, Nir and Henry E. Siu. 2020. Job polarization and jobless recoveries. Review of
Economics and Statistics 102, no. 1:129–147.
Leduc, Sylvain and Zheng Liu. 2020. Can pandemic-induced job uncertainty stimulate
automation? Working Paper 2020-19, Federal Reserve Bank of San Francisco.
Mihaylov, Emil and Kea Tijdens. 2019. Measuring the Routine and Non-Routine Task
Content of 427 Four-Digit ISCO-08 Occupations. Tinbergen Institute Discussion Papers
19-035/IV, Tinbergen Institute. URL https://ideas.repec.org/p/tin/wpaper/
20190035.html.
Muro, Mark, Robert Maxim, and Jacob Whiton. 2019. Automation and artificial intelli-
gence: How machines are affecting people and places. Report, Brookings.
OECD. 2019. OECD employment outlook 2019. URL https://www.oecd-ilibrary.
org/content/publication/9ee00155-en.
Ruggles, Steven, Sarah Flood, Ronald Goeken, Josiah Grover, Erin Meyer, Jose Pacas, and
Matthew Sobek. 2020. Integrated Public Use Microdata Series: Version 10.0 [Machine-
readable database]. IPUMS-USA, Minneapolis: University of Minnesota. URL www.
ipums.org.
176 Tables
Table 1: Four highest and lowest automation potential and viral transmission risk occupations, and five largest
occupations by low-, medium- and high-risk categories
Occupation Automation Viral transmission Number of
potential risk workers
Automation potential
Four highest index values
Tire builders 1.000 0.000 14,534
Motion picture projectionists 0.899 0.255 3,168
Medical transcriptionists 0.898 0.321 41,737
Telephone operators 0.897 0.235 36,585
Four lowest index values
Recreational therapists 0.000 0.759 11,396
Directors, religious activities and education 0.011 0.483 62,656
First-line supervisors of non-retail sales 0.029 0.448 1,150,933
Emergency management directors 0.030 0.390 9,370
Viral transmission risk
Four highest index values
Dental hygienists 0.628 1.000 174,532
Dentists 0.342 0.991 147,945
Respiratory therapists 0.471 0.980 107,360
Nurse anesthetists 0.337 0.972 28,517
Four lowest index values
Tire builders 1.000 0.000 14,534
Meter readers, utilities 0.662 0.062 26,820
Refuse and recyclable material collectors 0.676 0.084 92,911
Logging workers 0.596 0.087 60,294
Joint risk of viral transmission and automation potential
Five largest high-risk occupations
Retail salespersons 0.533 0.574 3,160,827
Secretaries and administrative assistants 0.589 0.529 3,024,309
Cashiers 0.724 0.611 2,979,325
Stock clerks and order fillers 0.658 0.591 1,544,194
Personal care aides 0.547 0.620 1,255,453
Five largest medium-risk occupations
Elementary and middle school teachers 0.182 0.660 3,479,855
Registered nurses 0.281 0.929 2,980,075
First-Line supervisors of retail sales workers 0.370 0.588 2,975,820
Customer service representatives 0.412 0.643 2,600,696
Janitors and building cleaners 0.592 0.411 2,343,953
Five largest low-risk occupations
Driver/sales workers and truck drivers 0.489 0.275 3,279,329
Accountants and auditors 0.402 0.453 1,864,126
Post-secondary teachers 0.151 0.473 1,366,250
Sales representatives, wholesale and manufacturing 0.412 0.382 1,302,196
Grounds maintenance workers 0.480 0.255 1,245,202
Notes: Automation potential and transmission risk indexes are created from the O∗ NET and normalized to range between zero and one.
The number of workers in each occupation is estimated from the weighted counts from the 2013 to 2017 ACS. The sample is restricted to
individuals aged between age 18 and 65 years.
18Table 2: Mean automation potential and transmission risk indexes by demographic characteristics
Females Males
Automation Transmission Both Both Both Automation Transmission Both Both Both
Risk ≥0.5 ≥0.47 Figures
Figure 1: Automation potential versus transmission risk of occupation
1
Medical Transcriptionists
Tire Builders
Cashier
Dental Hygienists
.75
Automation potential
Meter Readers
.5
Dentist
.25
Economists Recreational Therapists
Elementary/Middle School Teachers
0
0 .25 .5 .75 1
Viral transmission risk
Low risk Medium risk High risk
Notes: Automation potential and transmission risk indexes are created from the O∗ NET Database and are normalized to range between
zero and one. High-risk occupations are defined as those with both indexes being greater than or equal to 0.5 and are indicated by the red
squares. Low-risk occupations are defined as those with both indexes below 0.5 and are indicated by the green triangles. Medium-risk
occupations are defined as those with an index value greater than or equal to 0.5 for only one of the two indexes and are indicated by the
orange circles.
20Figure 2: Index ≥ 0.5 by commuting zone
(a) Automation potential ≥ 0.5
(b) Transmission risk ≥ 0.5
Note: Automation potential and transmission risk indexes are created from the O∗ NET and normalized to range between zero and one.
Estimates use weighted counts from the 2013 to 2017 ACS. The sample is restricted to individuals aged between 18 and 65 years.
21Figure 3: Automation potential and transmission risk both ≥ 0.5
Note: Automation potential and transmission risk indexes are created from the O∗ NET and normalized to range between zero and one.
Estimates use weighted counts from the 2013 to 2017 ACS. The sample is restricted to individuals aged between 18 and 65 years.
22Figure 4: Automation potential and transmission risk both ≥ 0.5 by commuting zone, by sex
(a) Females
(b) Males
Note: Automation potential and transmission risk indexes are created from the O∗ NET and normalized to range between zero and one.
Estimates use weighted counts from the 2013 to 2017 ACS. The sample is restricted to individuals aged between 18 and 65 years.
23Figure 5: Automation potential and transmission risk both ≥ 0.5 by commuting zone, by education and sex
(a) High school or less, females (b) High school or less, males
(c) Post secondary < BA, females (d) Post secondary < BA, males
(e) BA or higher, females (f) BA or higher, males
Note: Darker red: more at risk. Automation potential and transmission risk indexes are created from the O∗ NET and normalized to range
between zero and one. Estimates use weighted counts from the 2013 to 2017 ACS. The sample is restricted to individuals aged between 18
and 65 years.
24Figure 6: Females in High-Risk Occupations: Larger Initial Decline in Employment and Weaker Recovery
Females Males
20
20
% change in employment from 2018−19 average
% change in employment from 2018−19 average
February 2020 February 2020
10
10
0
0
−10
−10
−20
−20
−30
−30
−40
−40
2018 2019 2020 2021 2018 2019 2020 2021
at least one .50 at least one .50
Note: Employment counts are calculated from the CPS.
Figure 7: Fractions of population with both indexes ≥0.5
Overall Females Males
Ecuador (ECU) ECU ECU
United Kingdom (GBR) GBR GBR
United States (USA) USA USA
Denmark (DNK) DNK DNK
New Zealand (NZL) NZL NZL
France (FRA) FRA FRA
Mexico (MEX) MEX MEX
Slovenia (SVN) SVN SVN
Israel (ISR) ISR ISR
Czech Republic (CZE) CZE CZE
Lithuania (LTU) LTU LTU
Hungary (HUN) HUN HUN
Poland (POL) POL POL
Chile (CHL) CHL CHL
Belgium (BEL) BEL BEL
Kazakhstan (KAZ) KAZ KAZ
Russian Federation (RUS) RUS RUS
Peru (PER) PER PER
Italy (ITA) ITA ITA
Slovak Republic (SVK) SVK SVK
Greece (GRC) GRC GRC
Turkey (TUR) TUR TUR
Korea (KOR) KOR KOR
Netherlands (NLD) NLD NLD
Spain (ESP) ESP ESP
Japan (JPN) JPN JPN
0 .1 .2 .3 .4 0 .1 .2 .3 .4 0 .1 .2 .3 .4
Notes: In this figure and all subsequent bar charts the horizontal bars measure the fraction of the population that work in occupations with
automation potential and transmission risk indexes both ≥ 0.5. U.S. values are identical to the corresponding mean values reported in
Table 2. Values for all other countries are country and demographic group-specific mean values, calculated after using the BLS’s 2010
SOC to the ISCO-08 crosswalk to convert our O∗ NET automation potential and transmission risk indexes to ISCO-08 classification.
25Figure 8: Fractions of population with both indexes >0.5, by wage level
Overall Females Males
Ecuador (ECU) ECU ECU
United Kingdom (GBR) GBR GBR
United States (USA) USA USA
Denmark (DNK) DNK DNK
New Zealand (NZL) NZL NZL
France (FRA) FRA FRA
Mexico (MEX) MEX MEX
Slovenia (SVN) SVN SVN
Israel (ISR) ISR ISR
Czech Republic (CZE) CZE CZE
Lithuania (LTU) LTU LTU
Poland (POL) POL POL
Chile (CHL) CHL CHL
Belgium (BEL) BEL BEL
Kazakhstan (KAZ) KAZ KAZ
Russian Federation (RUS) RUS RUS
Italy (ITA) ITA ITA
Slovak Republic (SVK) SVK SVK
Greece (GRC) GRC GRC
Korea (KOR) KOR KOR
Netherlands (NLD) NLD NLD
Spain (ESP) ESP ESP
Japan (JPN) JPN JPN
0 .1 .2 .3 .4 .5 .6 0 .1 .2 .3 .4 .5 .6 0 .1 .2 .3 .4 .5 .6
Low Medium High
Notes: The upper cutoff for low wage is two-thirds of the median earnings, and the lower threshold for high wage is one and a half times
the median earnings. Medium wage earners are defined as those with earnings between the low- and high-wage cutoffs. U.S. values are
identical to the corresponding mean values reported in Table 2. For all other countries, wage earnings data are obtained from PIAAC.
26Figure 9: Fractions of population with both indexes ≥0.5, by educational attainment level
Overall Females Males
Ecuador (ECU) ECU ECU
United Kingdom (GBR) GBR GBR
United States (USA) USA USA
Denmark (DNK) DNK DNK
New Zealand (NZL) NZL NZL
France (FRA) FRA FRA
Mexico (MEX) MEX MEX
Slovenia (SVN) SVN SVN
Israel (ISR) ISR ISR
Czech Republic (CZE) CZE CZE
Lithuania (LTU) LTU LTU
Hungary (HUN) HUN HUN
Poland (POL) POL POL
Chile (CHL) CHL CHL
Belgium (BEL) BEL BEL
Kazakhstan (KAZ) KAZ KAZ
Russian Federation (RUS) RUS RUS
Peru (PER) PER PER
Italy (ITA) ITA ITA
Slovak Republic (SVK) SVK SVK
Greece (GRC) GRC GRC
Turkey (TUR) TUR TUR
Korea (KOR) KOR KOR
Netherlands (NLD) NLD NLD
Spain (ESP) ESP ESP
Japan (JPN) JPN JPN
0 .1 .2 .3 .4 .5 0 .1 .2 .3 .4 .5 0 .1 .2 .3 .4 .5
Low Medium High
Notes: Low educational attainment is defined as high school or less, medium-level educational attainment includes individuals with some
post-secondary, but less than a bachelor’s degree, high educational attainment includes individuals with a bachelor’s degree or higher. U.S.
values are identical to the corresponding mean values reported in Table 2. For all other countries educational attainment levels are from
PIAAC.
27Figure 10: Fractions of population with both indexes ≥0.5, by age group
Overall Females Males
Ecuador (ECU) ECU ECU
United Kingdom (GBR) GBR GBR
United States (USA) USA USA
Denmark (DNK) DNK DNK
France (FRA) FRA FRA
Mexico (MEX) MEX MEX
Slovenia (SVN) SVN SVN
Israel (ISR) ISR ISR
Czech Republic (CZE) CZE CZE
Lithuania (LTU) LTU LTU
Poland (POL) POL POL
Chile (CHL) CHL CHL
Belgium (BEL) BEL BEL
Kazakhstan (KAZ) KAZ KAZ
Russian Federation (RUS) RUS RUS
Peru (PER) PER PER
Italy (ITA) ITA ITA
Slovak Republic (SVK) SVK SVK
Greece (GRC) GRC GRC
Turkey (TUR) TUR TUR
Korea (KOR) KOR KOR
Netherlands (NLD) NLD NLD
Spain (ESP) ESP ESP
Japan (JPN) JPN JPN
0 .1 .2 .3 .4 .5 0 .1 .2 .3 .4 .5 0 .1 .2 .3 .4 .5
18−49 50−65
Notes: U.S. values are identical to the corresponding mean values reported in Table 2. For all other countries, data are obtained from
PIAAC.
28Appendices
A Routine task-intensity O∗ NET variables
1. Routine cognitive:importance of repeating the same tasks; importance of being exact
or accurate; (reverse of) structured versus unstructured work.
2. Routine manual: pace determined by speed of equipment; controlling machines and
processes; spend time making repetitive motions.
3. Non-routine analytical: analyzing data or information; thinking creatively; interpret-
ing the meaning of information for others.
4. Non-routine cognitive: establishing and maintaining interpersonal relationships, guid-
ing, directing and motivating subordinates, coaching and developing others.
5. Non-routine manual: operating vehicles, mechanized devices, or equipment; spend
time using hands to handle, control or feel objects, tools or controls; manual dexterity
and spatial orientation.
29You can also read