Coupled nuclear and electron dynamics in the vicinity of a conical intersection
←
→
Page content transcription
If your browser does not render page correctly, please read the page content below
Coupled nuclear and electron dynamics in the vicinity of a conical
                                                   intersection
                                                            Thomas Schnappinger and Regina de Vivie-Riedle
                                                            Department of Chemistry, LMU Munich, Germany, D-81377 Munich, Germany

                                                            (Dated: 1 March 2021)
                                                            Ultrafast optical techniques allow to study ultrafast molecular dynamics involving both nuclear and electronic motion.
                                                            To support interpretation, theoretical approaches are needed that can describe both the nuclear and electron dynamics.
arXiv:2102.13547v1 [physics.comp-ph] 26 Feb 2021

                                                            Hence, we revisit and expand our ansatz for the coupled description of the nuclear and electron dynamics in molecular
                                                            systems (NEMol). In this purely quantum mechanical ansatz the quantum-dynamical description of the nuclear motion
                                                            is combined with the calculation of the electron dynamics in the eigenfunction basis. The NEMol ansatz is applied
                                                            to simulate the coupled dynamics of the molecule NO2 in the vicinity of a conical intersection (CoIn) with a special
                                                            focus on the coherent electron dynamics induced by the non-adiabatic coupling. Furthermore, we aim to control the
                                                            dynamics of the system when passing the CoIn. The control scheme relies on the carrier envelope phase (CEP) of a
                                                            few-cycle IR pulse. The laser pulse influences both the movement of the nuclei and the electrons during the population
                                                            transfer through the CoIn.

                                                   I.   INTRODUCTION                                                  molecular systems and should not be neglected in no cases.
                                                                                                                      This decoherence causes the electronic wavepackets to exist
                                                                                                                      only for short time scales24 . For small systems like H2 + or D2 +
                                                      The continuous development of attosecond laser pulses           a full quantum treatment of the coupled electron and nuclear
                                                   enables spectroscopic techniques which allow the time re-          dynamics is possible26. Beyond these three particle problems
                                                   solved investigations of ultrafast photo-initiated processes in    there are computationally very demanding methods available
                                                   atoms, molecules and solids. Nowadays it is possible to            based on a multi-configurational ansatz27 or on the coupled
                                                   study electronic correlation and ultrafast molecular dynam-        description of nuclear and electronic flux28,29 . Further tech-
                                                   ics through pump-probe experiments1–7 . Within these exper-        niques are based on the coupled propagation of the nuclear
                                                   iments attosecond, broad-band pulses are used to generate          and electronic wavefunction on a single time-dependent po-
                                                   electron wavepackets in highly excited states of molecules,        tential energy surface30–33 . But for larger molecular sys-
                                                   leading to the discovery of effects such as electron local-        tems the main techniques used are mixed quantum classical
                                                   ization in diatomic molecules3,8 and, later, of purely elec-       representations34–37 . For example, the electron dynamics is
                                                   tronic charge migration in biological relevant molecules5–7 .      described using TD-DFT and the nuclear motion is consid-
                                                   To explain and interpret the observations of these experi-         ered using an Ehrenfest approach34,35 . But these methods do
                                                   ments, theoretical approaches are needed that can describe         not reflect the quantum nature of the nuclei which, however,
                                                   the dynamics of electrons in molecules. Most approaches            becomes important for ultrashort pulse excitation and non-
                                                   use time-dependent analogs of well-established quantum-            adiabatic transitions.
                                                   chemical methods like time-dependent Hartree-Fock the-                In this paper we want to revisit and expand an ansatz for
                                                   ory (TD-HF)9 or time-dependent density-functional theory           the coupled description of the nuclear and electron dynam-
                                                   (TD-DFT)10 . Furthermore, time-dependent post-Hartree-             ics in molecular systems8,38,39 (shortened NEMol) developed
                                                   Fock methods like time-dependent configuration-interaction         in our group. It is based on electronic structure calculations
                                                   (TD-CI)11,12 , time-dependent coupled-cluster (TD-CC)13,14         as well as nuclear quantum dynamics. In its initial formu-
                                                   and multi-configuration time-dependent Hartree-Fock15 are          lation the electronic wavefunctions are represented as Slater
                                                   available for the correlated description of electron dynamics      determinants and propagated in the eigenstate basis. The cou-
                                                   in molecular systems. In other theoretical approaches the          pling of the nuclear motion to the electron motion is incor-
                                                   electronic wavefunction is propagated directly in time, with       porated explicitly through the nuclear wavepacket motion as
                                                   the help of Green’s function16 or in the basis of molecular        well as through a coherence term with contributions from the
                                                   orbitals17 . All these theories focus on the evolution of the      nuclear and electronic wavefunctions. Compared to the simi-
                                                   electronic subsystem, driven by electronic correlation18,19 and    lar approaches30–33 , the feedback of the electron motion to the
                                                   predict long-lived coherences. The neglect of the nuclear          nuclear dynamics is less directly introduced by simulating the
                                                   motion is justified by the assumption that the dynamics of         nuclear dynamics on coupled potential energy surfaces (PES).
                                                   the electrons is much faster than the one of the heavier nu-       The central equation of the original NEMol ansatz8,38,39 re-
                                                   clei. This results in charge migration, an oscillatory motion of   lates the dynamics of the coupled one-electron density to the
                                                   electron density with frequencies defined by the energy gaps       temporal evolution of the expected value of the nuclear po-
                                                   among the states populated with the initial laser pulse. If the    sitions. In the first part of this work we want to generalize
                                                   states of the superposition are close together, the electron dy-   the NEMol ansatz by extending beyond this single geometry
                                                   namics becomes slow and therefor the nuclear motion can no         approximation. Therefore, we introduce the NEMol-grid in
                                                   longer be neglected. But as shown in numerous theoretical          order to represent the electron dynamics at multiple points on
                                                   works8,20–25 , nuclear motion in general causes decoherence in     the grid used for the nuclear wavepacket propagation. In the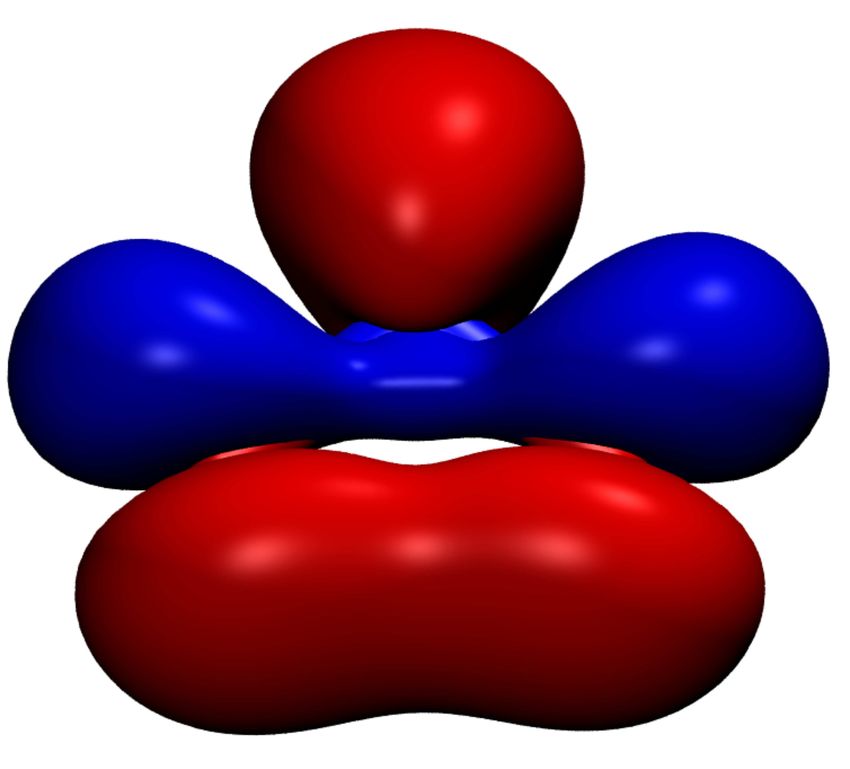
2

limit the NEMol-grid is equal to the grid representing the nu-         electronic wavefunction are calculated for one nuclear geom-
clear wavepacket, but in practice we choose a coarser one.             etry per time step which is defined by the time-dependent ex-
By means of a simple approximation it is possible to obtain a          pected value of the position hRi(t) (for definition see the ap-
condensed representation of time-dependent electron density            pendix). As long as we are focusing on situations with quite
in the one-electron-two-orbital (1e-2o) picture.                       localized wavepackets and/or one-dimensional systems8,38,39
   In the second part we want to explore the potential of our          this approximation works quite well. But in order to treat
NEMol ansatz. For this purpose, we consider a situation that           higher dimensional systems and more complex processes we
can generate coherent electron dynamics in excited states of           want to generalize the NEMol ansatz in this work. To ex-
molecules even without a laser pulse present. Such a scenario          tend the ansatz the integration over the full nuclear coordinate
occurs in the vicinity of a conical intersection (CoIn)40–44 .         space is split up in segments to improve the resolution of the
For this ubiquitous but nevertheless extraordinary points in           spatial dependence of the electronic phase term. For this pur-
a molecular system the adiabatic separation between nuclear            pose a second grid, the NEMol-grid, is introduced. The re-
and electronic motion breaks down40,45,46 and the electronic           sulting modified NEMol ansatz is described in the following
states involved become degenerate. Beside the creation of              section using exemplary a system with two nuclear coordi-
funnels for radiationless electronic transitions a coherent elec-      nates c1 and c2 . The complete two-dimensional coordinate
tron wavepacket is created whose dynamics approaches the               space is split up into M × L segments defined by their bound-
time scale of the nuclear dynamics. All these properties of            aries mmin , mmax and lmin , lmax . For each of these segments ml
CoIn’s are determined by the shape and size of the non-                                        j j (t) and the overlap terms α jk (t) are
                                                                       the population terms α ml                                ml

adiabatic coupling elements (NAC’s) and the topography of              calculated.
the vicinity. As a realistic molecular system which provides                                  Z mmax Z lmax
such a situation we have chosen the NO2 molecule. After                        α ml                           χ ∗j (R,t)χk (R,t)dc1 dc2 .     (3)
                                                                                 jk (t) =
excitation into the first excited state a CoIn enables an ultra-                               mmin    lmin
fast non-adiabatic transition back to the ground state within
less than 100 fs. This fast relaxation as well as the photo-           The sum of these segment terms results in the corresponding
physics of NO2 in general have been widely explored both               total population and overlap.
theoretically47–59 and experimentally56,60–67 . Beside the free                 M    L
relaxation of NO2 we also studied the influence on the coupled                 ∑ ∑ α mljk (t) =        χ j (R,t) χk (R,t)       = A jk (t).   (4)
                                                                                                                            R
electron dynamics when applying a few-cycle IR laser pulse in                  m=1 l=1
the vicinity of the CoIn. The variation of the carrier envelope
phase φ (CEP) of such a few-cycle pulse offers the possibil-           At the center Rml of each segment the state specific elec-
ity to steer electrons and nuclei56,57,59,64,68–76 . Similar to pre-   tronic densities, the one-electron transition densities and the
vious studies56,57,59,64 we apply this CEP-control-scheme to           eigenenergies are determined and with these values the cou-
NO2 and evaluate the CEP-dependence of the resulting cou-              pled one-electron density for each segment ρml (r,t; Rml ) is
pled nuclear and electron dynamics.                                    calculated.

                                                                          ρml (r,t; Rml ) = ∑ α ml
                                                                                                j j (t)ρ j j (r; Rml )
                                                                                                 j
II. COUPLED NUCLEAR AND ELECTRON DYNAMICS                                                                                                     (5)
                                                                                                                                 ml (t)
                                                                                                                             −iξ jk
(NEMOL)                                                                                      + ∑ 2Re α ml

                                                                                                       jk (t)ρ jk (r; Rml )e            ,
                                                                                               k6= j
   In the original NEMol ansatz8,38,39 the coupled one-                    with     ml
                                                                                  ξ jk (t)                        ml
                                                                                             = ∆E jk (Rml )∆t + ξ jk (t − ∆t).                (6)
electron density ρ (r,t; hRi(t)) is defined according to equa-
tion 1. For convenience the detailed derivation of this equation       It should be noted that for each segment the ∆E jk values and
can be found in the appendix adapted to the current notation.          the electron densities are no longer dependent on hRi(t). In
                                                                       contrast to the original NEMol ansatz, now many ∆E values
  ρ (r,t; hRi(t)) = ∑ A j j (t)ρ j j (r; hRi(t))                       are simultaneously contributing to the overall electron dynam-
                       j
                                                                (1)    ics. They are addressed, whenever the nuclear wavepacket is
                  + ∑ 2Re A jk (t)ρ jk (r; hRi(t))e−iξ jk (t) ,        located there. To obtain the total coupled electron density the

                     k6= j                                             individual contributions of each segment are summed up.
     with ξ jk (t) = ∆E jk (hRi(t))∆t + ξ jk (t − ∆t).          (2)                                      M     L
                                                                                         ρ (r,t; R) =    ∑ ∑ ρml (r,t; Rml ).                 (7)
The first summation consists of the state specific electronic                                           m=1 l=1
density ρ j j (r,t; hRi(t)) weighted with the corresponding time-
dependent population A j j (t). The second summation de-               This total coupled electron density ρ (r,t; R) describes the
fines the coherent contribution to the coupled electron density        electron dynamics coupled to multiple grid points on which
and consists of the time-dependent overlap A jk (t), the one-          the nuclear wavepacket is represented.
electron transition density ρ jk (r,t; hRi(t)) and its pure elec-         A second aspect that we would like to introduce is a fur-
tronic phase defined by the energy difference ∆E jk between            ther simplification. For clarity reasons it is here formulated
the electronic states involved. All quantities related to the          in terms of the original NEMol ansatz. We now consider a
3
system of two electronic states described by their electronic the coupled total electron density can be simplified by ex-
wavefunctions ϕ1 and ϕ2 . In the simplest case the wavefunc- pressing the densities and transition densities using the spin
tions of both states are described by two Slater determinants orbitals.
which only differ in the occupation of one spin orbital θ . Now
N−1 2
∑ |θ j (r; hRi(t))|2 + ∑ Akk (t)|θk (r; hRi(t))|2 + 2Re A12 (t)θ1 (r; hRi(t))θ2 (r; hRi(t))e−iξ12 (t) . (8)
ρ (r,t; hRi(t)) =
j=1 k=1
The summation at the beginning includes the densities of all mation about the simulation setup can be found in section II
equally occupied orbitals and is followed by the densities of of the SI.
the remaining two orbitals θ1 and θ2 weighted with the popu- In order to calculated the coupled electron density accord-
lations A11 (t) and A22 (t) The coherent part contains the prod- ing to equation 7 we define a NEMol-grid of 15 × 13 points
uct of the orbitals θ1 and θ2 . Within this simplification it is which are equally distributed between 1.34 rad to 2.86 rad
now possible to neglect the contributions of the equally oc- in the α -coordinate and between −0.33 Å to 0.33 Å in the
cupied orbitals in order to study the coupled electron dynam- b-coordinate. The necessary population- and overlap-terms
ics in an one-electron-two-orbital (1e-2o) picture. Under the are calculated for equal-spaced segments around these grid
above mentioned approximation this 1e-2o picture is a possi- points. To cover the entire PES the segments for the bound-
bility to examine the coherent part of the electron dynamics in ary grid points are larger. The transformation of the full
a very condensed way. This simplification can also be made wavepacket onto the NEMol-grid, the overlap terms and the
in combination with the NEMol-gird. resulting coherence terms are visualized in FIG. S6 (free prop-
agation) and FIG. S10 (propagation with laser pulse) in the
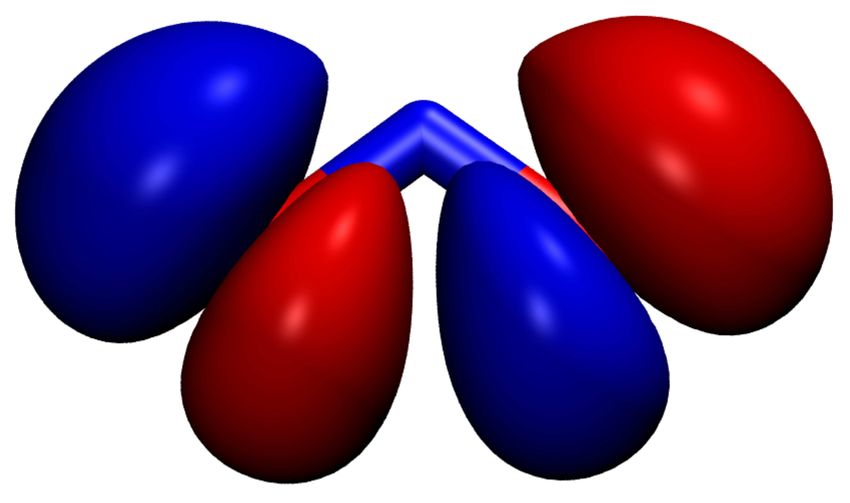
SI. The two active orbitals which are required to describe the
III. NO2 COUPLED DYNAMICS NEMol-dynamics in the one-electron-two-orbital (1e-2o) pic-
ture are shown in FIG. 2 at the optimized CoIn. The non-
binding orbital nN with contributions at the nitrogen atom is
We apply our extended NEMol approach to the non-
associated with the D1 state and the non-binding orbital nO
adiabatic dynamics of NO2 . In this molecule, a CoIn (de-
located only at the oxygen atoms is attributed to the D0 state.
picted in FIG. 1(b)) between the D1 and the D0 state enables
The energy difference ∆E between the D0 and D1 state for
a radiationless relaxation. The ultrafast non-adiabatic transi-
each grid point is shown in FIG. S4 of the SI.
tion takes less than 100 fs and has been widely explored both
theoretically47–59 and experimentally56,63–67 . First we analyze
the relaxation itself and next we apply a few-cycle IR laser
pulse to control the dynamics in the vicinity of the CoIn, sim- A. Free dynamics of NO2
ilar to previous studies56,57,59,64 . With our NEMol ansatz we
can study its influence on the motion of the nuclei and the To initiate the dynamics simulation in the D1 state we as-
electrons. sumed a delta pulse excitation. The temporal evolution of the
The nuclear dynamics is performed on the two-dimensional population of both states is shown in the upper panel of Fig. 3
adiabatic potential energy surfaces of the D1 and the D0 state and the dynamics of the nuclear wavepackets integrated over
shown in FIG. 1. The coordinates spanning the PES’s are the the α -coordinate, respectively, the b-coordinate are depicted
gradient difference and derivative coupling vectors defining in FIG. S5 for both surfaces. The nuclear wavepacket started
the branching space of the D1 /D0 -CoIn depicted in FIG. 1(b). in D1 reaches the vicinity of the CoIn after approximately
These two vectors correspond to the bending angle α and the 7 fs for the first time. While passing the coupling region in
asymmetric stretching coordinate b, defined as half the differ- the time interval from 7 fs to 15 fs the population of the elec-
ence between the two NO distances. The last internal degree tronic ground state increases to over 60 %. The part of the
of freedom, the symmetric stretch coordinate, is kept con- nuclear wavepacket remaining in the D1 state reaches its turn-
stant at the value of the optimized D1 /D0 -CoIn (1.267 Å). As ing point around 15 fs and then propagates backwards. This
shown by Richter et al.57 the population dynamics obtained leads to a second passage through the CoIn area and an in-
within this two-dimensional coordinate space is in very good crease of the population of the D0 state around 22 fs. The nu-
agreement with the full dimensional simulations by Arasaki clear wavepacket evolving on the lower adiabatic surface, re-
et al.56 . We performed our dynamics simulations in the adi- encounters the CoIn region later at around 30 fs. During this
abatic representation and the corresponding NAC’s between third passage, a substantial part of the population is transferred
D1 ans D0 are shown in FIG. 1(c). It should be mentioned that back into the excited state. After 35 fs the wavepacket is delo-
in previous studies56,57,59 the simulations were performed in calized on both surfaces and the population is nearly equal in
the diabatic representation and therefore small deviations may both states. Towards the end of the simulation at around 50 fs
occur due to the limitation of the grid spacing. Further infor- a fourth passage occurs. The wavepacket remains symmetri-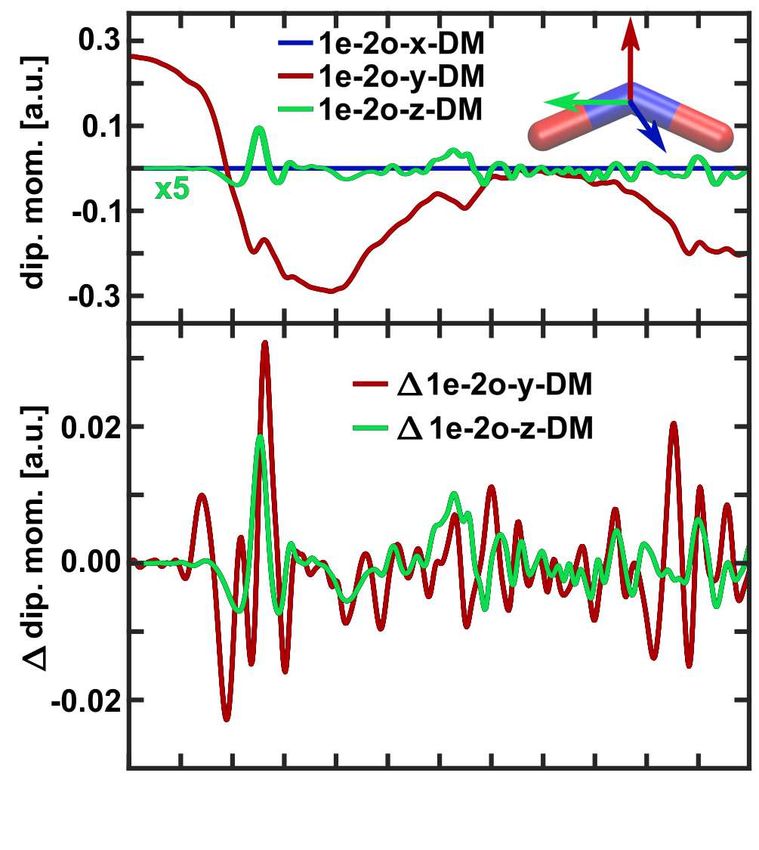
4

                                  0     1   2     3   4     5   6     7                               nN                                        nO

                                                                                                                 nN                 nN
  asym. coord b [Å]

                           0.3                            D0                         D1
                                                                                                                 nO                 nO
                                                                                                                      D1       D0
                           0.0
                                                                                             FIG. 2. Molecular orbital schema with the active electron indicated
                                                                                             in green and corresponding orbitals at the optimized CoIn. Orbitals
                           -0.3                                                              are shown with an isovalue of 0.05.
                                  1.5       2.0     2.5     1.5           2.0 2.5
                                                  bending angle           [rad]
                                                                                             time. For the wavepacket on the lower PES (see right sight
                                                          (a)
                                                                                             of FIG. S5(b) in the SI) the formation of a nodal structure for
                                                                                             b = 0.0 Å is clearly visible, which is a signature of destructive
                                                                          D1                 self-interference due to the geometric phase effect45,46,77 .
                           1.1                                                                  In the lower part of FIG. 3 snapshots of the electron den-
  energy [eV]

                                                                                             sity in the 1e-2o picture are shown. For a better visualiza-
                           0.9                                                               tion also the difference in density with respect to t = 0 fs is
                                                                                             depicted. The molecule is orientated in such a way that the
                                                                                             molecular plane is equivalent to the yz-plane and the center
                           0.7                        D0                                     of mass defines the origin of the laboratory frame. Therefore
                                                                                             the internal α -coordinate points to the same direction as the
                           as 0.1                                                            y-coordinate and the internal b-coordinate is associated with
                             ym                                                              the z-coordinate. The orientation of the molecule is shown
                                . c 0.0
                                   oo                                           1.90     ]   in the upper right corner of FIG. 4. In correspondence to the
                                      rd -0.1                        1.85           [rad     non-adiabatic transition from the D1 state to the D0 state, the
                                        b                                   g l e
                                                          1.80           an                  main feature of the electron dynamics is the loss of density at
                                          [Å
                                             ]               ben    ding
                                                                                             the nitrogen and the corresponding gain of density at the oxy-
                                                          (b)                                gen atoms. In addition, the change in the electron density at-
                                                                                             tributed to the motion of the nuclei (Born-Oppenheimer part)
                                  -3.0      -1.0      1.0           3.0                      is present. Due to the high symmetry of NO2 , the electron
                                                                                             density is mirror-symmetrical with respect to the xy-plane,
                                                                                             which is equivalent to the symmetric behaviour of the nuclear
                                                                                             wavepacket with respect to the b-coordinate.
                                                      /                            / b
      b [Å]

                            0.1                                                                 To analyze the electron dynamics we calculated the dipole
                                                                                           moment of the electron density within the 1e-2o picture. In the
                       0.0                                                                  upper panel of FIG. 4 the temporal evolution of its three com-

                                                                                           ponents is shown; for the molecular orientation see the upper
                                                                                           right corner of FIG. 4. To distinguish the Born-Oppenheimer
                                                                                             part of the dynamics from the coherent electron dynamics
                      a -0.1                                                                 the density was calculated once with the coherent part in-
                             1.80        1.85      1.90 1.80   1.85   1.90                   cluded and once without. For both quantities the respective
                                                  bending angle [rad]                        dipole moments were determined as well as their difference,
                                                          (c)                                hereinafter labeled as ∆ 1e-2o and shown in the lower panel
                                                                                             of FIG. 4. The active orbitals do not change along the x-
FIG. 1. (a) Adiabatic potential energy surfaces of the D0 state (left)                       coordinate and thus the 1e-2o-x-component of the dipole mo-
and D1 state (right) of NO2 . The CoIn is marked in white and the po-                        ment stays zero and is excluded from further discussions. The
sitions of the relevant minima in the two-dimensional subspace are                           1e-2o-y-component shows the largest values and the strongest
displayed in black.The two marked minima are only slightly higher                            changes over time. Its evolution follows the dynamics of
in energy than the fully optimized minimum structures shown in                               the population. In the initial 20 fs the first passage through
the SI. (b) The vicinity of the D1 /D0 -CoIn. (c) Non-adiabatic cou-                         the CoIn region occurs and simultaneously the value of the
pling elements between D1 ans D0 at the CoIn, α -element left and                            1e-2o-y-component changes from 0.3 a.u. to −0.3 a.u.. The
b-element right.                                                                             zero crossing occurs at 10 fs. For later times when dephasing
                                                                                             and partial recurrence of the nuclear wavepackets become im-
                                                                                             portant the y-component approaches zero at about 40 fs and
cal with respect to the b-coordinate for the whole simulation                                becomes negative thereafter again. These main features dis-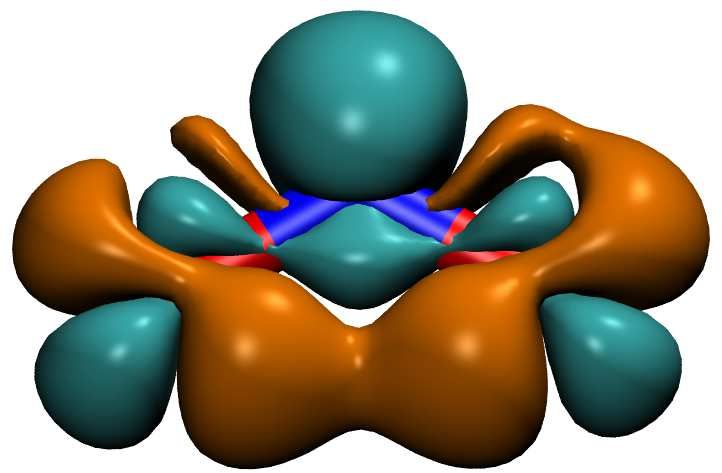
5

                                     1.0
                                                    61
                                     0.8
                                53
                                i/ 0.6
                                .-
                                ,+
                                *p '()
                                     $%&
                                                    D0
                                     0.0
                                           0      10           !          30          "#          50
                                                                      t789 :;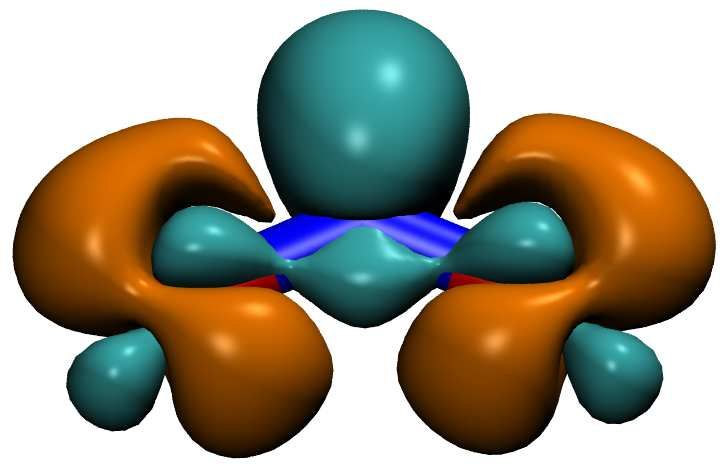
6
UT VWX |{
1.0
RSQ z 0.8
PO 0.1 yx ¡¢£¤ ¥
N wv
M u
LK -0.1 sr
JI oqm
d YZ[\ l
kj
h
n
0.0
]^_` 0.0 1.0
}~ ]
(a)
0.00
1.0 ÐÑÒÓÔ z
·¶ ÕÖ×ØÙ z
µ 0.8
´³ ÚÛÜÝ Þ
bcefg ²±
° ÇÈÉ
¯®
0 10 >? 30 40 50 «¬ ÊËÌ
@ABC EFGH ª
©¨
§ ÍÎÏ
FIG. 4. Field-free temporal evolution of the dipole moment compo- ¦
nents based on the electron density in the 1e-2o picture. Upper panel: 0.0
total value of all three components. The 1e-2o-z-component is en- 0.0 1.0 ÄÅÆ
hanced by a factor of five. The orientation of the molecule is shown ¸¹º»¼½¾¿À ÁÂÃ]
as inlay in the upper right corner. Lower panel: Difference between
(b)
the dipole moment components (∆ 1e-2o) one time calculated with
the coherence term included and once without it. Differences only
shown for the for y- and z-components. FIG. 5. The Fourier spectra of the y-component (a) and z-component
(b) of the dipole moment obtained using the ∆ 1e-2o-components
(blue), the 1e-2o-components (red) as well as the components calcu-
lated with the full density (green). All spectra are normalized to one
whereas for the z-component the initial pattern is still recog- individually.
nizable. This behaviour is further increased for the full density
(FIG. 5 green). For both components some peaks appear in all
three cases, especially in the energy range between 0.5 eV to
0.75 eV. They can be attributed to the coherent electronic dy-
namics and may also be experimentally observable.
Further information can be gained by extracting the time
when these frequencies occur. This allows us to connect them nal which extends over low-frequency components (0.1 eV to
to a specific movement in the system. Therefore, we per- 1.0 eV and has a lower intensity. Again considerably weaker
formed short-time Fourier transform spectra for the ∆ 1e-2o- peaks can be found around 20 fs to 25 fs (second passage) and
y and the ∆ 1e-2o-z components using a Gaussian window- after 50 fs (fourth passage). Thus each passage of the nuclear
ing function with a width of 180 data points corresponding wavepacket through the CoIn region induces coherent elec-
to a time of 18.14 fs. The resulting two spectrograms are tron dynamics, although not to the same extent for both com-
shown in FIG. 6. The ∆ 1e-2o-y spectrogram (left) shows ponents. The coherent dynamics is only short-lived for 5 fs
two main pairs of signals around 10 fs (0.5 eV to 1.7 eV) and to 7 fs and the intensity of its signal decreases with time. The
50 fs (0.7 eV to 1.7 eV, which correspond to the first and the highest intensities are observed for the first transition when the
fourth passage of the wavepacket through the CoIn region. localized initial nuclear wavepacket hits the CoIn. The sub-
The signals are most pronounced at the first passage and sig- sequent dephasing and branching of the nuclear wavepacket
nificantly attenuated at the fourth passage. There are consid- blurs the electronic coherence. In summary, we observe a
erably weaker peaks observable at 25 fs and 30 fs, which can short but recurring appearance of the coherent electron dy-
be attributed to the second and the third passage. Also the namics that is modulated by the nuclear wavepacket motion.
∆ 1e-2o-z spectrogram (right) shows two main signals. The In the following we focus on the first passage (10 fs) for apply-
first one appears around 10 fs (first passage through CoIn) ing a few-cycle IR pulse to influence the coupled dynamics of
and covers a frequency range from 0.5 eV to 1.7 eV. The NO2 , since here the largest electronic coherence in the field-
third passage around 30 fs can be attributed to the second sig- free case exists.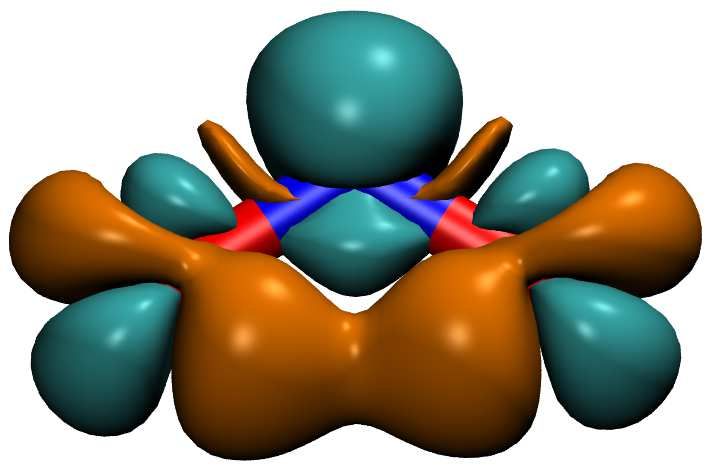
7

                                0.0                   0.2         0.4         0.6           0.8        1.0
                                                                                                          normalized intensity

                         2.0                                                                                                                  2.0
        frequency [eV]

                                                                                                                                                    frequency [eV]
                         1.0                                                                                                                  1.0

                         0.0                                                                                                                  0.0
                            0   10          20           30     40          50          0         10      20      30     40       50
                                                      time [fs]                                                time [fs]

FIG. 6. Short-time Fourier transform of the ∆ 1e-2o-y dipole moment component (left) and ∆ 1e-2o-z dipole moment component (right). The
Fourier spectrograms are normalized and a Gaussian windowing function with a width of 180 data points corresponding to a time of 18.14 fs
is used.

B.   Dynamics in the presence of a few-cycle IR pulse                                       within the dipole approximation, for details see section I in the
                                                                                            SI. We assume, that the electric component of the pulse is opti-
  Again a delta pulse excitation is used to initiate the dy-                                mally aligned with the transition dipole moment. The absolute
namics. With the appropriate time delay, a few-cycle IR laser                               value of the TDM is used, which is shown in FIG. S3(a) of the
pulse is applied to influence the first passage through the CoIn                            SI. As stated by Richter et al.57 already a moderate molecu-
and thereby the subsequent coupled dynamics. The used few-                                  lar alignment distribution is sufficient to observe the effect of
cycle pulse has a Gaussian shape and is defined as:                                         such a control pulse.
                                                                                               The evolution of the adiabatic populations influenced by the
                                                                                            few-cycle IR-field is shown in the upper panel of FIG. 7. The
                                                2
                                          t−t0
                                 −2
         E(t) = Emax · e     σ
                                                      · cos(ω0 (t − t0 ) + φ ),   (9)       related nuclear wavepacket dynamics on both surfaces inte-
                 FWHM                                                                       grated over the α -coordinate, respectively, the b-coordinate
       with σ = p
                                                                                            are depicted in FIG. S8 of the SI. During the first transition
                            .
                  2 log (2)
                                                                                            through the CoIn region (7 fs to 15 fs) a 50:50 population of
with the central frequency ω0 , the time zero t0 , the maximal                              both states is created. The interaction with the light pulse is re-
field amplitude Emax , the full width half maximum (FWHM)                                   flected in the small wriggles around 10 fs. The subsequent dy-
and the carrier envelope phase φ (CEP). The time zero t0 of                                 namics is comparable to the field-free case up to 30 fs. There-
the pulse, defining the position of its maximum, was chosen to                              after no clear passage through the CoIn region is observable.
match the time window when the wavepacket is located near                                   Thus the IR pulse induces a change in the nuclear dynamics
the CoIn (t0 = 10 fs). For this time the nuclear wavepacket                                 which persists beyond the pulse duration. As an important
is still very localized and the electronic coherence maximal.                               consequence, the nuclear motion becomes asymmetric with
The central frequency ω0 is chosen to be resonant with the ac-                              respect to the b-coordinate and the nuclear wavepacket even
tual energy gap ∆E= 0.76 eV between the electronic states.                                  loses its nodal structure (compare FIG. S5(b) and FIG. S8(b)
The remaining three pulse parameters, the field amplitude                                   both in the SI), which was also observed by Richter et al.57 .
Emax , the full width half maximum (FWHM) and the CEP                                       This asymmetry leads to the partly deviations from of the CoIn
φ , are set to Emax = 0.103 GV cm−1 (which corresponds to                                   region after 30 fs. On the lower panel of FIG. 7 snapshots of
a maximum intensity of 1.4 × 10¹³ W cm−2 ), FWHM = 8 fs                                     the electron density in the 1e-2o picture are shown. Again the
and φ = 0π . In comparison with the pulse parameters used                                   difference in density with respect to t = 0 fs is depicted. The
by Richter et al.57,59 all values are quite similar. Only our                               main features in the dynamics are quite similar to the field-
intensity is lower to stay in the range where the influence                                 free case. But like for the nuclear motion the dynamics of the
of the CEP pulse is mainly determined by the interplay of                                   electron density becomes asymmetric with respect to the xy-
the non-adiabatic transition and the light induced electronic                               plane i.e. the b-coordinate. This asymmetry persists after the
coherence76. By this we also ensure to stay below or at the                                 laser pulse is no longer active (for example see the snapshots
threshold of ionization. The light-matter interaction is treated                            at 30.0 fs). The oscillation of the electron density from the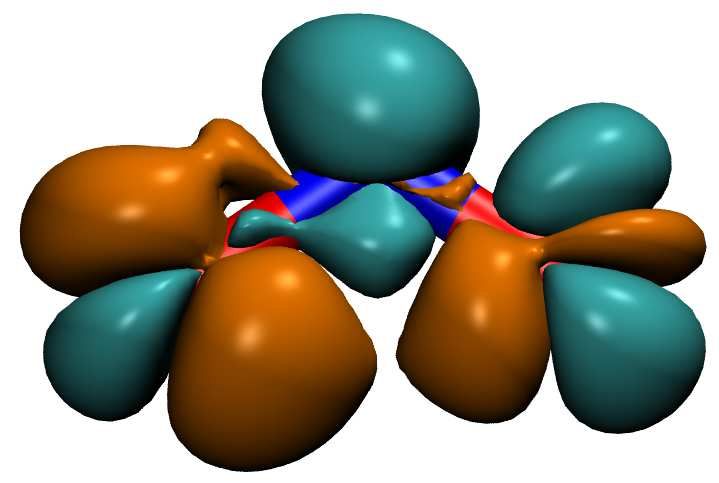
8

                                    1.0
                                                  1
                                    0.8

                               iÿ   0.6
                               þý
                               üû
                               úù 0.4
                                    ö÷ø
                                                  D0
                                    0.0
                                          0     10          ôõ          30          40          50
                                                                    t

                äåæ çè                           ßàá âã                            éêë ìí                           îïðñ òó

FIG. 7. Dynamics of NO2 in the presents of a few-cycle IR laser pulse. Upper panel: Populations of the D0 and D1 state as a function of
simulation time. Lower panel: Snapshots of the electron density in the 1e-2o picture and the density difference relative to the initial density
(green electron-loss, orange electron-gain). The isovalues used are 0.006 respectively ±0.002. The arrows on the left geometry (0.0 fs) indicate
the movement of the nuclei (main direction as bold and additional movement as dotted arrows).

right to the left oxygen is most prominently observable for the           components as well as for the dipole moment calculated
snapshots at 7.6 fs and 9.6 fs.                                           with the full density are again determined by Fourier trans-
   The oscillations of the electron density are again recorded            form. Their spectra are shown in FIG. 9. All frequencies
by the three dipole moment components, shown in the upper                 with an intensity larger than 0.1 are listed in TABLE S5 and
panel of FIG. 8. The coherent part of electron dynamics is                TABLE S6 of the SI. In both ∆ 1e-2o spectra frequencies up
visualized by the ∆ 1e-2o dipole moment components for the                to 4.0 eV appear, which are higher compared to the field-free
y- and z-coordinate in the lower panel. Again the 1e-2o-x-                case. As expected, the main peaks of the ∆ 1e-2o-y spectra
component stays zero for the whole simulation time. As the                (FIG. 9(a) blue) are in the same energy region as in the field-
few-cycle IR pulse induces the asymmetry mainly along the                 free case and only the ∆ 1e-2o z-spectrum (FIG. 9(b) blue
b-coordinate, the overall temporal evolution of the 1e-2o-y-              dotted line) shows differences. Its main peaks are shifted
component and the ∆ 1e-2o-y is similar to the field-free case.            to higher energies by roughly 0.7 eV. The laser pulse in-
The 1e-2o-z-component experiences the main changes. Dur-                  jects energy (0.76 eV) into the system, which influences the
ing the pulse strong and fast oscillations are observed with              momentum of the nuclear wavepacket and thereby the phase
an amplitude nearly thirty times larger than for the field-               of the overlap term (equation 1) which subsequently leads
free case. The oscillations stay up to ten times larger af-               to higher frequencies observed in the coherent electron dy-
ter the pulse. The superimposed slow oscillation with a pe-               namics. The correlation between the phase of the overlap
riod of about 20 fs can be assigned to the asymmetry in the               term, the electronic phase and the laser pulse is illustrated
nuclear motion. It does not appear for the ∆ 1e-2o-z com-                 in FIG. S11 of the SI for two individual grid points. The
ponent reflecting solely the coherent electron dynamics. By               frequencies for the y-component determined with the 1e-2o-
breaking the symmetry of the nuclear motion with the laser                density (FIG. 9(a) red) and the full-density (FIG. 9(a) green)
pulse the electronic coherence induced in the NO2 molecule                exhibit the same behaviour as in the field-free case. The high
is significantly larger. Again it is observable mainly in the z-          energy parts lose significantly intensity since the slower nu-
component, respectively, in the b-coordinate. During the light            clear dynamics (Born-Oppenheimer part) dominates this sig-
pulse it is now the coherent electron dynamics which is re-               nal. The dominance of the oscillating dipole moment origi-
sponsible for the largest changes in the dipole moment.                   nating from the coherent electron dynamics shows up in the
   The corresponding frequencies for the ∆ 1e-2o-, the 1e-2o-             nearly identical spectra for the 1e-2o-z (FIG. 9(b) red) and
9
1.0 1/345 6
0.8 789:; <
=>?@ A
0'(
)*+
n ,-.
0.0
0.0 1.0 2%& 3.0 4.0
f
c! "#$]
(a)
1.0 qrsuv z
STR wxyz{ z
QP 0.8 |}~
ON
M egh
LK
IJH jkl
G
EFC mop
B
FIG. 8. Temporal evolution of the dipole moment components (DM
0.0
comp) based on the electron density in the 1e-2o picture in the 0.0 1.0 abd 3.0 4.0
presents of a few-cycle IR pulse. Upper panel: total value of all UVWXYZ[\] ^_`]
three components. The orientation of the molecule is shown as inlay
in the middle. Lower panel: Difference between the dipole moment (b)
components one time calculated with the coherence term included
and once without it. Differences only shown for the for y- and z-DM FIG. 9. The Fourier spectra of the y-component (a) and z-component
comp. (b) of the dipole moment in the presents of a CEP-pulse (0.0π ) ob-
tained using the ∆ 1e-2o-components (blue), the 1e-2o-components
(red) as well as the components calculated with the full density
(green). All spectra are normalized to one individually.
∆ 1e-2o-z (FIG. 9(b) blue). For the z-spectra of the full-
density (FIG. 9(b) green) the high energy parts lose some in-
IV. WAVEFORM CONTROL OF MOLECULAR DYNAMICS
tensity but still more high energy contributions survive com-
pared to the field-free case.
In the last part we investigate the controllability of the
The results of the short-time Fourier transform for the nuclear and electron dynamics by the variation of the
∆ 1e-2o-y and the ∆ 1e-2o-z dipole moment component us- CEP φ of a few-cycle IR laser pulse. As shown in the
ing a Gaussian windowing function with a width of 180 literature68,70–72,74–76 the CEP control scheme offers the pos-
data points corresponding to a time of 18.14 fs are shown in sibility to steer electrons and nuclei in the ionization process
FIG. 10. Both spectrograms show a dominant signal which but also during the passage through a CoIn. The few-cycle IR
is attributed to the first passage through the CoIn region. pulse builds up a coherent electronic and nuclear wavepacket
The observable electron dynamics is significantly strength- with a well-defined phase-relationship controllable by the
ened by the simultaneous light pulse interaction. In case of the CEP. In the vicinity of a CoIn also the non-trivial geomet-
∆ 1e-2o-y spectrogram (left) some new features between 10 fs ric phase (Pancharatnam–Berry phase) is introduced45,46,77,78 .
to 30 fs appear. Due to the symmetry breaking of the nuclear The interplay of both phase-terms lead to an interference pro-
motion by the laser pulse, signals with very low frequencies cess when the CoIn is passed. The interference (constructive
as well as an extended signal around 1.0 eV appear. For the or destructive) can be manipulated by the CEP.
more affected ∆ 1e-2o-z component only one dominant peak
is observed. In summary, the presence of a few-cycle IR pulse
modifies the coupled dynamics by breaking the symmetry of
the nuclear motion and changing the temporal evolution of A. Control of the nuclear dynamics
the population. Both factors lead to a significant increase of
electronic coherence in the molecule especially along the z- As a first step we focus on the controllability of the nu-
coordinate (laboratory frame), respectively, the b-coordinate clear dynamics. Therefore, we define control objectives which
(internal frame). are directly accessible via the nuclear wavepacket and use the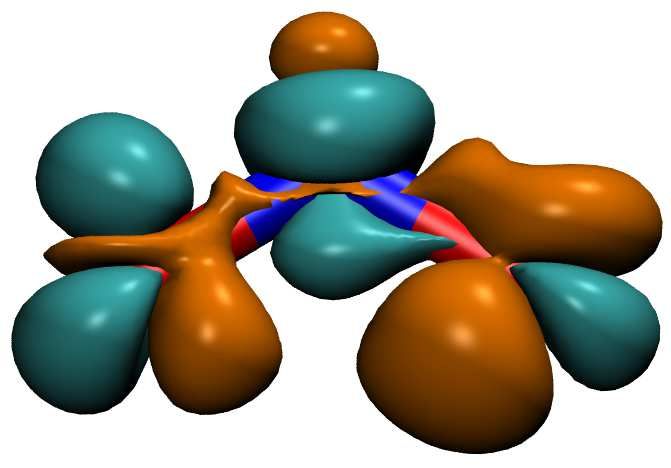
10

                                          0.0              0.2       0.4        0.6            0.8                1.0
                                                                                                                     normalized intensity

                         3.0                                                                                                                        3.0
        frequency [eV]

                                                                                                                                                          frequency [eV]
                         2.0                                                                                                                        2.0

                         1.0                                                                                                                        1.0

                         0.0                                                                                                                        0.0
                            0             10          20      30     40       50           0             10          20      30     40   50
                                                           time [fs]                                                      time [fs]

FIG. 10. Short-time Fourier transform of the ∆ 1e-2o-y dipole moment component (left) and ∆ 1e-2o-z dipole moment component (right) with
a few-cycle IR pulse included in the simulation. The Fourier spectrogramms are normalized and a Gaussian windowing function with a width
of 180 data points corresponding to a time of 18.14 fs is used.

population PD0 (t, φ ) of the D0 ground state as reference.                                    For its maximum the motion of the nuclear wavepacket shows
                                                                                               the highest asymmetry and controllability. Its CEP depen-
                         PD0 (t, φ ) = hχD0 (R,t, φ )|χD0 (R,t, φ )iR .            (10)
                                                                                               dence is illustrated in FIG. 11.
One objective is the CEP efficiency Γ(t)76 which is calculated
as the difference of the maximum and the minimum popula-                                                      0.0 0.2 0.4 0.6 0.8 1.0
tion PD0 (t, φ ) for each time step:                                                                                                prob. density
                                                                                                             60
           Γ(t) = max (PD0 (t, φ )) − min PD0 (t, φ ′ ) . (11)

                                                                                                 time [fs]

For its maximum value the population of the target state shows                                               40
the highest CEP-dependence and consequently the highest de-
gree of controllability with respect to the population trans-
fer. The light pulse amplifies the coherent electron dynamics                                                20
in the system by breaking the symmetry with respect to the
asymmetric stretching coordinate b, as shown in section III B.                                                                  0                 1.4
                                                                                                             0 -0.2        0.0  0.2 -0.2    0.0    0.2
Therefore, the second objective is the CEP-dependent asym-
metry parameter AN(t, φ ) quantifying the CEP induced asym-                                                               asymmetric coord. b [Å]
metry in the nuclear motion with respect to the coordinate b.
                                                 R (t, φ ) − PL (t, φ )
                                                PD0            D0                              FIG. 11. Normalized nuclear probability density evolution in the
                            AN(t, φ ) =                                 .          (12)        presents of a few-cycle IR pulse withe a CEP of 0.0π (left) and 1.4π
                                                      PD0 (t, φ )
                                                                                               (right) on the adiabatic D0 -surface integrated over the α -coordinate.
Where PD0
       L (t, φ ) and PR (t, φ ) are defined as follows:
                      D0
                                                                                               For the other probability densities see FIG. S8 and FIG. S9 in the SI.
                                    αZmax       Z0
       L
      PD0 (t, φ )              =          dα             ∗
                                                      dbχD0 (R,t, φ )χD0 (R,t, φ ). (13)          The temporal evolution of Γ(t) and the CEP dependent pop-
                                                                                               ulation PD0 (t, φ ) at three selected times are shown in FIG. 12.
                                   αmin        bmin
                                                                                               The CEP efficiency (blue line) reaches its global maximum
                                    αZmax       bZmax
                                                                                               (13 %) nearly simultaneously with the peak intensity (t0 =
       R                                                 ∗
      PD0 (t, φ ) =                       dα          dbχD0 (R,t, φ )χD0 (R,t, φ ). (14)       10 fs) of the laser pulse (grey area). The increase of Γ(t) is
                                   αmin         0                                              slightly delayed and the subsequent decrease to 3 % occurs
                                                                                               in two steps. After the laser pulse, approximately at 15 fs,
In the spirit of the efficiency Γ(t) a maximal asymmetry
                                                                                               Γ(t) has a finite oscillating value with a maximum of about
ANmax (t) is calculated as:
                                                                                               5 % around 20 fs, which indicates the second passage through
     ANmax (t) = max (AN(t, φ )) + min AN(t, φ ′ ) . (15)                                      the CoIn region. The later passages through the CoIn region
11
An analog analysis is performed for the asymmetry of the
0.12 nuclear motion along the stretching coordinate b and shown in
FIG. 13. The maximal asymmetry ANmax (t) shows its global
CEP efficiency Γ
0.09
0.8
max asymmetry AN
0.06
0.03 0.6
0.5
0 10 20 30 40 50
time [fs]
0.2
(a)
0 10 20 30 40 50
time [fs]
D0
(a)
1.0
0.3
15 fs
-1.0 20 fs
AN
¡¢ ³²±
40 fs
£¤ ¥¦ 0.1
§¨ ©ª °
¯
® -0.1
0.0 0.5 1.0
[ ]
1.5
¬«
(b)
-0.3
FIG. 12. (a) Temporal evolution of the CEP efficiency Γ(t) (blue). 0.0 0.5 1.0 1.5 2.0
The vertical colored lines indicate the points in time that are exam- CEP [ ]
ined more closely. The violet curve indicates the deviation of the (b)
mean population (averaged over all CEP’s) from the population in the
field-free case. The envelope of the IR pulse is indicated in grey. (b)
FIG. 13. (a) Temporal evolution of the maximal asymmetry of the
Mean difference of the CEP-dependent populations PD0 (t, φ ) given
nuclei ANmax (t) after t0 = 10 fs. The vertical colored lines indicate
in percent for different times.
the points in time that are examined more closely. The envelope of
the IR pulse is indicated in grey. (b) The CEP-dependent asymmetry
parameter AN(t, φ ) for different points in time.
at 30 fs and after 40 fs can roughly be seen in the increase
of Γ(t). The deviation (violet curve) of the mean population maximum around 8 fs. As it is defined with respect to the pop-
(averaged over all CEP’s) from the population in the field- ulation in D0 alone, the values for the early times (in the begin-
free case is significant, especially during the IR pulse and af- ning of the laser pulse) are overestimated compared to the ac-
ter 30 fs. As discussed with respect to FIG. 7, the induced tual population in the DO state. Nevertheless, we can deduce
asymmetry leads to a partial missing of the CoIn region after that ANmax (t) follows the envelope of the laser pulse. The
30 fs, which is almost independent of the CEP chosen. The subsequent peaks between 15 fs to 20 fs, at 30 fs and between
CEP-dependence of the population PD0 (t, φ ) (see FIG. 12(b)) 42 fs to 48 fs correspond to the passages through the CoIn
is recorded for three selected times marked as vertical lines region. The decreasing height of the maxima reflects again
in 12(a). For better visualization the mean difference is used the delocalization of the nuclear wavepacket with time. The
here and, unless otherwise stated, in all following respective CEP-dependence of the asymmetry of the nuclear motion (see
figures. The first line at 15 fs (green) matches the end of the FIG. 13(b)) AN(t, φ ) is recorded for the same times as previ-
laser pulse. The second (red line) and the third point (yel- ously selected for the CEP-dependent populations PD0 (t, φ ).
low line) correspond to the second and fourth passage through It should be mentioned that the entire value of AN(t, φ ) is
the CoIn region. For all three times PD0 (t, φ ) shows a sinu- shown here and not the mean difference. The asymmetry in
soidal oscillation with a periodicity of approximately π . For the nuclear motion along the coordinate b shows a sinusoidal
interference a periodicity of 2π should emerge. Thus the ob- oscillation, now with a periodicity of 2π for all three times,
served π dependence of the population is an indication that which is typical for interference. This means that for the two
it is due mostly to the temporal asymmetry of the few-cycle quantities PD0 (t, φ ) and AN(t, φ ) we observe a different CEP-
laser pulse.69,76 dependence. Or in other words there are two different mecha-12
nisms active in the system which can be projected out by using
different observables. 0.5
max asymmetry AE
In addition we calculated the temporal evolution of Γ(t) and
ANmax (t), as well as the CEP-dependence of PD0 (t, φ ) and
AN(t, φ ) using the y-component and the z-component of the
0.3
TDM. Since the results are quite similar the ones obtained
with the absolute value of the TDM the orientation of the
molecule with respect to electric field of the pulse should not
play a major role. For more details see section IV of the SI. 0.1
B. Control of the electron dynamics 0 10 20 30 40 50
time [fs]
As shown in section III B the laser pulse is creating a co- (a)
herent electronic superposition in the vicinity of the CoIn.
Therefore, we also examined the influence of the CEP vari- Ï
ation on the electron density. The first control objective is the
ÎÍ 20.0
AE
CEP-dependent asymmetry parameter AE(t, φ ) of the 1e-2o-
density ρ (r,t, φ ). ÌË 10.0
ÊÉ
N R (t, φ ) − N L (t, φ ′ ) ÈÆÇ 0.0
AE(t, φ ) = R
N (t, φ ) + N L (t, φ ′ )
. (16) ÅÄ
ÃÂ -10.0
´µ ¶·
with the probabilities N L (t, φ ) and N R (t, φ ) to find the electron Á ¸¹ º»
on the left or the right side of the molecule given by
À -20.0 ¼½ ¾¿
0.0 0.5 1.0 1.5 2.0
xZmax yZmax Z0
CEP [ ]
N L (t, φ ) = dx dy dzρ (r,t, φ ). (17)
(b)
xmin ymin zmin
xZmax yZmax zZmax
FIG. 14. (a) Temporal evolution of the maximal asymmetry of the ac-
N R (t, φ ) = dx dy dzρ (r,t, φ ). (18) tive electron AEmax (t). The vertical colored lines indicate the points
xmin ymin 0 in time that are examined more closely. The envelope of the IR pulse
is indicated in grey. (b) Mean difference of the CEP-dependent asym-
The maximal asymmetry of the electron density AEmax (t) is metry parameter of the active electron AE(t, φ ) given in percent for
calculated as follows: different times.
AEmax (t) = max (AE(t, φ )) + min AE(t, φ ′ ) . (19)
For its maximum the electron dynamics shows the highest asymmetry of the electron density thus has the same periodic-
CEP-dependence and thus the highest controllability. The ity as the nuclear asymmetry AN(t, φ ) which is as previously
temporal evolution of AEmax (t) and the CEP-dependent asym- mentioned typical for an interference process.
metry of the electron density AE(t, φ ) at three selected times As already discussed in section III B the response of the
are shown in FIG. 14. The maximal asymmetry AEmax (t) is dipole moment to the applied laser field is an observable
highest during the laser pulse (grey area). It decreases within directly connected to the electron motion. In the present
8 fs and becomes smaller by a factor of ten. However during case the 1e-2o-y- and the 1e-2o-z-component are of interest.
this time period two peaks at 12 fs and 15 fs can be recognize. Their maximal CEP-dependence γy (t) and γz (t) are evaluated
Afterwards the maximal asymmetry oscillates between nearly as the difference of the maximum and the minimum value
zero and 0.125 until the end of the simulation time. Compar- of 1e-2o-y-DM(t, φ ) respectively 1e-2o-z-DM(t, φ ) for each
ing the maximal asymmetry of the electron density AEmax (t) time step. The maximal CEP-dependence γy (t) is depicted as
with the one of the nuclei (ANmax (t)) faster oscillations are ob- function of time in FIG. 15(a) and its related component 1e-
served. To further analyze the response of the electron density 2o-y in FIG. 15(b) at three selected times.
(see FIG. 14(b)), AE(t, φ ) is recorded for three selected points The maximal CEP-dependence γy (t) like all other objec-
in time marked as vertical lines in 14(a)). The first line at 10 fs tives shows its maximum simultaneously with the maximum
(green) corresponds to the main peak of AEmax (t) and is taken of the IR pulse. In this period the shape of the γy (t) curve is
at the maximum of the pulse. The second point (red line) is similar to the Γ(t) curve (see FIG. 12(a)), only the decrease
taken at 15 fs when the laser pulse is approximately over. The with decaying pulse intensity is even more asymmetric. Af-
last point in time (yellow line) is at 40 fs. At all three times ter the pulse in the time window from 20 fs to 40 fs the CEP-
AE(t, φ ) shows a sinusoidal oscillation with a periodicity of dependence oscillates. Again the oscillations are significantly
approximately 2π and a decreasing amplitude with time. The faster than for the nuclear objectives. The CEP-dependence13
max asymmetry γz [au]
max asymmetry γy [au] 1.0
0.03
0.02 ìíî
0.01
0.2
0 10 20 30 40 50 0 10 20 30 40 50
time [fs] time [fs]
(a) (a)
1.5 50
èç ë ûú þ
æå êé ùø ýü 25
ãäâá
0.5 ÷
öõô
1e2o-yDM
1e2o-zDM
à ó 0
ßÞ òñ
Ý -0.5
ÐÑ ÒÓ ð
Ü ï -25 10 fs
ÔÕ Ö× 15 fs
-1.5 ØÙ ÚÛ -50
40 fs
0.0 0.5 1.0 1.5 2.0 0.0 0.5 1.0 1.5 2.0
CEP [ ] CEP [ ]
(b) (b)
FIG. 15. (a) Temporal evolution of the maximal asymmetry γy (t) of FIG. 16. (a) Temporal evolution of the maximal asymmetry γz (t) of
the 1e-2o-y-component of the dipole moment. The vertical colored the 1e-2o-z-component of the dipole moment. The vertical colored
lines indicate the points in time that are examined more closely. The lines indicate the points in time that are examined more closely. The
envelope of the IR pulse is indicated in grey. (b) Mean difference of envelope of the IR pulse is indicated in grey. (b) Mean difference of
the CEP-dependent 1e-2o-y-component for different points in time. the CEP-dependent 1e-2o-z-component for different points in time.
of the 1e-2o-y-component is recorded in FIG. 15(b) for the motion along the α -coordinate, respectively the y-coordinate.
same three selected times as for AE(t, φ ). It shows a sinu- The motion in this direction mediates the non-adiabatic trans-
soidal oscillation with a periodicity of approximately π and a fer between the D1 and DO state. For these cases the CEP-
decreasing amplitude with later times. Thus the component dependence shows a π periodicity, arising from the tempo-
shows the same periodicity as Γ(t) even with the same phase. ral asymmetry of the few-cycle pulse itself.69,76 Both mech-
The temporal evolution of the maximal CEP-dependence anisms are present for the nuclear as well as for the electron
γz (t) and its 1e-2o-z-component as function of the CEP are dynamics and can be detected depending on the chosen ob-
shown in FIG. 16. The maximal CEP-dependence γz (t) is servable.
significantly larger than γy (t) in consistency with our find-
ing in section III B that the z-component reacts more strongly
to the laser pulse. The overall shape of γz (t) is quite simi- CONCLUSION
lar to the temporal evolution of AEmax (t) (see FIG. 14(a)) and
the 1e-2o-z-component shows the same periodicity of 2π as In this paper, we expand our ansatz for the description
AE(t, φ ). The only difference is a phase shift of π . of the coupled nuclear and electron dynamics in molecular
In summary, two different responses on the CEP varia- systems8,38,39 (NEMol). We applied our method to the pho-
tion are present in the nuclear and electron dynamics. Both toinduced ultrafast dynamics in NO2 which is dominated by
asymmetry parameters AN(t, φ ) and AE(t, φ ) as well as the a CoIn. We observe the appearance of a coherent electronic
1e-2o-z-component of the dipole moment provide a distinc- wavepacket at each passage of the CoIn. The coherence is
tion between left and right within the molecular plane (yz- not strong and only short lived due to the high symmetry of
plane). The associated 2π periodicity is typical for an in- the molecule which cancels out the individual contributions79.
terference process. Γ(t) and the 1e-2o-y-component of the Beside the field-free relaxation we also studied the influence
dipole moment are directly sensitive to the main direction of of a few-cycle IR laser pulse applied in the vicinity of the14
CoIn. The induced symmetry breaking significantly enhances SUPPLEMENTARY MATERIAL
the degree of coherence and its life time. Inspired by previ-
ous works56,57,73,75,76 we varied the carrier envelope phase φ See the supplementary material for the details of the
(CEP) of the IR pulse to control the movement of electrons wavepacket simulation setup, the underlying quantum chem-
and nuclei during the passage through the CoIn. ical data of NO2 and additional figures and tables for the
In the first part we generalized our NEMol ansatz. The NEMol-dynamics. A section contains the results for the CEP-
principle advantage of this ansatz is based on the combina- control obtained with the y-component and the z-component
tion of highly developed quantum-chemical methods with the of the TDM.
accurate description of the nuclear quantum dynamics. In
the original ansatz8,38,39 an expression for the time-dependent
electronic wavepacket is formulated where the electronic part AUTHOR CONTRIBUTIONS STATEMENT
of the total wavefunction is propagated in the electronic
eigenstate basis. Its dynamics is extracted from the nu-
TS performed all calculations. TS and RDVR analyzed
clear wavepacket propagation on coupled potential energy
the results and contributed equally to the final version of the
surfaces by introducing the parametric dependence on the
manuscript.
time-dependent expected value of position hRi(t). By extend-
ing the NEMol ansatz with a grid representation, it is pos-
sible to couple the electron dynamics to multiple grid points
on which the nuclear wavepacket is represented. Through a DATA AVAILABILITY STATEMENT
simple approximation we were able to condense the coupled
dynamics of the one-electron excitation process in the den- The data that support the findings of this study are avail-
sity of one active electron (1e-2o-picture). In the second part able from the corresponding author upon reasonable request.
we compared the coupled nuclear and electron dynamics of The following article has been submitted to ’The Journal of
NO2 with and without an IR pulse present when the system Chemical Physics’.
reaches the CoIn for the first time. Using the NEMol ansatz,
we characterized the coherent electron dynamics by analyzing
the temporal evolution of the induced dipole moment. The ob- CONFLICTS OF INTEREST
served frequencies of the coherent electron dynamics cover a
range up to 2.3 eV. These high values originate from the nu-
clear overlap term as well as from the electronic phase term. There are no conflicts to declare.
In NO2 the phase contribution of the nuclear overlap term is
high and therefor provides a significant contribution to the
electron dynamics. The applied few-cycle IR laser pulse gen- ACKNOWLEDGEMENTS
erated an asymmetric movement of the nuclear and electronic
wavepackets, which is vital for the controllability at the CoIn. The authors gratefully acknowledge the DFG Normalver-
The induced oscillating dipole reflects an enhanced build up of fahren and the Munich Center of Advanced Photonics (MAP).
the coherent electron dynamics by the laser pulse which sur-
vives for several 10 fs. In the last part the CEP of the IR pulse
was varied to influence both the nuclear dynamics as well as Appendix:
the electron dynamics. The CEP-dependent effect lives con-
siderably longer than the pulse in all investigated observables.
Depending on the chosen observable a π or 2π periodicity can The following detailed formulation of the NEMol
be found indicating two mechanisms, one based on an inter- ansatz8,38,39 is given here in the improved notation. The total
ference process (2π ) and the other one induced by the tempo- molecular wavefunction Ψtot (r, R,t) is setup as the sum over
ral asymmetry of the few-cycle pulse itself (π ). Both period- the electronic states with χ (R,t) the nuclear wavefunctions,
icities are observed for the nuclear as well as for the electron ϕ (r,t; R) the electronic wavefunctions, the nuclear and elec-
dynamics. In each case they can be projected out by using tronic coordinates R and r and the time t.
different observables.
Ψtot (r, R,t) = ∑ χi (R,t) · ϕi (r,t; R). (A.1)
We demonstrated the potential of our NEMol ansatz to de- i
scribe the coupled nuclear and electron dynamics in molecular
systems beyond diatomics. In NO2 we followed the dynamics Applying the Born-Oppenheimer approximation the uncou-
in the excited state dominated by fast changing wavepacket pled electronic wavefunctions ϕi are hereby parametrically
interference effects. The ansatz is expandable to simulate the depending on the nuclear coordinates R and define a multi-
induced coherent electron dynamics in the excitation process dimensional vector ϕtot . The total nuclear wavefunction χtot
itself as well as higher-dimensional molecular system as long also represents a multi-dimensional vector, spanned by the
as the underlying nuclear dynamics can be treated quantum coupled wavefunctions χi . For details how the temporal evo-
mechanically. Two electron processes could be realized by lution of the nuclear wavefunctions χi on coupled potential
using pair densities. energy surfaces (PES) is determined see section I of the SI.15
Multiplying Ψtot (r, R,t) from the left with χtot and the sub- pling terms are already determined by the nuclear quantum-
sequent integration over the nuclear coordinates results in an dynamics simulation. If the coupling between the electronic
expression of the coupled total electronic wavefunction8,38,39 . states is weak, the nuclear wavefunctions propagate indepen-
Z dently and the coherence term becomes zero. In this case,
Φtot (r,t; hRi(t)) = ∗
χtot (R,t) · Ψtot (r, R,t)dR the coupled electronic wavefunctions Φ j in equation A.4 be-
come equivalent to the uncoupled electronic wavefunction ϕ j .
Φ1 (r,t; hRi(t)) Standard quantum-chemical calculations at the hRi(t) struc-
Φ2 (r,t; hRi(t)) (A.2) ture yield the real-valued wavefunctions ϕ j (r; hRi(t)) of the
= .. ,
relevant electronic states and their eigenenergies. The tempo-
.
ral evolution of ϕ j (r,t; hRi(t)) is determined by the deforma-
Φ j (r,t; hRi(t))
tion of the electronic structure induced by the nuclear motion
with hRi(t) = ∑ hχi (R,t)|R|χi (R,t)iR . (A.3) (Born-Oppenheimer part) and an oscillation through phase
i space defined by a pure electronic phase.8,38,39
The coupled total electronic wavefunction is parametrically
depending on the time-dependent expected value of the po- ϕ j (r,t; hRi(t)) = ϕ j (r; hRi(t)) · e−iξ j (t) (A.6)
sition hRi(t). In other words Φtot is evaluated at one single
The phase term ξ j (t) depends on the eigenenergies E j (hRi(t))
nuclear geometry which changes with time. The individual
and has to be calculated recursively.
components Φ j are defined by the following equation:
ξ j (t) = E j (hRi(t))∆t + ξ j (t − ∆t). (A.7)
Φ j (r,t; hRi(t)) = A j j (t) · ϕ j (r,t; hRi(t))
+ ∑ A jk (t) · ϕk (r,t; hRi(t)), (A.4) This recursive evaluation is necessary to retain the memory
k6= j of the progressing electronic phase. Thereby the propagation
with A jk (t) = χ j (R,t) χk (R,t) (A.5) velocity of the phase in the complex plane changes smoothly
R
.
in time while the nuclear wavepacket propagates. Using the
The first part depends on the population A j j of the respective coupled total electronic wavefunction Φtot (r,t; hRi(t)) the as-
state j, while all others summands include the nuclear over- sociated electron density ρ (r,t; hRi(t)) can be determined by
lap term A jk which specifies the degree of coherence induced multiplying Φtot (r,t; hRi(t)) from the left with ϕtot and the
between the two states j and k. The population and coher- subsequent integration over N − 1 electronic coordinates (with
ence of the electronic states as well as the influence of all cou- N being the total number of electrons).
Z
∗
· Φtot dr2 . . . drN = ∑ A j j (t)ρ j j (r; hRi(t)) + ∑ 2Re A jk (t)ρ jk (r; hRi(t))e−iξ jk (t) , (A.8)
ρ (r,t; hRi(t)) = ϕtot
j k6= j
with ξ jk (t) = ∆E jk (hRi(t))∆t + ξ jk (t − ∆t). (A.9)
The first summation consists of the state specific electronic W. Siu, O. Ghafur, P. Johnsson, M. Swoboda, E. Benedetti, F. Fer-
density ρ j j (r,t; hRi(t)) weighted with the corresponding time- rari, F. Lépine, J. L. Sanz-Vicario, S. Zherebtsov, I. Znakovskaya,
dependent population A j j (t). The dynamics of these contri- A. Lhuillier, M. Y. Ivanov, M. Nisoli, F. Martín, and M. J. Vrakking,
“Electron localization following attosecond molecular photoionization,”
butions to the coupled electron density is determined by the Nature 465, 763–766 (2010).
temporal evolution of the nuclear wavepacket i.e. its expected 4 P. M. Kraus, S. B. Zhang, A. Gijsbertsen, R. R. Lucchese, N. Rohringer,
value of the position hRi(t). The second summation de- and H. J. Wörner, “High-harmonic probing of electronic coherence in dy-
fines the coherent contribution to the coupled electron density namically aligned molecules,” Phys. Rev. Lett. 111, 243005 (2013).
5 C. Andrea Rozzi, S. Maria Falke, N. Spallanzani, A. Rubio,
and consists of the time-dependent overlap A jk (t), the one-
E. Molinari, D. Brida, M. Maiuri, G. Cerullo, H. Schramm,
electron transition density ρ jk (r,t; hRi(t)) and its pure elec- J. Christoffers, and C. Lienau, “Quantum coherence controls the
tronic phase defined by the energy difference ∆E jk between charge separation in a prototypical artificial light-harvesting system,”
the involved electronic states. Nature Communications 4, 1602 (2013).
6 E. Romero, R. Augulis, V. I. Novoderezhkin, M. Ferretti, J. Thieme, D. Zig-
1 M.
mantas, and R. van Grondelle, “Quantum coherence in photosynthesis for
Hentschel, R. Kienberger, C. Spielmann, G. A. Reider, N. Milosevic, efficient solar-energy conversion,” Nature Physics 10, 676–682 (2014).
T. Brabec, P. Corkum, U. Heinzmann, M. Drescher, and F. Krausz, “At- 7 F. Calegari, D. Ayuso, A. Trabattoni, L. Belshaw, S. De Camillis, S. Anu-
tosecond metrology,” Nature 414, 509–513 (2001). mula, F. Frassetto, L. Poletto, A. Palacios, P. Decleva, J. B. Greenwood,
2
E. Goulielmakis, V. S. Yakovlev, A. L. Cavalieri, M. Uiber- F. Martín, and M. Nisoli, “Ultrafast electron dynamics in phenylalanine ini-
acker, V. Pervak, A. Apolonski, R. Kienberger, U. Kleineberg, and tiated by attosecond pulses,” Science 346, 336–339 (2014).
F. Krausz, “Attosecond control and measurement: Lightwave electronics,” 8
P. von den Hoff, I. Znakovskaya, M. Kling, and R. de Vivie-
Science 317, 769–775 (2007). Riedle, “Attosecond control of the dissociative ionization via
3 G. Sansone, F. Kelkensberg, J. F. Pérez-Torres, F. Morales, M. F. Kling,You can also read