Corsa Coal Corp. Investor Presentation - November 2021
←
→
Page content transcription
If your browser does not render page correctly, please read the page content below
Corsa Coal Corp.
Investor Presentation
November 2021
Forward Looking Information and Statements
                                                                                                                                    TSX-V: CSO | OTCQX: CRSXF

Certain information set forth in this Presentation contains “forward-looking statements” and “forward-looking information” (collectively, “forward looking
statements”) under applicable securities laws. Except for statements of historical fact, certain information contained herein relating to projected sales, coal
prices, coal production, mine development, the capacity and recovery of Corsa’s preparation plants, expected cash production costs, geological conditions,
future capital expenditures and expectations of market demand for coal, constitutes forward-looking statements which include management’s assessment of
future plans and operations and are based on current internal expectations, estimates, projections, assumptions and beliefs, which may prove to be incorrect.
Some of the forward-looking statements may be identified by words such as “estimates”, “expects”, “anticipates”, “believes”, “projects”, “plans”, “capacity”,
“hope”, “forecast”, “anticipate”, “could” and similar expressions. These statements are not guarantees of future performance and undue reliance should not be
placed on them. Such forward-looking statements necessarily involve known and unknown risks and uncertainties, which may cause Corsa’s actual performance
and financial results in future periods to differ materially from any projections of future performance or results expressed or implied by such forward-looking
statements. These risks and uncertainties include, but are not limited to: liabilities inherent in coal mine development and production; geological, mining and
processing technical problems; inability to obtain required mine licenses, mine permits and regulatory approvals or renewals required in connection with the
mining and processing of coal; risks that Corsa’s preparation plants will not operate at production capacity during the relevant period, unexpected changes in
coal quality and specification; variations in the coal mine or preparation plant recovery rates; dependence on third party coal transportation systems;
competition for, among other things, capital, acquisitions of reserves, undeveloped lands and skilled personnel; incorrect assessments of the value of
acquisitions; changes in commodity prices and exchange rates; changes in the regulations in respect to the use, mining and processing of coal; changes in
regulations on refuse disposal; the effects of competition and pricing pressures in the coal market; the oversupply of, or lack of demand for, coal; inability of
management to secure coal sales or third party purchase contracts; currency and interest rate fluctuations; various events which could disrupt operations and/or
the transportation of coal products, including labor stoppages, severe weather conditions, public health crises and government regulations that are implemented
to address them; the demand for and availability of rail, port and other transportation services; the ability to purchase third party coal for processing and
delivery under purchase agreements; the ability to resolve litigation and similar matters involving the Company and/or its assets; the ability to pay down
indebtedness; and management’s ability to anticipate and manage the foregoing factors and risks. The forward-looking statements and information contained in
this Presentation are based on certain assumptions regarding, among other things, future prices for coal; future currency and exchange rates; Corsa’s ability to
generate sufficient cash flow from operations and access capital markets to meet its future obligations; the regulatory framework representing royalties, taxes
and environmental matters in the countries in which Corsa conducts business; coal production levels; Corsa’s ability to retain qualified staff and equipment in a
cost-efficient manner to meet its demand; and Corsa being able to execute its program of operational improvement and initiatives. There can be no assurance
that forward-looking statements will prove to be accurate, as actual results and future events could differ materially from those anticipated in such statements.
The reader is cautioned not to place undue reliance on forward-looking statements. Corsa does not undertake to update any of the forward- looking statements
contained in this Presentation unless required by law. The statements as to Corsa’s capacity to produce coal are no assurance that it will achieve these levels of
production or that it will be able to achieve these sales levels.

                                                                                                                                                                 1
Additional Information
                                                                                                                                          TSX-V: CSO | OTCQX: CRSXF

Non-GAAP Measures
Management uses realized price per ton sold, cash production cost per ton sold, cash cost per ton sold, cash margin per ton sold, EBITDA and adjusted EBITDA as
internal measurements of financial performance for Corsa’s mining and processing operations. These measures are not recognized under International Financial
Reporting Standards (“GAAP”). Corsa believes that, in addition to the conventional measures prepared in accordance with GAAP, certain investors and other
stakeholders also use these non-GAAP financial measures to evaluate Corsa’s operating and financial performance; however, these non-GAAP financial measures
do not have any standardized meaning and therefore may not be comparable to similar measures presented by other issuers. Accordingly, these non-GAAP
financial measures are intended to provide additional information and should not be considered in isolation or as a substitute for measures of performance
prepared in accordance with GAAP. Reference is made to the management’s discussion and analysis for the three and nine months ended September 30, 2021
for a reconciliation and definitions of non-GAAP financial measures to GAAP measures.

Corsa defines adjusted EBITDA as EBITDA (earnings before deductions for interest, taxes, depreciation and amortization) adjusted for change in estimate of
reclamation provision for non-operating properties, impairment and write-off of mineral properties and advance royalties, gain (loss) on sale of assets and other
costs, stock-based compensation, non-cash finance expenses and other non-cash adjustments. Adjusted EBITDA is used as a supplemental financial measure by
management and by external users of our financial statements to assess our performance as compared to the performance of other companies in the coal
industry, without regard to financing methods, historical cost basis or capital structure; the ability of our assets to generate sufficient cash flow; and our ability to
incur and service debt and fund capital expenditures.

Other Matters
Unless otherwise noted, all dollar amounts in this presentation are expressed in United States dollars and all ton amounts are short tons (2,000 pounds per ton).
Pricing and cost per ton information is expressed on a free-on-board, or FOB, mine site basis, unless otherwise noted.

Other than as otherwise described on slide 15, all scientific and technical information contained in this news release has been reviewed and approved by Peter
V. Merritts, Professional Engineer and the Company’s COO, who is a qualified person within the meaning of National Instrument 43-101 - Standards of Disclosure
for Mineral Projects.

                                                                                                                                                                        2
Corsa Coal Overview
TSX-V: CSO | OTCQX: CRSXF
Pure play metallurgical coal producer (no thermal coal) with significant leverage to
metallurgical coal prices
Pennsylvania
2016-2020: 105% growth in metallurgical coal sales
Corsa Operations
Active Operations: 3 deep mines, 1 surface mine, located in PA and MD
Customers: Integrated steel and coke producers
Baltimore
Metallurgical Coal Sales 2021 3Q YTD 2020
Low Vol Sales Tons (margin generating) 0.860 million 1.235 million Norfolk
Sales & Trading Tons (pass-through) 0.000 million 0.137 million
Total Metallurgical Sales Tons 0.860 million 1.372 million
Mix: % Domestic Total (Low Vol) 55% (55%) 32% (36%)
Mix: % Export Total (Low Vol) 45% (45%) 68% (64%)
Low Vol Metallurgical Sales High Quality Ownership
Quintana Capital Group (45%)
Quintana affiliates are the largest owners of coal
reserves in the United States
Family of Lukas Lundin (15%)
Highly successful mining and oil & gas investor
Sev.en Met Coal Corp. (11%)
Market Cap: $80 million (1)
Enterprise Value: $96 million (1)
(1) As of October 29, 2021
3
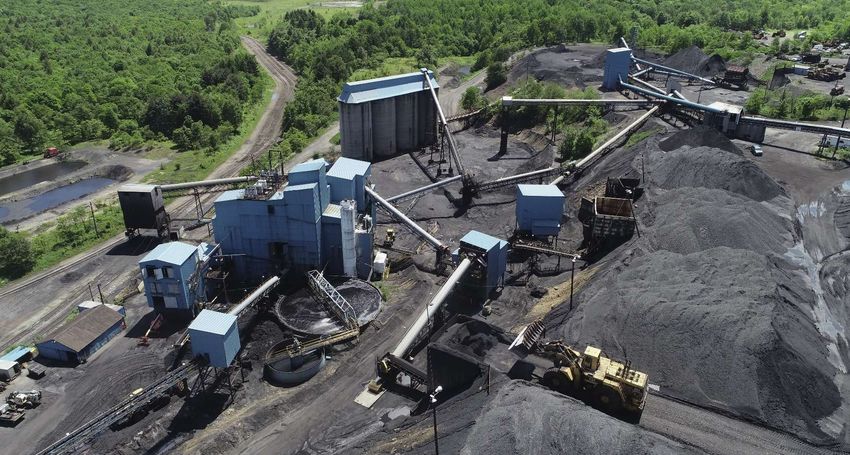
NAPP Division Overview
                                                                                            TSX-V: CSO | OTCQX: CRSXF

        NAPP Division Operating Locations                          Producer-Purchaser Model

                                               •    Corsa reported 2021 2Q YTD sales of 0.562 million tons

Pittsburgh 70 miles                                                                VAS
 NW of Somerset                                                         Surface

                                                                                               Casselman

                                                                  Horning

                                                                                  Acosta

                         Baltimore 180 miles                     Company Mine              Value Added Services
                           SE of Somerset                         (Produced)                   (Purchased)

                                                                            Infrastructure
                                               •   Up to 4 million clean tons per year of processing plant capability
                                               •   Three preparation plants with refuse disposal sites and rail
                                                   loadouts
                                                      •   Cambria Preparation Plant (CSX)
                                                      •   Shade Creek Preparation Plant (NS)
                                                      •   Rockwood Preparation Plant (CSX) (Plant currently idle)

                                                                                                                  4
Revenue Stream: Company Produced Tons
                                                                                                                     TSX-V: CSO | OTCQX: CRSXF

        Low Vol Met Coal                                Margin Generating                       Passes through Prep Plants

         Casselman                                     Acosta                           Horning                           Surface Mines
 2021 3Q YTD: 305,000 tons               2021 3Q YTD: 264,000 tons            2021 3Q YTD: 144,000 tons             2021 3Q YTD: 100,000 tons
     2020: 524,000 tons                     2020: 362,000 tons                    2020: 160,000 tons                    2020: 146,000 tons
 Reserves: 2.6 million tons(1)          Reserves: 14.9 million tons (1)       Reserves: 0.5 million tons (1)        Reserves: 1.8 million tons (1)

        Company Produced Tons: Quarterly Production History

                                                                                                          % of                  % of
                                                                                                        Tons Sold           Gross Margin
                                                                                2018                      51%                   73%
                                                           2021 3Q YTD
                                                                                2019                      71%                   88%
               2019                     2020                  0.814             2020                      87%                   96%
         1.355 million tons       1.192 million tons       million tons
                                                                                2021 3Q YTD               96%                   95%

Source: Company filings          (1) Reserves are based on the Technical Report dated December 31, 2020. See slide 15.                           5
Revenue Stream: Value Added Services Tons
TSX-V: CSO | OTCQX: CRSXF
Low Vol Met Coal Margin Generating Passes through Prep Plants
Strategic Advantages Historical VAS Purchased Coal Volumes in tons
Local, third-party tons purchased on a raw
basis and trucked to Corsa’s preparation
plants.
Purchased for both financial and quality
reasons. Provides exposure to the export
market for Corsa’s suppliers.
Increased volume through the preparation
plants absorbs fixed costs and lowers per
unit costs.
Source: Company filings.
Corsa’s Value Added Services for Local % of % of
Purchased Coal Tons Sold Gross Margin
2018 21% 26%
Washing Loading
2019 14% 12%
2020 3% 4%
Blending Storing
2021 2Q YTD 4% 5%
6
Financial Highlights
                                                                                                                                            TSX-V: CSO | OTCQX: CRSXF

                                                     Total Year   Total Year    Q1        Q2        Q3         Q4       Total Year    Q1         Q2         Q3        Total Year
                                                       2018         2019       2020      2020      2020       2020        2020       2021       2021       2021         2021

Revenues ($ million)                                     $265.8       $232.1     $46.8     $41.2     $23.6      $16.8       $128.5     $24.6      $30.4      $36.4         $91.4

Adjusted EBITDA(1) ($ million)                            $35.0        $28.9      $6.4      $4.3     -$4.8      -$1.4         $4.4      $0.1       $2.7       $4.1          $7.0

Capital Expenditures - Maintenance ($ million)             $9.6         $7.6      $0.5      $0.3      $0.2       $0.6         $1.6      $0.4       $1.3       $1.5          $3.2

Capital Expenditures - Growth ($ million)                 $11.9        -$0.2      $0.0      $0.2      $0.0       $0.0         $0.3      $0.0       $0.0       $0.2          $0.2

Metallurgical Coal Sales

Average Realized Price / Metallurgical Ton Sold(1)     $114.50      $103.76     $90.49    $82.72    $66.54     $82.03       $81.77    $86.62     $91.67    $112.75       $97.46

Sales Volumes (short tons)

       Company Produced Tons                            981,669    1,301,244   384,750   336,928   286,944    190,412    1,199,034   251,465    290,117    286,678      828,260

       Corsa Value Added Services Tons                  403,560      250,638    29,576     2,426      617       3,314       35,933     6,495     13,578     11,760       31,833

       Sales & Trading Tons                             486,876      281,471    34,587   102,076          0      360       137,023          0          0          0              0

Total Metallurgical Coal Tons Sold                    1,872,105    1,833,353   448,913   441,430   287,561    194,086    1,371,990   257,960    303,695    298,438      860,093

Cash Cost / Metallurgical Ton Sold(1)

       Cash Production Cost Per Ton Sold(2)              $83.61       $79.38    $71.12    $63.04    $77.15     $77.11       $71.24    $79.15     $77.23     $92.24       $83.00

       Cash Cost per Ton Sold                            $88.59       $82.07    $71.61    $68.12    $77.01     $76.77       $72.35    $79.08     $77.04     $92.55       $83.03

Cash Margin per Metallurgical Ton Sold(1)                $25.91       $21.69    $18.88    $14.60   -$10.47      $5.26        $9.42     $7.54     $14.63     $20.20       $14.43
(1)
      This is a non-GAAP measure. See slide 2.
(2)
      Excludes Purchased Coal
Source: Company filing.

                                                                                                                                                                             7
Balance Sheet Summary
                                                                                                                       TSX-V: CSO | OTCQX: CRSXF

    $mm as of:                                                              12/31/2018      12/31/2019    12/31/2020      9/30/2021
    Balance Sheet Summary
    Total Assets                                                                  $283.3        $269.3        $210.1          $206.5
    Total Liabilities                                                             $132.3        $118.2        $122.4          $120.0
    Total Equity                                                                  $151.0        $151.1         $87.7           $86.5

    Select Balance Sheet Items
    Cash                                                                            $10.1         $4.3         $24.8           $17.4
    Revolving Credit Facility unused availability                                                 $6.7          $3.4            $4.1
    Working Capital                                                                  $4.2        $16.3         $22.1           $20.1

    Debt
    Revolving Credit Facility                                                                    $14.5          $0.0           $0.0
    Equipment Loan                                                                               $10.9          $8.3           $4.9
    Loans Payable                                                                   $30.5         $0.0         $25.4          $25.0
    Notes Payable                                                                    $0.4         $0.0          $0.0           $0.0
    Lease Liabilities                                                                $4.5         $3.5          $4.2           $3.5
    Total Debt                                                                      $35.4        $28.9         $37.9          $33.4
    Net Debt                                                                        $25.3        $24.6         $13.1          $16.0

    Significant Non Debt Liabilities
    Site Reclamation Liability(1)                                                   $30.0        $33.8         $36.9           $35.8
    Cash Collateral                                                                  $5.4         $5.5          $6.9            $7.7
    Net Liability                                                                   $24.6        $28.3         $30.0           $28.1

    Water Treatment Liability                                                       $27.3        $25.3         $30.6           $29.3
    Cash Held in Trusts                                                             $22.3        $27.6         $27.9           $30.0
    Net Liability                                                                    $5.0        ($2.3)         $2.7           ($0.7)

    Workers Compensation Liability                                                   $6.2         $6.1          $6.4            $6.0
    Cash Collateral                                                                  $4.8         $4.1          $4.6            $4.3
    Net Liability                                                                    $1.4         $2.0          $1.8            $1.7

    Asset Retirement Obligations Cash Expenditures                                   $6.9         $6.1          $3.3            $2.9
    (1)
          $65,967,000 in surety bonds are posted against this liability as of 09/30/2021
    Source: Company filing.
                                                                                                                                              8
Investment Highlights
TSX-V: CSO | OTCQX: CRSXF
Portfolio of Long-Lived, Well-Capitalized Operating Mines that
1
Generate Attractive Margins
Provider of Premium Quality Low Volatile Metallurgical Coal With
2 High Scarcity Value
Supportive Long-Term Outlook for Both Domestic and International
3
Met Coal Markets
4 Advantageous Transportation Logistics Provides Access to Blue-Chip Customers
Attractive Organic Replacement and Growth Opportunities to Expand Production
5
Capabilities and Benefit from Economies of Scale
9Advantageous Transportation Logistics Provides
Access to Blue-Chip Customers TSX-V: CSO | OTCQX: CRSXF
Key Differentiators Transportation Advantage
Proximity to the largest
metallurgical coal buying
region in the US
Strategic
Location Access to key infrastructure
and logistics that allows for
access to both domestic and
export markets
Ability to transport and
deliver coal by truck, rail and
barge across the US and
internationally
Flexible
Logistics Dual rail service with CSX and
Norfolk Southern
Access to all coal exporting Within this shaded region there is ~15mm tons of met coal demand from
terminals on the US east coast coke batteries of which ~4mm tons is low volatile met coal.
Cleveland-Cliffs &
Cleveland-Cliffs U. S. Steel DTE SunCoke Energy
Driven by high demand in the
Low region and advanced logistics
Delivery Results in a higher realized
Costs price per ton to Corsa relative
to its competitors
Source: Industry Research, Management.
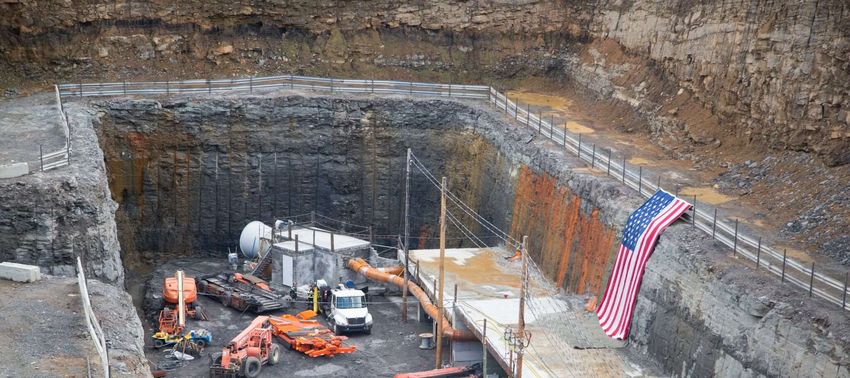
10North Deep Mine (Casselman Deep Mine Replacement)
TSX-V: CSO | OTCQX: CRSXF
Project Overview Mine Location
Located near Grantsville, Maryland
Expected to employee approximately 100 people
once fully staffed
Permitted
4.5 million tons of proven and probable reserves,
currently
Corsa is continuing its leasing efforts to expand
the reserve base
Coal to be trucked to the Cambria and Shade
Preparation plants
Expected annual run rate production of 480,000 tons
Average coal seam thickness of 36 inches
7.5% – 8.5% Ash; 1.0% – 1.10% Sulfur; 19 Vol; 1.48
Reflectance
11Keyser Deep Mine (Growth Opportunity)
TSX-V: CSO | OTCQX: CRSXF
Project Overview Mine Location
Located in Jenner Township, PA; 16 miles north of
Somerset, PA
Expected to employee approximately 100 people
once fully staffed
Preliminary permit approval has been received
$20 - $24 million of start up costs
8.3 million tons of proven and probable reserves
Expected annual run rate production of 570,000 tons
~50 inches coal seam thickness, considered thick for
the area
7.0% – 8.0% Ash; 1.4% – 1.7% Sulfur; 19 – 20 Vol;
1.56 Reflectance
12A Seam (Growth Opportunity)
TSX-V: CSO | OTCQX: CRSXF
Project Overview Mine Location
Located in Berlin PA; 5 miles southeast of Somerset,
PA
Expected to employ approximately 100 people once
fully staffed
Fully permitted
$28 million of start-up costs
6.4 million tons of proven reserves
Trucked to the Cambria and Shade preparation
plants (15 miles)
Expected annual run rate production of 600,000 tons
Coal seam thickness: ~70-75 inches
10% Ash; 0.8% Sulfur, 18 Vol; 1.49 Reflectance
13Appendix
TSX-V: CSO | OTCQX: CRSXF
14Technical Report
TSX-V: CSO | OTCQX: CRSXF
The mineral reserve and resource estimates relating to Corsa’s properties, which are effective as of December 31, 2020, have been prepared by
Marshall Miller & Associates, Inc. (“MM&A”) under the supervision of Justin S. Douthat, P.E., M.B.A. and John W. Eckman, C.P.G., each a qualified
person, as such term is defined in National Instrument 43-101 – Standards of Disclosure for Mineral Projects (“NI 43-101”). MM&A is independent
of Corsa and its subsidiaries. For a complete description of the mines and projects relating to the NAPP Division Properties, see the report prepared
pursuant to NI 43-101 by MM&A under Corsa’s profile at www.sedar.com entitled “Technical Report on the Coal Resource and Coal Reserve
Controlled by Corsa Coal Corp., Pennsylvania and Maryland, USA - Prepared in Accordance with National Instrument 43-101 Standards for
Disclosure for Mineral Projects Effective December 31, 2020” (the “NAPP Technical Report”).
Reserves are clean recoverable tons.
Cautionary Statement Regarding Estimates of Mineral Reserves
This document sets forth certain estimates of “reserves” and “resources”. While Corsa believes that the estimates were based on methodologies
acceptable in Canada pursuant to NI 43-101, such estimates are not synonymous with the United States Securities and Exchange Commission
(“SEC”) Industry Guide 7 as discussed below. NI 43-101 is a rule developed by the Canadian Securities Administrators that establishes standards for
all public disclosure an issuer makes in Canada of scientific and technical information concerning mineral projects. Of note to U.S. investors, these
standards differ significantly from the requirements of the SEC (including under its Industry Guide 7).
Under U.S. standards, mineralization may not be classified as a “reserve” unless the determination has been made that the mineralization could be
economically and legally produced or extracted at the time the reserve determination is made. U.S. investors are cautioned not to assume that all
or any part of historical estimates of “resources” in this AIF will ever be converted into reserves, or if converted, what actual tonnage and grade
they may have. Accordingly, information concerning descriptions or mineralization, “resources” and “reserves” contained in this AIF are not
comparable to information made public by U.S. companies subject to the reporting and disclosure requirements of the SEC.
15Coal Reserves
TSX-V: CSO | OTCQX: CRSXF
43-101 Properties as of 12/31/2020
mnt Proven Probable Total Permitted Not Permitted
Surface-mineable 1,671 - 1,671 705 966
Highwall-mineable - - - - -
Auger-mineable 150 - 150 150 -
Underground-mineable 28,209 8,947 37,156 17,630 19,526
Total 30,031 8,947 38,977 18,485 20,492
Casselman (UG) 1,736 814 2,550 2,550 -
North (UG) 3,283 1,227 4,510 2,763 1,747
Acosta (UG) - -
Upper Kittanning 7,884 1,525 9,409 - 9,409
Middle Kittanning 4,388 1,072 5,460 5,460 -
Total Acosta (UG) 12,272 2,597 14,869 5,460 9,409
Horning (UG) 496 - 496 496 -
A-Seam (UG) 5,590 810 6,400 6,362 38
Keyser (UG) 4,834 3,497 8,331 - 8,331
All Other 1,821 0 1,821 855 966
Total 30,031 8,947 38,977 18,485 20,492
Source: Technical Report dated December 31, 2020. 16Coal Qualities
TSX-V: CSO | OTCQX: CRSXF
43-101 Properties as of 12/31/2020
Weighted Composite (Moist Basis)
Wash Volatile
Reserve Area Seam Recovery (%) Ash (%) Sulfur (%) Btu/lb. Matter (%)
Surface-Mineable
Rhoads Upper Kittanning 94.37% 7.95% 0.53% 12,430 18.74%
Rhoads Middle Kittanning 72.69% 13.76% 1.56% 12,234 15.39%
Rhoads Lower Kittanning 80.83% 11.19% 2.08% 12,747 15.88%
Schrock Run Lower Freeport 95.67% 6.61% 0.68% 13,315 16.64%
Schrock Run Upper Kittanning 90.83% 9.90% 1.50% 12,864 17.21%
Shaffer Lower Freeport 95.57% 7.18% 0.77% 13,445 17.75%
Hamer-Byers Upper Freeport 82.71% 12.99% 1.11% - 19.42%
Hamer-Byers Upper Kittanning 85.93% 10.50% 1.84% 12,771 21.34%
Hamer-Byers Middle Kittanning 74.52% 12.16% 1.76% 8,676 16.12%
Will Farm Middle Kittanning 78.13% 10.22% 1.36% 12,799 16.02%
Total 86.74% 9.26% 1.19% 12,924 16.90%
Auger-Minable
Rhoads Upper Kittanning 94.37% 7.95% 0.53% 12,430 18.74%
Rhoads Middle Kittanning 72.69% 13.76% 1.56% 12,234 15.39%
Rhoads Lower Kittanning 80.83% 11.19% 2.08% 12,747 15.88%
Schrock Run Lower Freeport 0.00% 0.00% 0.00% 0 0.00%
Schrock Run Upper Kittanning 90.83% 9.90% 1.50% 12,864 17.21%
Hamer-Byers Upper Freeport 82.71% 12.99% 1.11% 0 19.42%
Hamer-Byers Middle Kittanning 74.52% 12.16% 1.76% 8,676 16.12%
Total 86.97% 10.64% 1.48% 11,483 17.14%
Underground-Mineable
Casselman North Upper Freeport 80.18% 7.89% 1.01% 13,450 18.82%
Casselman Upper Freeport 81.17% 6.98% 1.01% 13,450 19.03%
Acosta Upper Kittanning 78.63% 9.03% 1.61% 13,002 19.72%
Acosta Middle Kittanning 63.20% 11.28% 1.17% 12,601 15.43%
Acosta Lower Kittanning 65.32% 10.14% 1.79% 12,812 17.28%
Horning Lower Freeport 90.49% 5.51% 0.93% 13,533 16.21%
Keyser Lower Kittanning 74.06% 6.68% 1.37% 13,402 18.85%
A Seam Brookville 55.48% 10.30% 0.77% 12,643 17.36%
Total 69.88% 9.05% 1.27% 12,997 18.03%
Total 70.39% 9.06% 1.27% 12,992 18.00%
Source: Technical Report dated December 31, 2020. 17You can also read