Corporate Presentation - Unlocking Colombia March 2022 - Parex Resources
←
→
Page content transcription
If your browser does not render page correctly, please read the page content below
Corporate Presentation
Unlocking Colombia
March 2022

                         1
PXT – Snapshot
        Largest independent Colombian oil & gas company
        Land position of ~5.8MM net acres

        Production and reserves growth
                                                                                                                                                                                                                                                                                           Venezuela
        Growing on an absolute and per share basis

        Industry-leading cash flow netbacks
        Unhedged producer with exposure to Brent oil price

        No debt and return of capital track record
        Over C$1B returned to shareholders since 2017(1)

        Top-tier ESG performance                                                                                                                                                                                                                    COLOMBIA
        Premium scores from independent ESG agencies

Shares Outstanding (basic)(2)                                                                                           118 Million                                                                                                                                                                        Brazil

                                                                                                                                                                                          Ecuador
Market Capitalization(2)                                                                                           ~C$3.3 Billion
                                                                                                                                                                                                                                      Peru
Dividend Yield(3)                                                                                                                       2.0%                                                                                                                                                              PXT Blocks

                           (1) Includes share repurchases via normal course issuer bid and dividends; as at Feb. 28, 2022. (2) As at Feb. 28, 2022. (3) Supplementary financial measure; as at Feb. 28, 2022 and calculated as annualized dividends per share divided by PXT share price; see advisory.
                                                                                                                                                                                                                                                                                                                       2
Focused Colombian Asset Base
                           Net Acreage (MM)                                           •   Conventional, oil-weighted Colombian producer
6                                                                                         •   Largest independent acreage holder in Colombia
                                               2021 Colombia Bid Round                •   Awarded 18 blocks in 2021 Colombia bid round
                                             Increased Position by ~4.3MM
5                                                                                         •   16 out of the 18 blocks were nominated by PXT in
                                                                                              areas specifically targeted by the company
4
                                                                                          •   Activity commitments are US~$100MM over 3-4
                                                                                              years
3
                                                                                          •   Competitive 9% base royalty rate
                                                                                          •   Commitments are not incremental to current
2
                                                                                              exploration capital plans
                                                                                      •   Strategy to unlock deep portfolio by bringing proven
1
                                                                                          technology to Colombia
                                                                                          •   Horizontal and multilateral drilling
0
    2011    2012   2013   2014   2015   2016     2017    2018   2019    2020   2021
                                                                                          •   Radial drilling and various stimulation technologies
                          Base Net Acreage     YoY Increase

           Significantly improved depth and
                                        Optionality
                                            quality of
                                                    from
                                                       prospect
                                                          industry-leading
                                                                inventory incash
                                                                             2021,
                                                                                 flow
                                                                                    which
                                                                                      generation
                                                                                          provides long-term resource runway

                                                                                                                                                     3
Industry-Leading Profitability
                                                                                                2022E Cash Flow Netback (US$/boe)

45

                              PXT vs. TSX-Listed Companies with >25,000 boe/d of 2022E crude & liquids production
40

35

30

25

20

15

10
      PXT   Peer 1   Peer 2   Peer 3          Peer 4           Peer 5           Peer 6           Peer 7           Peer 8           Peer 9 Peer 10 Peer 11 Peer 12 Peer 13 Peer 14 Peer 15 Peer 16 Peer 17 Peer 18 Peer 19 Peer 20

                         High cash flow netbacks from focused asset base and exposure to global commodity prices

                               Source: BMO Capital Markets (February 23, 2022); strip assumptions: WTI: US$85.77/bbl, Brent: US$88.56/bbl; USD/CAD: 0.78; all CAD cash flow netbacks converted to USD.
                                                                                                                                                                                                                                                   4
                               Peer List: ARX, ATH, BTE, CNQ, CVE, CPG, ERF, FEC, GTE, IMO, IPCO, MEG, NVA, POU, SDE, SU, TVE, TOU, VET, and WCP (TSX-listed companies under BMO coverage with >25,000 b/d of 2022E crude & liquids production).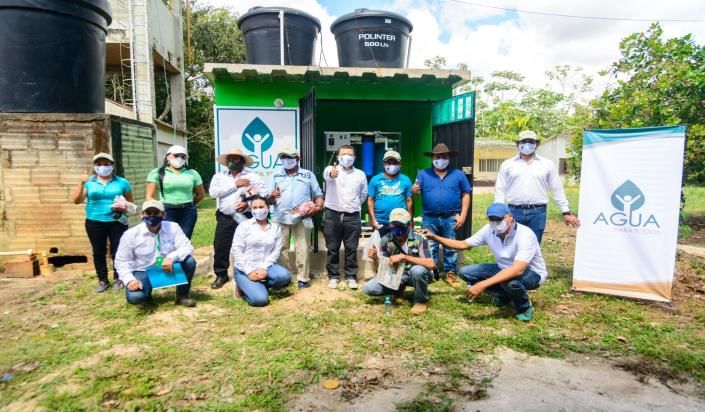
Production and Reserves Growth
                           Production Per Share(1)                                                                                                                                                                 PDP Reserves Per Share(2)

              CAGR
   17.6%    (2017-2022F)                                                                                                               0.18
                                                                                                                                                                       20.8%                         CAGR
                                                                                                                                                                                                  (2017-2021)
                                                                                                                                                                                                                                                                                                             0.66

                                                                                                     0.14
                                  0.13                             0.13                                                                                                                                                                                                                            0.54
                                                                                                                                                                                                                                                      0.48
             0.10
 0.08                                                                                                                                                                                                        0.39
                                                                                                                                                                   0.31

2017A       2018A               2019A                            2020A                             2021A                             2022F (3)                   2017A                                     2018A                                    2019A                                     2020A         2021A
36 mboe/d           Absolute Production Growth CAGR: 8.0%                                                                  53 mboe/d                         51 mmboe                                      Absolute PDP Reserve Growth CAGR: 12.3%                                                        81 mmboe

            Fully Diluted Shares Outstanding (MM)

 164         162
                                  148                                                               >32% Reduction           (2017-2022F)
                                                                                                                                                                                                        Growing on an absolute basis,
                                                                    134
                                                                                                      122
                                                                                                                                       110                                                             with per share metrics boosted by
                                                                                                                                                                                                           share buyback programs

2017A       2018A               2019A                            2020A                             2021A                             2022F (3)

                             (1) Calculated as total annual production divided by year-end fully diluted shares outstanding. (2) Calculated as PDP gross volume divided by year-end fully diluted shares outstanding; see advisory. (3) See slide 10 for information on 2022 corporate guidance.
                                                                                                                                                                                                                                                                                                                    5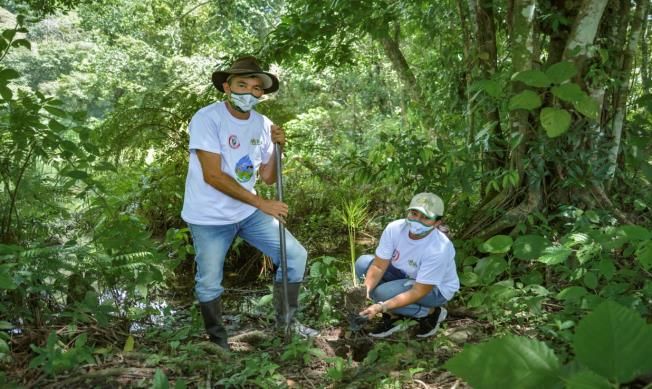
Return of Capital Track Record
                          Summary (C$ MM)                                                                                                                                                                           Levers
$1,350                                                                                               ~$393                 >$1,320
                                                                                                                                                        •         Normal course issuer bid (NCIB) program
$1,200                                                                                                                                                            •         Over past three years have purchased full 10%
                                                                                                                                                                            allowable pursuant to NCIBs
$1,050
                                                                               $334                                                                               •         In 2022, expect to purchase full 10% for the fourth
 $900
                                                                                                                                                                            year in a row
 $750                                                                                                                                                             •         Since 2017, have returned over C$940MM to
                                                        $230                                                                                                                shareholders through share repurchases(1)
 $600
                                                                                                                                                        •         Quarterly dividend
 $450
                                 $300
                                                                                                                                                                  •         Initiated regular dividend in Q3 2021
 $300
                                                                                                                                                                  •         Approved 12% increase to C$0.14 per share in
 $150
                 $55
                                                                                                                                                                            February 2022
          $9
   $0                                                                                                                                                                             No debt and US$326MM(2) of working capital
                                                                                                                 (3)
         2017A   2018A         2019A                   2020A                  2021A                   2022F                   Total
                                                                                                                                                                           provides optionality to further enhance shareholder returns
                         Share Buyback                               Dividend

                                Management track record of consistent and prudent return of capital measures

                           (1) From 2017 to February 28, 2022. (2) As at December 31, 2021; capital management measure; see advisory. (3) PXT share price assumption of C$28 per share; USD/CAD assumption: 0.80.
                                                                                                                                                                                                                                         6
ESG Priorities

Environment                                               Social                                          Governance

          Introduced GHGs emissions intensity                      Water for All – increase community
          reduction targets (mid-term target: 50%
                                                                                                                       2023 diversity target
          reduction by 2030 from 2019 levels)
                                                                   access to clean water                               board gender diversity of at least 30%

          Investing in geothermal and solar energies to
                                                                   Clean Energy Program                                20% of 2022 variable
          Lower carbon footprint                                   improve community access to
          from operated fields’ power generation                                                                       compensation linked to ESG metrics
                                                                   electricity using renewables sources

          Reduce GHG emissions/boe                                 Provide on-going community                          Transparency & disclosure
          ~14% intensity reduction in 2021                                                                             through recognized ESG frameworks and
                                                                   support during the COVID-19 Pandemic                standards (TCFD, UNGC, SASB, GRI)

          Biodiversity & land protection                                                                               Shareholder return through
          tree planting, repopulation of vulnerable                Implement corporate DE&I      Plan                  share buybacks & dividends
          turtles & protection of forests

                                                                                                                                                                7
ESG Performance
Environment
~14% reduction in scopes 1 & 2 GHG emissions intensity to ~20 Kg CO2e/boe in
2021 from 23 Kg CO2e/boe in the prior year ESG Score Rating: 72
Top Score among Canadian peers
67,124 Mt CO2e emissions avoided
Scale: 0 to 100 top score
Geothermal energy power generation installed
Social Rating: 29.5
10th percentile among global E&Ps
Strong safety record – Zero employees LTI and TRIF since 2016 Scale: 0 to 50 high exposure
Over 12,706 people gained access to clean water through Parex’s water initiatives
Rating: A
US$11MM invested in programs that impact the UN Sustainable Development 2nd Quartile – E&Ps in MSCI ACWI Index
Goals (SDGs: 1, 3, 6, 11 & 15)
Scale: CCC to AAA
Governance
30% Board gender diversity by May 2023 Environment: 1
Social: 1
8 out 9 independent directors Governance: 4
Top quartile among TSX Energy peers
Board oversight over ESG performance
Quality Score
Scale: 1 low risk to 10 high risk
Member of the S&P/TSX Composite ESG Index
Ratings as at March 2022; ESG ratings/data/logo do not constitute a sponsorship, endorsement, recommendation, or promotion of Parex by the rating agencies; ratings and data are the property of the agencies and are provided ‘as-is’ and without warranty.
82022 and Long-Term Vision
92022 Corporate Guidance
2020A 2021A 2022F(1)
Brent (US$/bbl) $43 $71 $80
Production (boe/d) 46,518 46,998 53,000
Production Growth -12% 1% 13%
Production Growth (per share)(2) -7% 12% 23%
Shares Repurchased (MM) 14 13 12
Year-End Shares Outstanding (fully diluted; MM) 134 122 110
US$
Funds Flow Provided by Operations (“FFO”) (MM)(3) $297 $578 $716
FFO (per share basic)(4) $2.15 $4.61 $6.30
Capital Expenditures (MM)(5) $141 $277 $425
Free Funds Flow (MM)(5) $156 $301 $290
C$
FFO (per share basic)(4) $2.88 $5.76 $7.88
Dividend (per share)(6) $0.00 $0.50 $0.54(7)
Combination of profitable production growth and return of capital measures
(1) US$80/bbl Brent case based on netback sensitivity estimate from most recent guidance (see November 3, 2021 news release); mid-point of guidance; USD/CAD assumption: 0.80. (2) Weighted-average basic shares outstanding used.
10
(3) Capital management measure; see advisory. (4) Non-GAAP ratio; see advisory. (5) Non-GAAP financial measure; see advisory. (6) Supplementary financial measure; see advisory. (7) Based on annualized quarterly dividend.2022 Capital Allocation
2022F Capital Allocation (US$ MM)
$800
$90/bbl
$80/bbl
$600 ~$265 ~$325
$425
25%
$400 Exploration
2022F Production Guidance
$70/bbl 10% Appraisal
Brent • 52,000-54,000 boe/d
65% • +13% YoY growth
$200
Development
• +23% YoY per share growth
$50
$0
(6)
FFO (1) Dividend (2)(5) Capex (3) Share Buyback (4)(5) Working Capital
In 2022, plan to return over US$300MM to shareholders while growing production and inventory
(1) FFO sensitivity based on netback sensitivity estimate from most recent guidance (see November 3, 2021 news release); capital management measure; see advisory. (2) Based on annualized C$0.14 per share quarterly dividend. (3) Non-GAAP measure financial measure; see advisory.
11
(4) PXT share price assumption of C$28 per share. (5) USD/CAD assumption: 0.80. (6) Capital management measure; see advisory.2022 First-Mover Advantage
• Entering the year with the most extensive land base in the
company’s history
• Secured rigs under long-term contracts to have equipment
in place to successfully execute capital investment
programs
• Increased critical organizational capabilities, hiring
significant staff in Canada and Colombia over the past 12
months
• Acquired long-lead items for the foreseeable future to
provide insulation from supply chain issues and limit cost
inflation exposure
Parex is 100% unhedged to commodity prices
and positioned to harvest the upside opportunity
from the current market cycle
122022 Activity Plan
Area Summary 2022F Capex Allocation (US$ MM)
Llanos LLA-34 (Non-Operated)
• Base production area $105
• Capital Expenditure: $90-100 million
$425
• Well Program: 23-26 Midpoint
$270
$50
Llanos (Operated)
• Development area with near field exploration
• Capital Expenditure: $170-180 million Development Appraisal Exploration
• Well Program: 13-17
Llanos 2022F Wells (Gross)
Magdalena LLA-34
35-45
• Exploitation area with near field exploration Llanos
• Capital Expenditure: $110-120 million Magdalena
• Well Program: 8-12
15-18
High-Risk, High-Reward Exploration
• Long-term exploration
• Capital Expenditure: $30-50 million
• Well Program: 6-8 Base Development Appraisal & Exploration
Well program subject to change throughout the year.
13Long-Term Production Vision
Illustrative Production Growth (boe/d)(1)
100,000 Ambition
High-risk, high-reward exploration
Exploration plus Magdalena exploitation upside that can
80,000 Longer-term exploitation upside using proven
provide a possible step change in the production profile
technology to unlock material original oil in place
60,000
Low-risk, short- and medium-term
production growth
Llanos – Base Development
40,000
“Parex’s bread and butter”
20,000
Llanos – LLA-34 Continue optimizing block to
maximize free cash flow
0
2022F 2022F 2023F 2023F 2024F
2024F 2025F
2025F 2026F
2026F 2027F
2027F
Ambition to grow to 100,000 boe/d and become multi-field operator
(1) 2023 and beyond provided for illustrative purposes only; budgets and forecast beyond 2022 have not been finalized and are subject to a variety of factors, including prior year result; see advisory.
14Long-Term Return of Capital Framework
1. Sustainable business – invest approximately two thirds of FFO into our business
Invest in long-term growth and replenish development inventory
Investing ~US$425MM across development,
• Continuous investment required to maintain high-quality portfolio in order to support future exploitation and exploration work in 2022
return of capital activity and maximize total shareholder returns over the long term
2. Return capital to shareholders – return at least one third of FFO to shareholders
A) Quarterly base dividend
• Maintain dividend and work to grow it with earnings and macroeconomic outlook Initiated quarterly dividend in Q3 2021 and
increased it by 12% to C$0.14 per share in
• Robust even in low commodity price environments; at $40/bbl Brent, the current base February 2022
dividend isKey Takeaways
Focused on unlocking Colombian asset portfolio
through technology
First-mover advantage: acreage to explore, secured
rigs and long-lead items, and strengthened team
Balanced capital investment plan that has strong
production per share growth expected in 2022
Unhedged, with industry-leading cash flow netbacks
exposed to Brent oil price
Repurchased over 47 million shares since 2017(1)
and have upside dividend growth potential
ESG performer with ambition to become one of the
least GHG-intensive O&G E&P companies
(1) As at Feb. 28, 2022.
16Advisories
This presentation is provided for informational purposes only as of March 1, 2022, is not complete and may not contain certain material information about Parex Resources Inc. ("Parex" or
the "Company"), including important disclosures and risk factors associated with an investment in Parex. This presentation does not take into account the particular investment objectives
or financial circumstances of any specific person who may receive it and does not constitute an offer to sell or a solicitation of an offer to buy any security in Canada, the United States or
any other jurisdiction. The contents of this presentation have not been approved or disapproved by any securities commission or regulatory authority in Canada, the United Sates or any
other jurisdiction, and Parex expressly disclaims any duty on Parex to make disclosure or any filings with any securities commission or regulatory authority, beyond that imposed by
applicable laws.
PAREX RESOURCES INC.
Forward-Looking Statements and Financial Outlook
2700 Eighth Avenue Place, West Tower
Certain information regarding Parex set forth in this document contains forward-looking statements that involve substantial known and unknown risks and uncertainties. The use of any of
the words "plan", "expect", “prospective”, "project", "intend", "believe", "should", "anticipate", "estimate" or other similar words, or statements that certain events or conditions "may" or 585 8th Avenue SW Calgary, AB
"will" occur are intended to identify forward-looking statements. Such statements represent Parex' internal projections, estimates or beliefs concerning, among other things, future growth,
results of operations, production, future capital and other expenditures (including the amount, nature and sources of funding thereof), plans for and results of drilling activity, business
T2P 1G1 Canada
prospects and opportunities. These statements are only predictions and actual events or results may differ materially. Although the Company’s management believes that the expectations
reflected in the forward-looking statements are reasonable, it cannot guarantee future results, levels of activity, performance or achievement since such expectations are inherently subject Tel: 403-265-4800
to significant business, economic, competitive, political and social uncertainties and contingencies. Many factors could cause Parex' actual results to differ materially from those expressed
or implied in any forward-looking statements made by, or on behalf of, Parex. Fax: 403-265-8216
Email: investor.relations@parexresources.com
In particular, forward-looking statements contained in this document include, but are not limited to, statements with respect to the performance characteristics of the Company's oil
properties; the Company's vision, strategy and values; the Company's (and its peer's) estimated 2022 cash flow netbacks; the Company's expectations of the amount of capital it will return Website: www.parexresources.com
to its shareholders through dividends, including its regular quarterly dividend, and share repurchases; the Company's plans to repurchase 10% of its public float pursuant to its NCIB in
2022; that Parex will continue to pay its regular quarterly dividend; Parex’s target board representation of women and the anticipated timing thereof; Parex’s GHG emissions intensity
reduction targets and the anticipated timing thereof; that Parex will invest in geothermal and solar energies to lower its carbon footprint; that Parex will increase community access to Mike Kruchten
clean water and electricity and provide other on-going community support during the COVID-19 pandemic; Parex’s 2022 corporate guidance and in particular the information contained on
slide 10; Parex’s anticipated 2022 capital allocation as disclosed on slide 11 and its plans to return over US$300MM to shareholders while growing production and inventory; Parex’s 2022
Sr. Vice President, Capital Markets & Corporate Planning
production guidance; the anticipated activities to be taken in certain areas in 2022 including Parex’s anticipated capex allocation and well program; the Company's drilling plans and
production capability/potential; anticipated drilling locations, including the Company's delineation and drilling plans; Parex’s anticipated growth in production and the anticipated timing
thereof, in particular the long-term illustrative production growth information on slide 14; Parex' ability to unlock large original oil in place and grow production and become a multi-field,
Steven Eirich
multi-basin operator; Parex’s expectations that it will invest approximately two thirds of FFO into its business and the anticipated benefits to be derived therefrom; Parex’s expected
Investor Relations & Communications Advisor
investments in development, exploitation and exploration work in 2022; Parex’s expectations that its quarterly dividend will be sustainable in lower commodity price environments; and
Parex’s plans to become one of the least GHG-intensive O&G E&P companies. Statements relating to "reserves" or "resources" are forward-looking statements, as they involve the implied
assessment, based on estimates and assumptions that the reserves and resources described exist in the quantities predicted or estimated and can be profitably produced in the future.
17Advisories
Forward-Looking Statements and Financial Outlook (Continued)
These forward-looking statements are subject to numerous risks and uncertainties, including but not limited to, the impact of general economic conditions in Canada and Colombia; industry conditions including changes in laws and regulations including adoption of new environmental laws and regulations, and changes
in how they are interpreted and enforced, in Canada and Colombia; competition; lack of availability of qualified personnel; the results of exploration and development drilling and related activities; risks related to obtaining required approvals of regulatory authorities, in Canada and Colombia and partner and
community approvals in Colombia; risks associated with negotiating with foreign governments as well as country risk associated with conducting international activities; volatility in market prices for oil; fluctuations in foreign exchange or interest rates; environmental risks; changes in income tax laws, tax rates and/or
incentive programs relating to the oil industry; changes to pipeline capacity; ability to access sufficient capital from internal and external sources; failure of counterparties to perform under the terms of their contracts; risk that Parex’ evaluation of its existing portfolio of assets and exploration and development
opportunities is not consistent with its expectation’s; that production test results may not be indicative of long-term performance or ultimate recovery; risk that Parex will not have sufficient financial resources in the future to pay a dividend; risk that the Board does not declare dividends in the future, that there is no
base dividend growth and/or that Parex' dividend policy changes; risk that the amount of FFO to be returned to shareholders is less than anticipated; risk that the amount invested by Parex in development, exploitation and exploration in 2022 will be less than anticipated; that Parex will not repurchase 10% of the
Company's float in 2022; that Parex will be unable to meet its GHG emissions intensity reduction targets or lower its carbon footprint; and other factors, many of which are beyond the control of the Company. Readers are cautioned that the foregoing list of factors is not exhaustive. Additional information on these and
other factors that could effect Parex' operations and financial results are included in reports on file with Canadian securities regulatory authorities and may be accessed through the SEDAR website (www.sedar.com).
Although the forward-looking statements contained in this document are based upon assumptions which management believes to be reasonable, the Company cannot assure investors that actual results will be consistent with these forward-looking statements. With respect to forward-looking statements contained in
this document, Parex has made assumptions regarding, among other things: current commodity prices and royalty regimes; availability of skilled labour; timing and amount of capital expenditures; future exchange rates; the price of oil, including the anticipated Brent oil price; the impact of increasing competition;
conditions in general economic and financial markets; availability of drilling and related equipment; effects of regulation by governmental agencies; receipt of partner, regulatory and community approvals; royalty rates; future operating costs; effects of regulation by governmental agencies; uninterrupted access to
areas of Parex' operations and infrastructure; recoverability of reserves and future production rates; the status of litigation; timing of drilling and completion of wells; on-stream timing of production from successful exploration wells; operational performance of non-operated producing fields; pipeline capacity; that
Parex will have sufficient cash flow, debt or equity sources or other financial resources required to fund its capital and operating expenditures and requirements as needed; that Parex' conduct and results of operations will be consistent with its expectations; that Parex will have the ability to develop it's oil and gas
properties in the manner currently contemplated; current or, where applicable, proposed industry conditions, laws and regulations will continue in effect or as anticipated as described herein; that the estimates of Parex' reserves volumes and the assumptions related thereto (including commodity prices and
development costs) are accurate in all material respects; that Parex will be able to obtain contract extensions or fulfill the contractual obligations required to retain its rights to explore, develop and exploit any of its undeveloped properties; that Parex will have sufficient financial resources in the future to pay a
dividend; that the Board will declare dividends in the future; that Parex will have sufficient financial resources to repurchase shares under its NCIB; that investments in geothermal and solar energies will lead to a lower carbon footprint; and other matters.
Management has included the above summary of assumptions and risks related to forward-looking information provided in this document in order to provide shareholders with a more complete perspective on Parex' current and future operations and such information may not be appropriate for other purposes.
Parex' actual results, performance or achievement could differ materially from those expressed in, or implied by, these forward-looking statements and, accordingly, no assurance can be given that any of the events anticipated by the forward-looking statements will transpire or occur, or if any of them do, what
benefits Parex will derive. These forward-looking statements are made as of the date of this document and Parex disclaims any intent or obligation to update publicly any forward-looking statements, whether as a result of new information, future events or results or otherwise, other than as required by applicable
securities laws. The forward-looking statements contained in this presentation are expressly qualified by this cautionary statement.
This document also contains a financial outlook, in particular: Parex’s estimated 2022 cash flow netbacks; Parex’s 2022 corporate guidance and in particular the information contained on slide 10; Parex’s anticipated 2022 capital allocation as disclosed on slide 11; Parex’s anticipated 2022 capex allocation; Parex’s
expectations that it will invest approximately two thirds of FFO into its business and benefits to be derived therefrom; and Parex’s expected investments in development, exploitation and exploration work in 2022. Such financial outlook has been prepared by Parex’s management to provide an outlook of the Company's
activities and results. The financial outlook has been prepared based on a number of assumptions including the assumptions discussed above and assumptions with respect to the costs and expenditures to be incurred by the Company, capital equipment and operating costs, foreign exchange rates, taxation rates for
the Company, general and administrative expenses and the prices to be paid for the Company's production. Management does not have firm commitments for all of the costs, expenditures, prices or other financial assumptions used to prepare the financial outlook or assurance that such operating results will be
achieved and, accordingly, the complete financial effects of all of those costs, expenditures, prices and operating results are not objectively determinable. The actual results of operations of the Company and the resulting financial results will likely vary from the amounts set forth in the analysis presented in this
presentation, and such variation may be material. The Company and its management believe that the financial outlook has been prepared on a reasonable basis, reflecting the best estimates and judgments, and represent, to the best of management's knowledge and opinion, Parex’s expected expenditures and results
of operations. However, because this information is highly subjective and subject to numerous risks including the risks discussed above, it should not be relied on as necessarily indicative of future results. Except as required by applicable securities laws, Parex undertakes no obligation to update such financial outlook.
The future acquisition by the Company of the Company's shares pursuant to a NCIB, if any, and the level thereof is uncertain. Any decision to continue with an NCIB or acquire shares of the Company will be subject to the discretion of the Board and may depend on a variety of factors, including, without limitation, the
Company's business performance, financial condition, financial requirements, growth plans, expected capital requirements and other conditions existing at such future time including, without limitation, contractual restrictions, satisfaction of the solvency tests imposed on the Company under applicable corporate law
and receipt of regulatory approvals for any renewal of the NCIB. There can be no assurance that the Company will buyback any shares of the Company in the future.
18Advisories
Non-GAAP and Other Financial Measures Advisory
This presentation uses various "non-GAAP financial measures", "non-GAAP ratios", "supplementary financial measures" and "capital management measures" (as such terms are defined in National Instrument 52-112 – Non-GAAP and Other Financial Measures Disclosure ("NI 52-112")). Such measures are not
standardized financial measures under generally accepted accounting principles ("GAAP") for publicly accountable enterprises in Canada, and might not be comparable to similar financial measures disclosed by other issuers. Such financial measures should not be considered as alternatives to, or more meaningful than
measures determined in accordance with GAAP. These measures facilitate management’s comparisons to the Company’s historical operating results in assessing its results and strategic and operational decision-making and may be used by financial analysts and others in the oil and natural gas industry to evaluate the
Company’s performance. Further, management believes that such financial measures are useful supplemental information to analyze operating performance and provide an indication of the results generated by the Company's principal business activities. Please refer to the Company's Management’s Discussion and
Analysis of the financial condition and results of operations for the three months and year ended December 31, 2021 and 2020 dated March 1, 2022 (the "MD&A"), which is available at the Company's website at www.parexresources.com and on the Company's profile on SEDAR at www.sedar.com for additional
information about such financial measures, including reconciliations to the nearest GAAP measures, as applicable.
• Dividend yield, is a supplementary financial measure and defined as annualized dividends per share divided by PXT share price.
• Working capital surplus, is a non-GAAP capital management measure that the Company uses to describe its liquidity position and ability to meet its short-term liabilities. Working Capital Surplus is defined as current assets less current liabilities.
• Funds flow provided by operations, is a non-GAAP capital management measure that includes all cash generated from operating activities and is calculated before changes in non-cash working capital.
• Funds flow provided by operations per share, is a non-GAAP financial ratio that is calculated by dividing funds flow provided by operations by the weighted average number of basic shares outstanding.
• Capital expenditures, is a non-GAAP financial measure which the Company uses to describe its capital costs associated with Oil and Gas expenditures. The measure considers both Property, Plant and Equipment expenditures and Exploration and Evaluation asset expenditures which are items in the Company’s
statement of Cash Flows for the period.
• Free funds flow, is a non-GAAP measure that is defined as funds flow provided by operations less capital expenditures. The Company considers free funds flow or free cash flow to be a key measure as it demonstrates Parex’s ability to fund return of capital, such as the NCIB, without accessing outside funds.
• Dividends per share, is a supplementary financial measure comprised of dividends declared, dividends by the number of shares outstanding.
Dividend Advisory
Future dividend payments, if any, and the level thereof is uncertain. The Company's dividend policy and any decision to pay further dividends on the common shares, including any special dividends, will be subject to the discretion of the Board and may depend on a variety of factors, including, without limitation the
Company's business performance, financial condition, financial requirements, growth plans, expected capital requirements and other conditions existing at such future time including, without limitation, contractual restrictions and satisfaction of the solvency tests imposed on the Company under applicable corporate
law. The actual amount, the declaration date, the record date and the payment date of any dividend are subject to the discretion of the Board. There can be no assurance that dividends will be paid at the intended rate or at any rate in the future.
Oil & Gas Information and Reserve Advisory
"BOEs" may be misleading, particularly if used in isolation. A BOE conversion ratio of six thousand cubic feet of natural gas to one barrel of oil equivalent (6 mcf:1 bbl) is based on an energy equivalency conversion method primarily applicable at the burner tip and does not represent a value equivalency at the wellhead.
Given that the value ratio based on the current price of crude oil as compared to natural gas is significantly different from the energy equivalency of 6:1, utilizing a conversion on a 6:1 basis may be misleading as an indication of value. “Proved Developed Producing Reserves" are those reserves that are expected to be
recovered from completion intervals open at the time of the estimate. These reserves may be currently producing or, if shut-in, they must have previously been on production, and the date of resumption of production must be known with reasonable certainty. The estimates of Parex’s reserves set forth in this
presentation have been prepared by GLJ Ltd. ("GLJ") Each GLJ Report was prepared in accordance with definitions, standards and procedures contained in the Canadian Oil and Gas Evaluation Handbook ("COGE Handbook") and National Instrument 51-101 - Standards of Disclosure for Oil and Gas Activities ("NI 51-
101"). Additional reserve information as required under NI 51-101 was included in the Company's Annual Information Form for the 2021 fiscal year which is available on SEDAR. The recovery and reserve estimates provided in this presentation are estimates only, and there is no guarantee that the estimated reserves
will be recovered. Actual reserves may eventually prove to be greater than, or less than, the estimates provided herein.
Market, Independent Third-Party and Industry Data
Certain market, independent third party and industry data contained in this presentation is based upon information from government or other independent industry publications and reports or based on estimates derived from such publications and reports. Government and industry publications and reports generally
indicate that they have obtained their information from sources believed to be reliable, but none of Parex or its affiliates have conducted their own independent verification of such information. This presentation also includes certain data derived from independent third parties, including, but not limited to, the
anticipated cash flow netbacks of Parex’s peers. While Parex believes this data to be reliable, market and industry data is subject to variations and cannot be verified with complete certainty due to limits on the availability and reliability of raw data, the voluntary nature of the data gathering process and other
limitations and uncertainties inherent in any statistical survey. None of Parex or its affiliates have independently verified any of the data from independent third-party sources referred to in this presentation or ascertained the underlying assumptions relied upon by such sources.
Information Regarding Public Issuer Counterparties
Certain information contained in this presentation relating to the Company's public issuer counterparties and the nature of their respective businesses is taken from and based solely upon information published by such issuers. None of Parex or its affiliates have independently verified the accuracy or completeness of
any such information.
19You can also read