Corporate Presentation - March 2022 TSX: IMG l NYSE: IAG
←
→
Page content transcription
If your browser does not render page correctly, please read the page content below
MARCH 2022 CORPORATE PRESENTATION

Corporate Presentation
              TSX: IMG l NYSE: IAG
March 2022          www.iamgold.com
                     TSX: IMG l NYSE: IAG l www.iamgold.com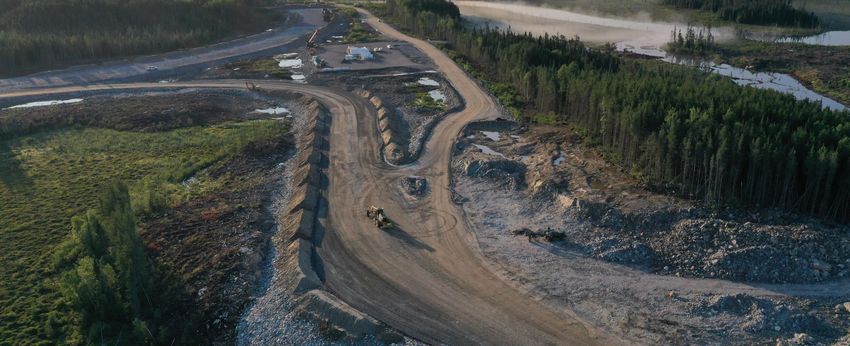
MARCH 2022 CORPORATE PRESENTATION

Cautionary Statement
CAUTIONARY STATEMENT REGARDING FORWARD-LOOKING INFORMATION
Information included in this presentation, including statements with respect to the Company’s future financial or operating performance and other statements that express management’s expectations or estimates of future performance, including statements in respect of the prospects and/or
development of the Company’s projects, other than statements of historical fact, constitutes forward-looking information or forward-looking statements within the meaning of applicable securities laws (collectively referred to herein as “forward-looking statements”) and such forward-looking
statements are based on expectations, estimates and projections as of the date of this news release. Forward-looking statements are provided for the purpose of providing information about management’s current expectations and plans relating to the future. Forward-looking statements are
generally identifiable by the use of words such as “may”, “will”, “should”, “continue”, “expect”, "budget", "forecast", “anticipate”, “estimate”, “believe”, “intend”, “plan”, "schedule", “guidance”, “outlook”, “potential”, “seek”, “targets”, “strategy”, or “project” or the negative of these words or other
variations on these words or comparable terminology. Forward-looking statements in this news release include, but are not limited to, statements with respect to: the Company’s guidance for production, including timing and amounts thereof; costs of production; costs of sales; cash costs; all-
in sustaining costs; construction costs and site expenditures; the impact of COVID-19 on the Company, including its operations, the project schedule for Côté Gold, key inputs, staffing and contractors; depreciation expense; effective tax rate; expected capital expenditures; operations
outlook; expected benefits from the operational improvements and de-risking strategies enacted by the Company; the Company's plan achieve net zero emissions; the resumption of strategic mine development activities; development and expansion projects; exploration; impairment
assessments and estimates; the expected receipt of permits; permitting timelines; sale transactions; the future price of gold and other commodities; foreign exchange rates and currency fluctuations; requirements for additional capital; the Company's capital allocation; the estimation of
mineral reserves and mineral resources; the realization of mineral reserve and mineral resource estimates; and the timing for completion of construction of Côté Gold and the commencement of commercial production.
The Company cautions the reader that forward-looking statements are necessarily based upon a number of estimates and assumptions that, while considered reasonable by management, are inherently subject to significant business, financial, operational and other risks, uncertainties,
contingencies and other factors, including those described below, which could cause actual results, performance or achievements of the Company to be materially different from results, performance or achievements expressed or implied by such forward-looking statements and, as such,
undue reliance must not be placed on them. Forward-looking statements are also based on numerous material factors and assumptions, including as described in this news release, including with respect to: the Company's present and future business strategies; operations performance
within expected ranges; anticipated future production and cash flows; local and global economic conditions and the economic environment in which the Company will operate in the future; legal and political developments in the jurisdictions in which the Company operates; the price of gold
and other key commodities; projected mineral grades; international exchanges rates; anticipated capital and operating costs; the availability and timing of required governmental and other approvals for the construction of the Company's projects.
Risks, uncertainties, contingencies and other factors that could cause actual results, performance or achievements of the Company to be materially different from results, performance or achievements expressed or implied by such forward-looking statements include, without limitation: the
Company's business strategies and its ability to execute thereon; political and legal risks; the ongoing impact of COVID-19 and its variants on the Company and its workforce, the availability of labour and contractors, key inputs for the Company and global supply chains; the volatility of the
Company's securities; potential engagements with activist shareholders; litigation; contests over title to properties, particularly title to undeveloped properties; mine closure and rehabilitation risks; management of certain of the Company's assets by other companies or joint venture partners;
the lack of availability of insurance covering all of the risks associated with a mining company's operations; business risks, including pandemics, adverse environmental conditions and hazards; unexpected geological conditions; potential shareholder dilution; increasing competition in the
mining sector; the profitability of the Company being highly dependent on the condition and results of the mining industry as a whole, and the gold mining industry in particular; changes in the global prices for gold and certain other commodities (such as diesel and electricity); consolidation in
the gold mining industry; legal, litigation, legislative, political or economic risks and new developments in the jurisdictions in which the Company carries on business; government actions taken in response to COVID-19, including new variants of COVID-19, and any worsening thereof;
changes in taxes, including mining tax regimes; the failure to obtain in a timely manner from authorities key permits, authorizations or approvals necessary for exploration, development or operation, operating or technical difficulties in connection with mining or development activities,
including geotechnical difficulties and major equipment failure; seismic activity; the inability to participate in any gold price increase above the cap in any collar transaction entered into in conjunction with certain gold sale prepayment arrangements; the availability of capital; the level of
liquidity and capital resources; access to capital markets and financing; the Company's level of indebtedness; the Company's ability to satisfy covenants under its outstanding debt instruments; changes in interest rates; adverse changes in the Company’s credit rating; the Company's choices
in capital allocation; effectiveness of the Company's ongoing cost containment efforts; the ability to execute on the Company's de-risking activities and measures to improve operations; risks related to third-party contractors, including reduced control over aspects of the Company's
operations and/or the failure of contractors to perform; risks arising from holding derivative instruments; changes in U.S. dollar and other currency exchange rates, interest rates or gold lease rates; capital and currency controls in foreign jurisdictions; assessment of carrying values for the
Company’s assets, including the ongoing potential for material impairment and/or write-downs of such assets; the speculative nature of exploration and development, including the risks of diminishing quantities or grades of reserves; the fact that reserves and resources, expected
metallurgical recoveries, capital and operating costs are estimates which may require revision; the presence of unfavourable content in ore deposits, including clay and coarse gold; inaccuracies in life of mine plans; failure to meet operational targets; equipment malfunctions; security risks,
including civil unrest, war or terrorism; information systems security threats and cybersecurity; laws and regulations governing the protection of the environment; employee relations and labour disputes; the maintenance of tailings storage facilities and the potential for a major spill or failure of
the tailings facilities due to uncontrollable events, such as extreme weather or seismic events; lack of reliable infrastructure, including access to roads, bridges, power sources and water supplies; physical and regulatory risks related to climate change; the potential direct or indirect
operational impacts resulting from external factors, including infectious diseases or pandemics, such as COVID-19, unpredictable weather patterns and challenging weather conditions; attraction and retention of key employees and other qualified personnel; availability and increasing costs
associated with mining inputs and labour; the availability of qualified contractors and the ability of contractors to timely complete projects on acceptable terms; the relationship with the communities surrounding the Company's operations and projects; indigenous rights or claims; illegal mining;
and the inherent risks involved in the exploration, development and mining industry generally. Please see the Company’s AIF or Form 40-F available on www.sedar.com or www.sec.gov/edgar.shtml for a comprehensive discussion of the risks faced by the Company and which may cause
actual results, performance or achievements of the Company to be materially different from results, performance or achievements expressed or implied by forward-looking statements.
Although the Company has attempted to identify important factors that could cause actual results to differ materially from those contained in forward-looking statements, there may be other factors that cause results not to be as anticipated, estimated or intended. The Company disclaims any
intention or obligation to update or revise any forward-looking statements whether as a result of new information, future events or otherwise except as required by applicable law.

                                                                                                                                                                                                                                                                                                               2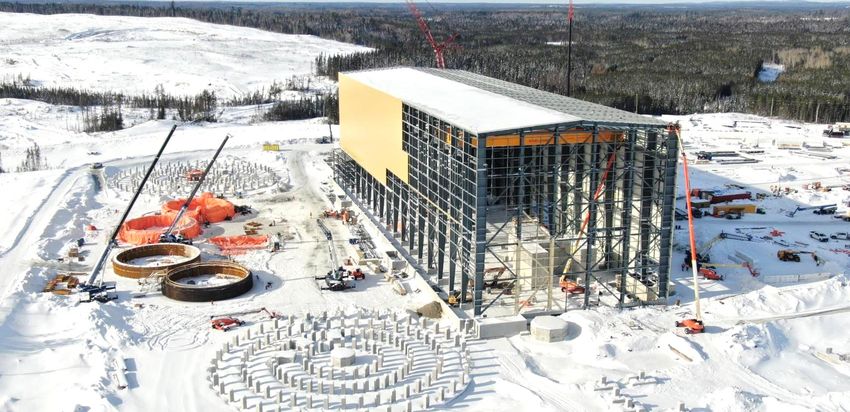
MARCH 2022 CORPORATE PRESENTATION

Technical Information and Qualified Persons
CAUTIONARY NOTE TO U.S. INVESTORS REGARDING DISCLOSURE OF MINERAL RESERVE AND MINERAL RESOURCE ESTIMATES
The mineral resource and reserve estimates contained in this presentation have been prepared in accordance with NI 43-101 and the Canadian Institute of Mining, Metallurgy and Petroleum (“CIM”) – CIM Definition Standards on Mineral Resources and Mineral Reserves, adopted by the
CIM Council, as amended (the “CIM Standards”). These standards are similar to those used by the United States Securities and Exchange Commission (the “SEC”) Industry Guide No. 7, as interpreted by SEC staff (“Industry Guide 7”). However, the definitions in NI 43-101 and the CIM
Standards differ in certain respects from those under Industry Guide 7. Accordingly, mineral resource and reserve information contained in this news release may not be comparable to similar information disclosed by United States companies. Under Industry Guide 7, mineralization may not
be classified as a "reserve" unless the determination has been made that the mineralization could be economically and legally produced or extracted at the time the reserve determination is made.
As a result of the adoption of amendments to the SEC’s disclosure rules (the “SEC Modernization Rules”), which more closely align its disclosure requirements and policies for mining properties with current industry and global regulatory practices and standards, including NI 43-101 and the
CIM Standards, and which became effective on February 25, 2019, the SEC now recognizes estimates of "measured mineral resources", "indicated mineral resources" and "inferred mineral resources." In addition, the SEC has amended definitions of "proven mineral reserves" and "probable
mineral reserves" in its amended rules, with definitions that are substantially similar to those used in NI 43-101 and the CIM Standards. Issuers must begin to comply with the SEC Modernization Rules in their first fiscal year beginning on or after January 1, 2021, though Canadian issuers
that report in the United States using the Multijurisdictional Disclosure System ("MJDS") may still use NI 43-101 rather than the SEC Modernization Rules when using the SEC's MJDS registration statement and annual report forms.
United States investors are cautioned that while the SEC now recognizes "measured mineral resources", "indicated mineral resources" and "inferred mineral resources" under the SEC Modernization Rules, investors should not assume that any part or all of the mineral deposits in these
categories will ever be converted into a higher category of mineral resources or into mineral reserves. These terms have a great amount of uncertainty as to their economic and legal feasibility. Under Canadian regulations, estimates of inferred mineral resources may not form the basis of
feasibility or pre-feasibility studies, except in limited circumstances.
Investors are cautioned not to assume that any "measured mineral resources", "indicated mineral resources", or "inferred mineral resources" that the Company reports in this news release are or will be economically or legally mineable. Further, "inferred mineral resources" have a great
amount of uncertainty as to their existence and as to their economic and legal feasibility. It cannot be assumed that any part or all of an inferred mineral resource will ever be upgraded to a higher category.

QUALIFIED PERSON AND TECHNICAL INFORMATION
The technical and scientific information relating to exploration activities disclosed in this document was prepared under the supervision of and verified and reviewed by Craig MacDougall, P.Geo., Executive Vice President, Growth, IAMGOLD. Mr. MacDougall is a “qualified person” (a “QP”)
as defined by National Instrument 43-101 – Standards of Disclosure for Mineral Projects (“NI 43-101”).
Data verification involves data input and review by senior project geologists at site, scheduled weekly and monthly reporting to senior exploration management and the completion of project site visits by senior exploration management to review the status of ongoing project activities and data
underlying reported results. All drilling results for exploration projects or supporting resource and reserve estimates referenced in this news release have been previously reported in news release disclosures either by the Company or the project operator as the case may be (see referenced
news releases) and have been prepared in accordance with NI 43-101. The sampling and assay data from drilling programs are monitored through the implementation of a quality assurance - quality control (QA-QC) program designed to follow industry best practice. Drill core (HQ and NQ
size) samples are selected by the project geologists and sawn in half with a diamond saw at the project site. Half of the core is typically retained at the site for reference purposes. Generally, sample intervals are 1.0 to 1.5 metres in length and reverse circulation holes are sampled at 1.0
metre intervals at the drill rig. Samples are prepared and analyzed at site for the Company's producing mines and at accredited regional laboratories for the Company's exploration projects, using analysis techniques such as standard fire assay with a 50 gram charge; fire assay with
gravimetric finish, or LeachWELL rapid cyanide leach with fire assay with a 50 gram charge.
Lisa Ragsdale, P.Geo (Director, Mining Geology, IAMGOLD Corporation), is the QP responsible for the review and approval of all mineral resource estimates contained herein, as at December 31, 2021. Guy Bourque, Eng. (Director, Mining, IAMGOLD Corporation), is the QP responsible for
the review and approval of all mineral reserve estimates contained herein, as at December 31, 2021.
The technical information has been included herein with the consent and prior review of the above noted QPs, who have verified the data disclosed, and data underlying the information or opinions contained herein.

NON-GAAP FINANCIAL MEASURES
This presentation contains non-GAAP financial performance measures, including realized gold price per ounce sold, cash costs, cash costs per ounce sold, AISC, AISC per ounce sold, net cash from operating activities before changes in working capital, mine-site free cash flow, available
liquidity, net cash, EBITDA, adjusted EBITDA, adjusted net earnings (loss) attributable to equity holders and adjusted net earnings (loss) per share attributable to equity holders, sustaining capital expenditures, and expansion capital expenditures. The non-GAAP financial measures
disclosures included in the Company’s Q4 2021 MD&A are incorporated by reference in this presentation. Further details on these non-GAAP financial measures are included on pages 33 to 38 of the Company’s Q4 2021 MD&A filed on SEDAR at www.sedar.com and on EDGAR at
www.sec.gov.

                                                                                                                                                                                                                                                                                                   3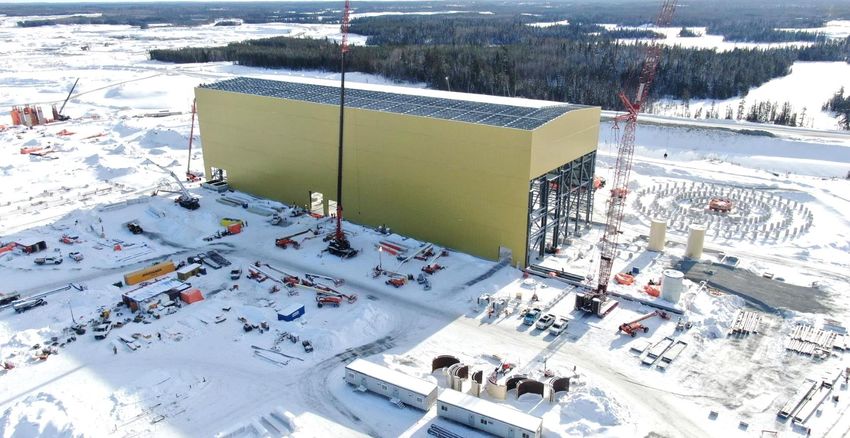
MARCH 2022 CORPORATE PRESENTATION

IAMGOLD – Building a Leading High-Margin Gold Producer

                                FOCUSING ON PROFITABILITY                                                                                  COMMITMENT TO ESG
                                       2021 gold production of 601,000 ounces                                                              Zero Harm® commitment and focus on safety, while building strong
                                                                                                                                           community partnerships
            2022 gold production guidance of 570,000 – 640,000 ounces
                                                                                                                                           Commitment to achieve net negative GHG emissions by 2050
  Prioritizing capital allocation to generate best return on invested capital
                                                                                                                                           Rapid COVID-19 response with robust health & safety protocols
  Developing Côté Gold – a robust, tier I, low-cost and long-life asset on
                              track for H2 2023 commercial production

                                                      FINANCIAL CAPACITY                                                                   ROBUST PIPELINE OF PROJECTS
        Strong liquidity position of ~$1.1 billion1, including $553 million in                                                             Proven exploration program focused on unlocking value in key
        cash & equivalents and $500 million in an undrawn credit facility                                                                  districts with long-term potential near existing infrastructure
                 Commodities/currency risk management program during                                                                       Re-seeding the pipeline with long-term growth: Côté, Bambouk and
                                             construction of Côté Gold                                                                     Chibougamau districts

                         1. Available liquidity is defined as cash and cash equivalents ($545 million), short-term investments ($8 million) and the credit available to be drawn under the credit facility ($498 million). Excludes
                         restricted cash ($42 million). The Company believes this measure provides investors with additional information regarding the liquidity position of the Company.
                                                                                                                                                                                                                                                                4
MARCH 2022 CORPORATE PRESENTATION

Projects Overview
                                                                       ESSAKANE                                                         ROSEBEL                                                     WESTWOOD
                                                              Burkina Faso, West Africa                                       Suriname, South America                                                Quebec, Canada
                                                                         (90% Ownership)                                      (95% RGM | 66.5% Saramacca3)                                                    (100%)
PRODUCTION

               Start-up                                                         2010                                           2004 (Saramacca H2 20)                                                         2014

               Mine type                                                     Open pit                                                        Open pit                                     Underground / Satellite open pit

               Estimated mine life                                            ~20271                                                          ~20332                                                        ~2033+4

               FY 2021 Results2, attributable                              412,000 oz                                                     154,000 oz                                                       35,000 oz
                                                                   ’21 guidance 390-400 koz                                       ’21 guidance 140-160 koz                                         ’21 guidance 35-45 koz

               2022 Guidance2, attributable                        360,000 – 385,000 oz                                           155,000 – 180,000 oz                                             55,000 – 75,000 oz

                                                                      CÔTÉ GOLD
                                                                      Ontario, Canada
CONSTRUCTION

                                                                       (64.75% Ownership)

               Start-up                                                      H2 2023

               Mine type                                                     Open pit

               Estimated mine life                                            ~2041+

               Years 1 – 5 (100% basis)                                    489,000 oz

                                                                          367,000 oz
               Life-of-mine (100% basis)
                                                                         $802/oz AISC

                                   1. Heap leach project currently under assessment. 2. Refer to IAMGOLD news release dated January 12, 2022. 3. 70/30 Saramacca UJV (RGM / Staatsolie) and 95% Rosebel ownership (70% x
                                   95% = 66.5%). 4. Subject to underground mine assessment.
                                                                                                                                                                                                                                                     5
MARCH 2022 CORPORATE PRESENTATION

Environmental, Social and Governance
                                              Since 2007
                                                                              Zero Harm® is our commitment to continually strive to reach the highest standards
                                                                                  in human health & safety, minimize our environmental footprint, and work
                                                                                                 co-operatively with our host communities

•   AA in the MSCI1 ESG Ratings assessment, placing IAMGOLD among the top 15% of precious metals companies
                                                                                                                                                                                   3
•   Vigeo Elris, an affiliate of Moody’s, ranked IAMGOLD 4th out of 45 sector peers
•   Included in the 2021 Bloomberg Gender Equality Index for the 3rd consecutive year and recognized among 380 global companies
    that foster a more inclusive and equitable workplace
•   Named by Corporate Knights to Canada’s list of 2021 Best 50 Corporate Citizens1

                                                                                                                                                                           0.66
PEFORMANCE
                                                                                                                                                                    0.53
• Focus on safety: DART frequency rate1 outperformed 2021 target of 0.51                                                                                                               0.51
                                                                                                                                                                                               0.46

• Board governance metrics: Women represent 44% of the directors; average tenure ~1.9 years                                                                                                           0.37

      • Continued board renewal strategy appointing 7 new experienced directors since December 2020
• 2020 Health, Safety and Sustainability report selected highlights:
      • 53% recycled water use at operating sites                                                                                                                                 DART1 Rate
      • 12% female representation within workforce                                                                                                                  2017   2018        2019    2020   2021
• Commitment to achieve net negative GHG emissions by 2050
                                                                                                                                                                           514k        508k    497k
                                                                                                                                                                    490k                              486k
FRAMEWORKS / STANDARDS
•   Reporting under Global Reporting Initiative (GRI) standards and Sustainability Accounting Standards Board (SASB) standards
                                                                                                                                                       Total GHG
•   Advancing the United Nations Sustainable Development Goals, aligned with our Zero Harm® commitment                                                 emissions
                                                                                                                                                       (Scope 1&2)2 0.60                       0.65
                                                                                                                                                                                                      0.74
                                                                                                                                                                           0.58        0.58
•   Adopted the World Gold Council Conflict-Free Gold Standard since 2017                                                                              Emissions
                                                                                                                                                       intensity
•   Implemented Mining Association of Canada’s Towards Sustainable Mining® (TSM) framework at operating sites since 2007                               (t.CO2/oz)                 GHG Emissions

                                                                                                                                                                    2016   2017        2018    2019   2020
                             Fore more information, see our 2020 Sustainability report at https://www.iamgold.com
                             1. DART frequency rates (days away, restricted, transferred duty) per 200,000 hours worked. 2. In metric tonnes of CO2.
                                                                                                                                                                                                             6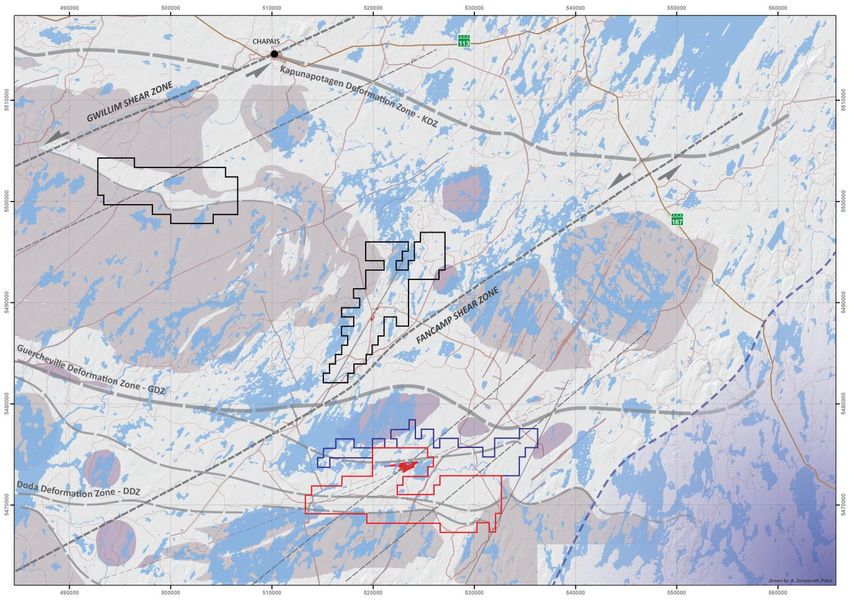
MARCH 2022 CORPORATE PRESENTATION
2021 Operating Highlights
2021
Q4 2021 FY 2021 Guidance
• Full year 2021 production of 601,000 ounces (attributable)
Essakane (90%) koz 98 412 390 – 400
o Near top of updated guidance of 565,000 – 605,000 ounces
o Q4 2021 production of 153,000 ounces (attributable) Rosebel (95%) koz 42 154 140 – 160
• Cash costs1 of $1,132/oz sold and AISC1 of $1,426/oz sold Westwood (100%) koz 13 35 35 – 45
o Within updated guidance ranges of COC: $1,115/oz – $1,150/oz and
AISC: $1,395/oz – $1,435/oz Production, attributable koz 153 601 565 – 605
o Cash costs and AISC impacted by $50/oz non-cash NRV write-down of
ore stockpile and finished goods
• Essakane:
Cash costs1 US$/oz $1,184 $1,132 $1,115 – $1,150
o Record annual production of 412,000 ounces (457,000 ounces 100% basis)
All-in sustaining costs1 US$/oz $1,537 $1,426 $1,395 – $1,435
o Exceeded guidance range of 390,000 – 400,000 ounces
o Benefitting from mill debottlenecking project completed earlier in 2021
• Rosebel:
Capex – operations2,3 US$M $83 $249 $260
o Produced 154,000 ounces (188,000 ounces 100% basis)
Capex – development3,4 US$M $149 $377 $485
o Upper end of guidance of 140,000 – 160,000 ounces
o New Life of Mine Plan demonstrates ramp up to annual production of
Capex – total3,5 US$M $232 $626 $745
300,000 ounces (100% basis) by 2025 with capital investments for stripping
and processing facility improvements
• Westwood:
o Produced 35,000 ounces achieving lower end of guidance range of
35,000 – 45,000 ounces
1. This is a non-GAAP financial measure. Refer to the “Non-GAAP Financial Measures” section on slide #3. 2. On a 100% basis. Includes sustaining and expansion capital for operating sites. 3.
Capital expenditures guidance ±5%. 4. Includes expansion capital for Côté and Boto. 5. Includes sustaining capital of $0.1 million related to corporate activities in Q4 ($0.6 million – YTD).
7
MARCH 2022 CORPORATE PRESENTATION

2022 Guidance

                                    CONSOLIDATED                                   ESSAKANE                                     ROSEBEL                                  WESTWOOD                   CÔTÉ GOLD                  BOTO

Gold production1                   570,000 – 640,000                          360,000 – 385,000                          155,000 – 180,000                             55,000 – 75,000
(attributable ounces)

Cash costs2                          $1,100 – $1,150
(per ounce sold)

AISC2                                 $1,650 – 1,690
(per ounce sold)

Sustaining capex2,3                         $310M                                      $165M                                       $105M                                        $40M
(incl. capitalized stripping)

Expansion capex2,3                   $660M – $690M                                       $5M                                        $35M                                        $10M              $590M – $620M                $20M

NOTES                           Cash costs1 & AISC1 include              Production expected to be                   Production stronger in H2/22                Production expected to see       Timing of capital
                                assumptions related to                   stable over the year as planned             after seasonal rains and as mill            successively increasing levels   expenditures may
                                expected impact of inflation,            grades normalize to reserve                 improvements benefit                        each quarter                     vary between 2022
                                including increases to main              grades partially offset by higher           recoveries                                                                   and 2023
                                                                                                                                                                 Assumes safe re-start of
                                consumables costs by 5-7%,               recoveries
                                                                                                                                                                 Central and West zones
                                resulting in ~1-2% overall
                                impact on cash costs                     Higher proportion of total capex
                                                                         allocated to sustaining capital
                                                                         related to stripping

                                                                           Production guidance assumes no material operational impacts due to prolonged delays or significant
                                                                                                 deterioration in operating conditions due to COVID-19

                                    1. Attributable ounces and capital expenditures account for IAMGOLD ownership interests. Refer to IAMGOLD news release dated January 12, 2022.
                                    2. This is a non-GAAP financial measure. Refer to the “Non-GAAP Financial Measures” section on slide #3. 3. Capital expenditures guidance ±5%.
                                                                                                                                                                                                                                             8
MARCH 2022 CORPORATE PRESENTATION

COVID-19 Protocols Embedded in Our Operations and Projects

Previously implemented protocols remain in place at our sites and are reviewed on an ongoing basis to adapt to
the evolving situation, particularly as it relates to the Omicron variant

 •   Essakane – measures and controls were strengthened to limit transmission, reinforce awareness and promote vaccination

        •   ~64% of the workforce fully vaccinated as of December 2021

 •   Rosebel – Omicron variant remained a concern as new cases in January 2022 were the highest recorded since the start of the
     pandemic

        •   The site continues to monitor and implement mitigating measures to reduce the impact, including actively engaging in
            community related initiatives
        •   ~41% of the workforce was fully vaccinated as of December 2021                                                                                $1.5M
                                                                                                                                                       COVID-19 community
 •   Westwood – COVID-19 situation was stable in Q4, although in Q1 2022 the operation was impacted by absenteeism                                       support in 2020

        •   ~77% of the workforce has reported that it is fully vaccinated

 •   Côté Gold – No material delays due to COVID-19 experienced in 2021 at site

        •   Outbreaks during the holidays and in January forced a slower re-mobilization of the site workforce (staffing ~60% of plan in the
            first part of January). Site staffing ramp-up reached plan of ~750 to 850 personnel by mid-February
        •   Mandatory vaccination policy was introduced in January. 100% of site personnel has at least one dose (two doses required by
            April 1)

 •   Contributed $250,000 to UNICEF to support the International ACT-A / COVAX Emergency Response

                                                                                                                                                                              9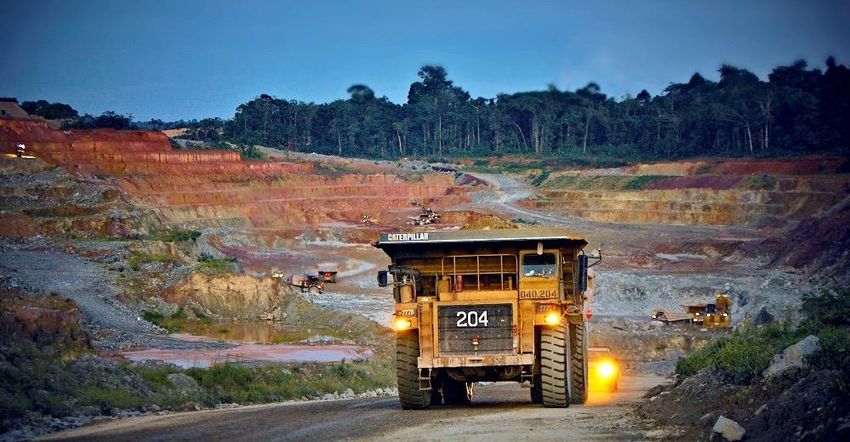
MARCH 2022 CORPORATE PRESENTATION

Côté Gold: Robust, Tier I, Low-cost and Long-life Asset

     PROJECT STATUS1                                                              PROJECT COSTS1,4                                                                        EMERGING GOLD DISTRICT2

     43.4% overall project completion                                             $412M expended (from Jul ’20 to Dec ‘21)                                                7.2 Moz P&P | 13.6 Moz M&I
     92.2% detailed engineering complete                                          $710 – $760M remaining (from Jan ‘22)                                                   >540km2 exploration land package

     ANNUAL GOLD PRODUCTION                                                       OPERATING COSTS5                                                                        ROBUST ECONOMICS (100% BASIS)

     489 koz (first 5 years, 100%)3                                               $659/oz LOM average cash costs                                                          $392M annual pre-tax CF (first 5 years, $1,600/oz Au)
     367 koz (life-of-mine, 100%)                                                 $802/oz LOM all-in sustaining costs                                                     $1.6B after-tax NPV5% ($1,600/oz Au)

Production & Grade Profile (100% Basis)                                                                                                                                                                               Gold production (koz) – 100%
                                                                                                                                                                                                                      Average feed grade (g/t)
                     1.50           1.43
            1.31
   1.14                                                                         1.05           1.12          1.12                                                                      1.10
                                                  1.02           0.91                                                                                                                                 1.01
                     581                                                                                                    0.85
                                    556                                                                                                    0.59                          0.69                                        0.60
            509                                                                                                                                           0.55                                                                      0.47         0.48
   429                                                                          409            434            435                                                                       425
                                                   397                                                                                                                                                392
                                                                 354                                                         330
                                                                                                                                                                         268
                                                                                                                                                                                                                                 Stockpile Processing
                                                                                                                                           228            212                                                        224
                                                                                                                                                                                                                                    170
                                                                                                                                                                                                                                                  73

  2024      2025     2026          2027           2028           2029           2030          2031           2032           2033           2034          2035           2036           2037           2038           2039          2040          2041

                            1. As at December 31, 2021. Refer to IAMGOLD news release dated January 12, 2022. 2. On a 100% basis. M&I resources inclusive of P&P reserves. 3. Years 1 to 5 average annual production commence on
                            commercial production. 4. 70% basis, assuming leasing and USDCAD of 1.30. Estimate cost from July 1, 2020. 5. Assuming a US$1,600 per ounce gold price. This is a non-GAAP financial measure. Refer to the
                            “Non-GAAP Financial Measures” section on slide #2.
                                                                                                                                                                                                                                                        10
MARCH 2022 CORPORATE PRESENTATION
Côté Gold: Progress Report
OWNERSHIP: 92.5% JV (70:30 IAG/SMM), 7.5% 3rd Party
7.2 Moz P&P Reserves3
as at Dec 31, 2021 13.6 Moz M&I Resources3
5.5 Moz Inferred Resources3
43.4% 92.2% $412M
project completion detailed engineering expended to date
• Expended $147 million (incurred $119 million) in Q4 2021 and $359 million in 2021.
• Executive Project Director: Appointed Jerzy Orzechwoski to oversee Côté Gold.
• Health and safety: Surpassed 3.4 million hours with no lost time injuries.
• COVID-19: Omicron variant negatively impacted productivity to start 2022. Mandatory vaccination introduced in January,
staffing reached plan in mid-February.
• Earthwork activities continue with focus on infrastructure to manage spring thaw, TMF starter dam foundation • Mining friendly jurisdiction: 125 km SW of Timmins, and 175 km
excavation commenced, completed construction of the main access road. Productivity for earthworks not meeting targets North of Sudbury
– mitigation plans in place and continuing into Q1 2022. • Access to skilled local labour pool
• Mining activities ongoing with ore being stacked on stockpile. • Close to infrastructure:
• 6 km west of Highway 144
• Process facility exterior: structural steel erection (commenced in mid-October) largely complete, over 50% of wall panel • Close to two main rail lines
cladding installed, though lagged in Jan-Feb due to COVID-19 – no longer on critical path. • Existing power supply 45 km from site
• Process facility interior: focus on concrete works inside the building to ensure mechanical erection can commence in
Q2 2022.
• Supply chain: Equipment delivery is ongoing and inventory on site continues to increase. An offsite indoor storage
facility has been arranged and is ready to receive material.
• Other civil works: HPGR/secondary crusher and primary crusher building completed.
• Fabrication of conveyors and deliveries of sections is progressing well. Major components of the ball mill (motor, chillers,
shells) have started shipping. Primary crusher feeder frames, chutes and supports now on site.
• Permitting: Secured key remaining permit, the provincial Environmental Compliance Authorization (ECA) for operations.
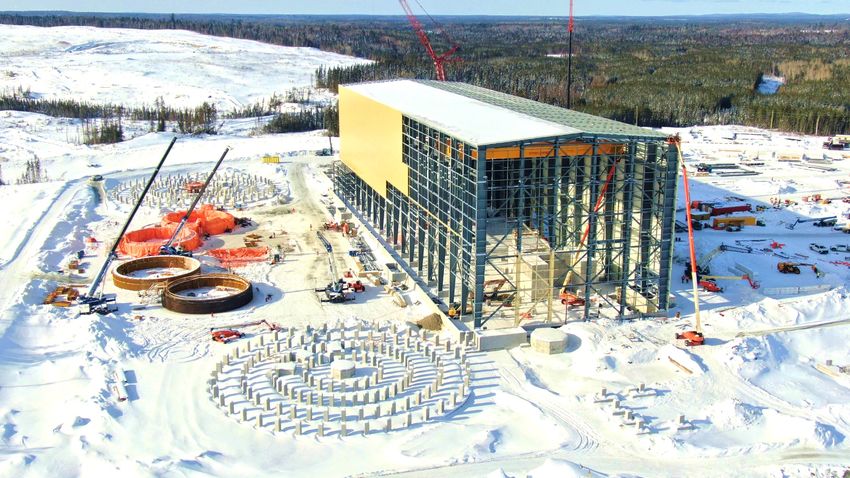
Côté Processing Plant (Feb 2022)
11MARCH 2022 CORPORATE PRESENTATION
Côté Gold: Commercial Production on Schedule for H2 2023
2020 2021 2022 2023 2024
Q3 Q4 Q1 Q2 Q3 Q4 Q1 Q2 Q3 Q4 Q1 Q2 Q3 Q4 Q1 Q2 Q3 Q4
PROJECT TIMELINE
Construction Approval2
Construction Start3
Major Earthworks Start
Main Access Road Complete
Process Building Enclosed
Start of Plant Equipment Installation
Start of Owner Mining
TMF Phase I Complete
Permanent Power Available
Commissioning Completed
Commercial Production
Full Production Achieved First Full Year of Production
PROJECT COMPLETION 43.4%
PROJECT COSTS1 $412M $590 – $620M $120 – $140M
Schedule and timing of expenditures do not account for any potential delays or disruptions caused by COVID-19
Inflationary and other cost pressures have been identified, impacting earthworks, electrical and instrumentation components,
operations spare parts and key consumables, freight costs, indirect costs and EPCM services
• Projected remaining costs to completion trending upwards above high end of the range of previous estimate, timing of capital
outlays earmarked for 2022 may extend into 2023
• Risk analysis of schedule and costs and potential mitigation/optimization opportunities to be completed by end of Q2
1. Actual expended costs to December 31, 2021, with the remaining estimated total costs to completion from January 1, 2022 on 70% basis, assuming leasing and at an assumed USDCAD
exchange rate of 1.30. 2. Refer to IAMGOLD news release dated July 21, 2020. 3. Refer to IAMGOLD news release dated September 11, 2020.
12A virtual 360o tour of Côté Gold
MARCH 2022 CORPORATE PRESENTATION
is accessible here
Côté Gold: Construction Progress
Processing plant wall cladding installation (February 2022) Drilling and blasting on eastern area of pit (January 2022)
Thickener foundations and leach tank installation (February 2022) TMF starter Dam foundation excavation (January 2022) 13MARCH 2022 CORPORATE PRESENTATION
Gosselin 2021 Initial Resource Estimate
Côté Gold Project – Mineral Reserves & Resources (2021)2,3
• Gosselin zone adjoins the Côté deposit to the northeast with potential to
further expand district-scale resources Attributable
Tonnes Grade Contained
Classification Contained
(millions) (g/t Au) (Moz Au)
• Increases the overall Côté Gold project M&I resources by 33% and (Moz Au)
inferred resources by 45%
Côté Gold Deposit
• 66% of the Gosselin initial resource classified as indicated
P&P Reserves 233.0 0.96 7.19 4.66
• Gosselin deposit remains open along strike to the northeast and has only
been drilled to approx. half the depth of Côté M&I Resources4 365.5 0.87 10.20 6.61
• Nearly 3x increase in total resources since acquisition1 Inferred 189.6 0.63 3.82 2.47
• Gosselin discovery cost $1.62/oz – from discovery to delineation
Gosselin Deposit
Indicated 124.5 0.84 3.35 2.17
Inferred 72.9 0.73 1.71 1.11
Côté Gold – Total
P&P Reserves 233.0 0.96 7.19 4.66
M&I Resources4 490.0 0.86 13.55 8.78
Inferred 262.5 0.66 5.53 3.58
1. On a 100% basis. 2. Refer to IAMGOLD news release date October 18, 2021. 3. Mineral resources are estimated at a cut-off grade of 0.3 g/t Au. Mineral reserves are estimated at a cut-off grade
of 0.35 g/t Au 4. M&I resources inclusive of mineral reserves.
14MARCH 2022 CORPORATE PRESENTATION
Financial Position
Liquidity
$553 million • Total available liquidity1 of $1.1 billion as at December 31, 2021
Cash & equivalents2
• First drawdown under credit facility in H1 2022
Gold Hedging and Prepay4
• Completed 150,000 ounce prepay transaction in 2021 effectively
rolling forward the 2019 prepay to 2024 after completion of Côté
TOTAL LIQUIDITY
(as at Dec 31, 2021) • Total proceeds of $236 million to be received in 2022, and
physically settled in 20245
$1.1B • January 2022:
• 2019 prepay arrangement – delivered first 12,500 oz and
received $2.5 million in cash in relation to collar ($1,300 to
$1,500 per ounce)
• 2022 Prepay Arrangement – received $19.7 million in cash
$498 million Hedging Program
Undrawn credit facility3 • Côté’s project costs primarily incurred in CAD:
• Hedges and cash on hand cover nearly 100% FX exposure of
project costs in 2022 and 2023, respectively, during the
construction period (between 1.32-1.38)
$450 MILLION OCT 15, 2028
maturity date
5.75%
coupon rate • Hedged 100% of the project’s total expected fuel costs in 2022 and
senior notes outstanding 57% in 2023
MOODY’S: B2 S&P: B
1. This is a non-GAAP financial measure. Refer to the “Non-GAAP Financial Measures” section on slide #3. 2. As at December 31, 2021; $545 million cash & equivalents plus $7.6 million in short term investments, excludes restricted cash of
$42 million. 3. $498 million available under the credit facility, as at December 31, 2021. 4. The 2019 and 2022 gold prepays are expected to be physically settled in 2022 and 2024, respectively. For more detail refer to the Q4 2021 MD&A and 15
slides 30-31. 5. The “2022 Prepay Arrangement” for settlement in 2024 has an average forward contract price of $1,753 per ounce on 50,000 gold ounces and a collar range of $1,700 to $2,100 per ounce on 100,000 gold ounces.MARCH 2022 CORPORATE PRESENTATION
Advancing Exploration Activities in Key Districts
• Robust exploration program focused on unlocking value in key districts 2022 EXPLORATION BUDGET
Côté District
• Declining industry reserves and resources highlight the challenge to access Other
quality exploration projects at acceptable entry costs 12% 9%
Essakane
• Continue to develop and invest in a healthy pipeline of greenfield and 10%
brownfield exploration projects and leverage existing infrastructure
Bambouk
31%
$35M Abitibi District
$25M exploration 21%
$10M near-site
7%
10%
Chibougamau
DRILL BARGE – GOSSELIN, ONTARIO IP SURVEY – SARAMACCA, SURINAME Rosebel
Exploration expenditures ($M)
$80.5
$68.0
$48.5 $51.2
$44.0 $47
$36.3 $35
2015 2016 2017 2018 2019 2020 2021 2022
VISIBLE GOLD IN CORE – ROUYN GOLD, QUÉBEC RC DRILLING – DIAKHA, MALI Guidance
16MARCH 2022 CORPORATE PRESENTATION
Operations
Hybrid Solar/Thermal Plant at Essakane Gold Mine
• Commissioned in 2018
• 15 MWp solar plant produces ~27 MWh of carbon-free
electricity per year
• ~130,000 photovoltaic panels
• Supplements an existing 57 MW thermal plant
• One of the world’s largest hybrid solar/thermal power plants
Photo: Wärtsilä, Essakane Mine
17MARCH 2022 CORPORATE PRESENTATION
Essakane Gold Mine, Burkina Faso
18MARCH 2022 CORPORATE PRESENTATION
Essakane – Overview
OWNERSHIP: 90% IAMGOLD; 10% Government of Burkina Faso
MINING
Mine type Start-up Mine life 70 3.0
Open Pit 2010 ~20271 Essakane
NIGER
2021 Performance2 2022 Guidance2,3 2022 Capital costs2,3
M tonnes
w:o
35 2.0 MALI
412,000 oz 360,000 – 385,000 oz $165M sustaining
BURKINA FASO
(‘21 guidance 390 – 400 koz) $5M expansion
GUINEA
BENIN
– 1.0
2018 2019 2020 2021
RECORD PRODUCTION IN 2021
TOGO
Ore mined Waste Mined Strip ratio S.L. NIGERIA
CÔTE
• Produced 457,000 ounces in 2021 on 100% basis D’IVOIRE GHANA
PROCESSING
15 1.50
OUTLOOK BEYOND 2022
• Estimated annual production between 325,000 – 375,000 ounces in ’23-’24 10
1.25
M tonnes
g/t
1.00
OPERATIONAL IMPROVEMENTS
5
2013/14: Hard rock plant expansion from 5.4 to 10.8 Mtpa completed on time and 0.75
under budget Africa
– 0.50
2021: Expanded nameplate hard rock capacity from 10.8 to 11.7 Mtpa 2018 2019 2020 2021
Mill feed Mill feed grade
RESERVES & RESOURCES4
SATELLITE PROSPECTS Attrib.
PRODUCTION Category Tonnes Grade Ounces Ounces
• Evaluating resource potential of satellite within 1-15 km of mill 500 1,500
(000’s) (g/t) (000’s) (000’s)
400
COMMUNITY RELATIONS 1,000 Reserves
'000 ounces
300
$/oz
Renewed 3 year CLA agreement in July 2021 to June 2024 P&P 95,462 0.9 2,617 2,355
200
• Proposal to advance Phase II of the Triangle d’Eau Project submitted – decision 500 Resources
100
expected in 2022 M&I* 108,595 0.9 3,223 2,901
– –
2018 2019 2020 2021 Inferred 7,872 1.5 373 335
Production, attr. Cash costs AISC * inclusive of mineral reserves
1. Heap leach project currently under assessment. 2. On an attributable basis. Refer to IAMGOLD news release dated January 12, 2022. Capital expenditures guidance ±5%. 19
3. This is a non-GAAP financial measure. Refer to the “Non-GAAP Financial Measures” section on slide #3. 4. As of Dec 31, 2021, refer to IAMGOLD news release dated February 23, 2022.MARCH 2022 CORPORATE PRESENTATION
Rosebel Gold Mine, Suriname
20MARCH 2022 CORPORATE PRESENTATION
Rosebel – Overview
OWNERSHIP: Rosebel Concession (RGM): 95% IAMGOLD, 5% Government of Suriname | Saramacca UJV: 70% RGM, 30% Staatsolie (66.5% IAMGOLD effective1)
MINING
Mine type Start-up Mine life 70 7.0
Open Pit 2004 (Saramacca 2020) ~20332 6.0
5.0
2021 Performance2,3 2022 Guidance2,3,4 2022 Capital costs2,3,4 Rosebel
M tonnes
w:o
35 4.0 GUYANA
154,000 oz 155,000 – 180,000 oz $105M sustaining 3.0
(‘21 guidance 140 – 160 koz)
FRENCH
$35M expansion
GUIANA
2.0 SURINAME
– 1.0
2018 2019 2020 2021
2021 PRODUCTION Ore mined Waste Mined Strip ratio
• Attributable production of 154,000 ounces was at upper end of revised guidance of
140,000 to 160,000 ounces PROCESSING
15 1.20 BRAZIL
• Operations impacted in 2021 by heavy rains, CBA negotiations (August 2020), and
COVID-19 10 0.80
•
M tonnes
Recovery improvements towards end of Q4/21 from ADR circuit improvements
g/t
5 0.40
OUTLOOK BEYOND 2022 South
America
• Estimated attributable production of 180,000 – 200,000 ounces in ’23-’24 – –
2018 2019 2020 2021
2022 LIFE-OF-MINE PLAN Mill feed, RGM Mill feed, SM Mill feed grade
RESERVES & RESOURCES2
Attrib.
• Annual production expected to ramp up to 300,000 oz by 2025 (100% basis) PRODUCTION Category Tonnes Grade Ounces Ounces
300 2,000
• Mineral reserves and resources update incorporated revised geologic, cost models (000’s) (g/t) (000’s) (000’s)
and pit optimization 1,500
Reserves
'000 ounces
$/oz
150 1,000 P&P 109,164 1.1 3,829 3,286
ROSEBEL COMMUNITY FUND
Resources
• Launched in 2019 – $2.5 million fund, supporting local communities 500
M&I* 173,715 1.1 6,305 5,558
– –
2018 2019 2020 2021 Inferred 22,017 1.0 687 587
Production, attr. Cash costs AISC * inclusive of mineral reserves
1. 70/30 Saramacca UJV (RGM / Staatsolie) and 95% Rosebel ownership (70% x 95% = 66.5%). 2. Refer to IAMGOLD news release dated January 12, 2022.
21
3. On an attributable basis. 4. Capital expenditures guidance ±5%. This is a non-GAAP financial measure. Refer to the “Non-GAAP Financial Measures” section on slide #3.MARCH 2022 CORPORATE PRESENTATION
2021 Rosebel Mineral Reserves and Resources Update1
2020 2021 ▲ YoY
(as of Dec 31) (as of Dec 31)
Contained Contained Contained
Tonnes Grade Ounces Tonnes Grade Ounces Ounces
(On a 100% basis) (000’s) (g/t Au) (000’s) (000’s) (g/t Au) (000’s) (000’s) %
RESERVES 137,638 1.1 4,797 109,164 1.1 3,829 – 968 – 20%
M&I RESOURCES2 299,503 1.0 9,578 173,716 1.1 6,305 – 3,273 – 34%
INFERRED RESOURCES 73,968 0.9 2,025 22,017 1.0 687 – 1,338 – 66%
2021 mineral reserves decreased by 20% or 1.0 Moz, with the majority of the decrease primarily driven by Rosebel pits incorporating an updated geologic model, new
cost model, pit optimization assumptions and 2021 production depletion
2021 M&I resources decreased by 34% or 3.3 Moz (3.1 Moz at Rosebel and 0.2 Moz at Saramacca):
• At Rosebel, the decrease is mainly attributable to: 2021 production depletion; a revised optimization methodology incorporating fixed cost distribution (versus dynamic
cost accounting used previously); changes to the cost model which translated in an increase in mining, processing and general and administrative costs; and an
updated resource block model incorporating the results of infill and conversion drilling programs completed in 2021 and applying a different block model interpolation
methodology (Ordinary Kriging versus Uniform Conditioning)
• This resulted in reduction in both size and depth of resource and reserve pit shells, notably Royal Hill and Pay Caro, with some ore zones excluded in the pit shells (at
$1,500/oz) that could re-enter the mine plan in the future under different financial conditions
1. Refer to IAMGOLD news release dated January 12, 2022.
2. M&I resources inclusive of reserves.
22MARCH 2022 CORPORATE PRESENTATION
2022 Rosebel Updated Life-of-Mine Plan (100% basis)
KEY PROJECT METRICS1
LOM PLAN
(12 YEARS)
• Updated Mineral Reserve estimate of 109 Mt at 1.1 g/t for 3.8 million ounces contained gold
(100% basis, unless otherwise stated)
Rosebel Mining
• Updated mine plan incorporates revised geological and cost models for the Rosebel and
Saramacca deposits, and is capital constrained based on internal capital allocation strategies
Ore mined Mt 74.0
• Two key priorities require material capital outlay in the next 5 years: stripping required to access
Strip ratio w:o 5.7 deep higher grade ore and mill capacity to treat hard rock
Ore grade g/t 0.98 • Production expected to ramp up to a stable annual gold output of ~300,000 oz by 2025
Saramacca Mining
Gold production (koz) – 100%
Ore mined Mt 21.6 Production & Cost Profile
All-in sustaining cost ($/oz)
Strip ratio w:o 7.6
$1,862
$1,570 $1,547
Ore grade g/t 1.76 $1,406 $1,317 $1,297 $1,299 $1,401 $1,275 $1,378
$1,069 $965
Tonnes milled Mt 105.9
312 312 312 303 312 305
294
Average annual tonnes milled Mtpa 8.8 252 270 264
223
Head grade g/t 1.1 168
Gold recovery % 89%
2022 2023 2024 2025 2026 2027 2028 2029 2030 2031 2032 2033
Total gold production koz 3,327
US$M
Average annual gold production kozpa 277 $200 $172 Growth capex (100%)
$165
$152 $143 Capitalized waste strip (100%)
Cash costs2 $/oz $993 $150 $123 $118 $127
$104 Sustaining capex (excl. CWS) (100%)
$88
$100
All-in sustaining Costs (AISC)2 $/oz $1,350
$37
$50
Total sustaining capex2 $M $1,021 $9 $5
--
Total growth capex2 $M $223 2022 2023 2024 2025 2026 2027 2028 2029 2030 2031 2032 2033
1. Refer to IAMGOLD news release dated January 12, 2022.
2. This is a non-GAAP financial measure. Refer to the “Non-GAAP Financial Measures” section on slide #3.
23MARCH 2022 CORPORATE PRESENTATION
Westwood Complex, Canada
24MARCH 2022 CORPORATE PRESENTATION
Westwood – Overview
OWNERSHIP: 100% IAMGOLD
MINING
Mine type Start-up Mine life 1,200
Underground | Satellite OP 2014 ~2033+1
800
2021 Performance2 2022 Guidance2,3 2022 Capital costs2,3
M tonnes
North
America
35,000 oz 55,000 – 75,000 oz $40M sustaining 400
(‘21 guidance 35 – 45 koz) $10M expansion
–
2018 2019 2020 2021
UNDERGROUND TURNAROUND Ore mined, UG Ore mined, Other
• Underground was put on care & maintenance following a seismic event in October
2020 following a COVID-19 shutdown earlier in the year PROCESSING QUEBEC
1,200 8.00
• Production resumed through processing of stockpile material and Grand Duc satellite
ONTARIO Westwood
6.00
open pit ore 800
M tonnes
• Underground operations in the East Zone recommenced in June 2021
g/t
4.00
400
CURRENT STATUS 2.00
• Mining in the Central and West Zones expected to resume in H1 20224 – –
• 2022 production expected to increase each quarter as ground support activities allow 2018 2019 2020 2021
RESERVES & RESOURCES5
Mill feed Head grade, UG Head grade, Other
for increased development and mining activities
PRODUCTION Category Tonnes Grade Ounces
OUTLOOK BEYOND 2022 150 2,600
(000’s) (g/t) (000’s)
• Expected annual production of 90,000 – 100,000 ounces in ’23-’24 from underground
100 Reserves
'000 ounces
development, resumption of CZ and WZ and Fayolle contribution
$/oz
1,300 P&P 4,579 4.5 659
RESOURCE CONVERSION 50 Resources
• Delineation drilling to target conversion of resources into reserves M&I* 7,607 6.7 1,639
• Focus on upgrading resources at the satellite Grand Duc open pit –
2018 2019 2020 2021
–
Inferred 5,970 9.2 1,764
Production, attr. Cash costs AISC * inclusive of mineral reserves
1. Subject to underground mine assessment. 2. Refer to IAMGOLD news release dated January 12, 2022. 3. Capital expenditures guidance ±5%. This is a non-GAAP financial measure. Refer to the
25
“Non-GAAP Financial Measures” section on slide #3. 4. Conditions in the West and Central Zones remain under assessment. 5. Refer to IAMGOLD news release dated February 23, 2022.MARCH 2022 CORPORATE PRESENTATION
Westwood – “Hub-and-Spoke” Model
ATTRACTIVE DISTRICT EXPLORATION POTENTIAL1 THAT
COULD SUPPLEMENT EXCESS MILL CAPACITY
FAYOLLE PROPERTY (OP) A B ROUYN GOLD PROJECT (UG)
100% ACQUIRED FROM MONARCH GOLD (2020) A Fayolle OPTION TO ACQUIRE 100% FROM YORBEAU RESOURCES
Property
• ~35 km northeast of Rouyn-Noranda and ~29 • 4 km south of Rouyn-Noranda and ~40 km
km northwest from Westwood west from Westwood
• 39 mineral claims covering an area of 1,373 • 4 known gold deposits on a 2,700 hectare
hectares (14 km2) property covering a 12 km stretch of the
prolific Cadillac-Larder Lake Break
• Resource estimate work ongoing with focus
•
Home 5
on high-grade near-surface mineralization Exploration Target Potential1 of
Westwood
Rouyn-Noranda
400-600koz at 6-8 g/t Au at underground
Mine
• May provide incremental feed commencing Lac Gamble zone
B
Rouyn Project
in 2023, pending permitting1 Lac Gamble Zone
Granada
• Anticipated 3-4 year permitting timeline1
• Historical 2019 drill highlights2:
• 6.1m grading 8.37 g/t 65-75%
Westwood • Drill highlights3:
Underground Mill
• 9.8 m grading 27.8 g/t
• 2.7m grading 50.94 g/t 1.1 Mtpa
Utilization
Westwood • 9.8 m grading 10.4 g/t
• 3.0m grading 37.97 g/t Nameplate
Mill Capacity Design
Excess Capacity • 29.7 m grading 9.0 g/t
• 4.0m grading 15.79 g/t Grand Duc (current)
25-35% Fayolle (2023-2024) • 7.6 m grading 9.7 g/t
Rouyn (2024+)
Other Exploration Upside
1. Forward-looking statement. Please refer to the Cautionary Statement. 2. See Monarch Gold Corp. press release dated Sep 5, 2019 (these drill results have not been verified by IAMGOLD and
should not be relied on). 3. Refer to IAMGOLD news releases dated March 3, 2021, May 13, 2020 and Jun 12, 2019.
26MARCH 2022 CORPORATE PRESENTATION
Development and Exploration Projects
27MARCH 2022 CORPORATE PRESENTATION
Bambouk District: Boto – Karita – Diakha-Siribaya
Boto Gold (90% ownership) Yatela Deposit
Operation
1.6Moz • Along same trend as B2Gold’s Fekola Mine in Mali Sadiola
RESERVES1 • Mining permit received in 2019 for a period of 20 years2
2.0Moz • 2019 Optimization Study outlines an 11 year mine life
M&I RESOURCES1 producing 160 kozpa of gold in the first 6 years
Boto
0.5Moz
• Advancing an early works package with an expected Deposit
INFERRED1 expansion capital spend of $20 million in 20223
MALI
Karita Discovery (100% ownership)
Sabodala
• Located in north-eastern Guinea covering an area of 5Moz P&P
Endeavour
100 km2 Massawa
EXPLORATION Loulo
STAGE • Acquired 100% in 2017 as a granted exploration permit Karita 8Moz P&P
Segala
• Highlight intercepts: 29m @ 2.96 g/t; 21m @ 9.01 g/t4 Discovery Barrick Gold
Tabakoto
SENEGAL Gounkoto
Diakha Deposit (90% ownership) Diakha Fekola 4Moz P&P
B2Gold Corp.
Deposit BAMBOUK
DISTRICT
•MARCH 2022 CORPORATE PRESENTATION
Chibougamau: Emerging Prospective District in Québec, Canada
NELLIGAN (75% JV INTEREST)
• Located 60 kilometres southwest of Chibougamau, Québec
• Exercised option to increase undivided interest to 75% (from 51%)
in December 2019
• Completed initial resource estimate, comprising 97 million tonnes
grading 1.02 g/t Au for 3.2 Moz1
MONSTER LAKE
• Awarded 2019 AEMQ Discovery of the Year 100% IAMGOLD
• 2021 drilling highlights2: 5,807 ha (58.1 km²)
• 86.7 metres at 1.34 g/t Au 45.0 metres at 2.13 g/t Au
• 111.0 metres at 1.11 g/t Au 19.5 metres at 3.80 g/t Au Monster Lake Deposit
433,000 oz Au @ 12.1 g/t Au
MONSTER LAKE (100% INTEREST)
• 15 kilometres north of Nelligan
ANIK
• Consolidated 100% ownership in 2020 100% Kintavar Exploration
Nelligan Deposit
• Hosts an inferred resource of 1.1 million tonnes grading 12.1 g/t 3.2 Moz Au @ 1.02 g/t Au
IMG Earn-In Option for 75%
5,375 ha (53.7 km²)
for 433,000 oz1
• 2020 drilling highlights3: NELLIGAN
75% IAMGOLD – 25% Vanstar
• 3.8 metres @ 16.9 g/t Au 0 5 10km 9,356 ha (93.6 km²)
• 2.8 metres @ 5.63 g/t Au
• 12.3 metres @ 2.09 g/t Au
1. On a 100% basis. Refer to IAMGOLD news release dated February 17, 2021. 2. Refer to IAMGOLD news release dated December 16, 2021.
3. Refer to IAMGOLD news release dated August 13, 2020.
29MARCH 2022 CORPORATE PRESENTATION
Appendix
30MARCH 2022 CORPORATE PRESENTATION
Gold Prepayment – Illustrative Impact
PREPAYMENT ARRANGEMENT STRUCTURE GOLD PREPAY RECOGNITION
• Cash proceeds received up front in return for obligation to unit 2019 2022 2024
deliver ounces at a later date
Illustrative gold price US$/oz $1,300 $1,800 $1,800
• Settlement is in the form of physical gold deliveries from any
Production
of the Company’s gold mines in equal monthly installments Production – unaffected gold koz 600 450 450
• The prepaid amount is treated as deferred revenue that is Production – gold prepay koz – 150 150
amortized and recognized upon delivery
Total gold production koz 600 600 600
TRANSACTION ASSUMPTIONS
Revenue recognized – unaffected gold US$M $780 $810 $810
• Illustrative annual gold production of 600,000 ounces
• 2019 prepay: 150,000 ounces to be delivered in 2022, with a Prepay revenue – floor price US$M – $195 $2583
Revenue
gold collar range of $1,300/oz – $1,500/oz1
Prepay revenue – incremental1,2 US$M – $30 $10
• Prepayment amount of $170 million in 2019 based
upon $1,300/oz gold price, net of transaction costs Total revenue recognized US$M $780 $1,035 $1,078
• 2022 prepay (1): 100,000 ounces to be delivered in 2024, Realized gold price US$/oz $1,300 $1,725 $1,796
with a gold collar range of $1,700/oz – $2,100/oz2, funded at
$1,700/oz
Cash Flow OCF – prepay cash received US$M +$170 +$236 –
• 2022 prepay (2): 50,000 ounces to be delivered in 2024,
funded at $1,753/oz3 OCF – net impact on delivery US$M – ($195) ($258)
• Total prepayment amount of $236 million in 2022 for Net effect on timing of cash flow US$M +$170 +$41 ($258)
(1) and (2), net of transaction costs
1. For the 2019 prepay, if spot gold > $1,500/oz = incremental gold revenue of $200/oz ($1,500 – $1,300/oz); if $1,300/oz < spot gold < $1,500/oz = incremental revenue of Spot – $1,300/oz;
if spot gold < $1,300/oz = no incremental revenue. 2. For the 2022 100koz prepay, collar range of $1,700/oz to $2,100/oz. 3. 100koz * $1,700/oz + 50koz * $1,753/oz.
31MARCH 2022 CORPORATE PRESENTATION
Gold Mineral Reserves – Attributable
As at December 31, 2021 PROVEN PROBABLE TOTAL RESERVES
Effective Tonnes Grade Ounces Tonnes Grade Ounces Tonnes Grade Ounces
DEPOSIT Location
Ownership (000’s) (g/t) (000’s) (000’s) (g/t) (000’s) (000’s) (g/t) (000’s)
Rosebel 1 95% Suriname 10,287 0.6 208 72,175 1.0 2,258 82,462 0.9 2,466
Saramacca 1 66.5% Suriname 332 0.5 6 14,539 1.7 814 14,870 1.7 820
Burkina
Essakane 1 90%
Faso
29,637 0.5 453 56,279 1.1 1,902 85,916 0.9 2,355
Westwood 2,3 100% Canada 500 6.9 111 4,079 4.2 548 4,579 4.5 659
Côté Gold 2 64.75% Canada 84,513 1.0 2,760 66,355 0.9 1,898 150,868 1.0 4,658
Boto Gold 2 90% Senegal – – – 26,136 1.7 1,434 26,136 1.7 1,434
TOTAL RESERVES4 125,269 0.9 3,537 239,563 1.1 8,855 364,831 1.1 12,392
1 Rosebel, Saramacca, and Essakane Mineral Reserves have been estimated using a $1,300/oz gold price as of December 31, 2021.
2 Westwood, Côté Gold and Boto Gold Mineral Reserves have been estimated using a $1,200/oz gold price as of December 31, 2021.
3 The Grand Duc Mineral Reserve estimate is included in the Westwood Mineral Reserve estimate. The Grand Duc Mineral Reserves have been estimated using a gold price of $1,350/oz.
4 Due to rounding, numbers presented throughout this document may not add up precisely to the totals.
32You can also read