Corporate Insolvency Rules and Zombie Lending - European ...
←
→
Page content transcription
If your browser does not render page correctly, please read the page content below
Corporate Insolvency Rules and Zombie
    Lending

    By Bo Becker and Victoria Ivashina 1

    Abstract
    Bank lending to less productive firms at subsidized rates has long been recognized
    as an important mechanism that can help banks in the short run, but deepens and
    prolongs economic crises. Explanations of such “zombie lending” are underpinned
    by misaligned bank incentives. We propose an additional driver of zombie lending:
    the inefficient resolution of insolvency. We provide supporting evidence consistent
    with insolvency playing a critical role. Using substantial variation in the efficiency of
    resolution systems across Europe, we show that better insolvency systems are
    associated with more cyclical use, and high development of private debt markets
    which rely heavily on the private resolution of insolvency. We also find that, at the
    firm level, cheaper credit is more common in bad times when insolvency works
    worse. Critically, insolvency-driven zombie lending cannot be moderated through
    bank targeted policies, thus, making insolvency reform a key complement to bank
    capital requirements and supervision.

1   Introduction
    Zombie credit—that is, lending to otherwise insolvent firms—has been shown to slow
    economic growth through the misallocation of credit and the suppression of normal
    competitive forces. (For example, Hoshi and Kashyap (2004), Peek and Rosengren
    (2005), Caballero, Hoshi, and Kashyap (2008), Banerjee and Hofman (2018),
    McGowan, Andrews, Millot (2018), Blattner, Farhino and Rebello (2019), Acharya,
    Eisert, Hirsch (2019), and Andrews and Petroulakis (2019).) The prevailing view of
    what drives zombie lending, is rooted in the Japanese experience, and it tends to put
    banks and government assistance administered through banks at the heart of the
    problem. This paper postulates that another important determinant of zombie credit
    is insolvency resolution rules. We argue that a substantial cost of restructuring
    insolvent firms will narrow borrowers’ and banks’ choices, and foster superficial or
    insufficient remedies, including—in extreme cases—sham loan restructurings.

    To be clear, we do not dispute the relevance of perverse bank incentives for zombie
    lending. Our claim is that this is only half of the problem, and consequently, any

    1   Bo Becker is the Cevian Capital Professor of Finance at the Stockholm School of Economics. Victoria
        Ivashina is a Lovett-Learned Professor of Finance at the Harvard Business School. We are grateful to
        Sayyam Maubeen and Alys Ferragamo for their outstanding research support on this project. We also
        thank Baker Library Research Service at Harvard Business School, and especially Kathleen Ryan for
        assistance with the data for this project.

    Corporate Bankruptcy Rules and Zombie Lending                                                              1
policy efforts that target banks are only half of the solution. A typical mechanism
envisioned behind zombie lending is that a bank wants to avoid recognizing the
deteriorated condition of the borrower due to a risk-shifting motive as in Jensen and
Meckling (1976). Caballero, Hoshi, and Kashyap (2008) stress the importance of
regulatory capital constraints: banks try to avoid recognition of non-performing loans
in order to maintain regulatory capital requirements, and by extending loans they can
avoid borrower later payments and defaults (which trigger increased capital
requirements). Through zombie lending, banks stay afloat in the hope of a
macroeconomic recovery or a public bailout. 2 The central implication is that—for
capital constrained banks—this leads to misallocation of credit away from firms with
better investment opportunities. Since this view of zombie lending abstracts from
insolvency resolution, inefficiencies are seen as driven by bank incentives alone. A
standard policy implication, therefore, is ex-post realignment of incentives through
the removal of troubled assets from insolvent banks’ balance sheets, or ex-ante
policies aimed at reducing risk-shifting motives.
The mechanism we propose interacts with how borrower insolvency is resolved: if
insolvency if very costly, restructuring is less attractive for lenders, and hence
zombie lending becomes more prevalent. It is well known that there is significant and
persistent cross-country heterogeneity in the efficiency insolvency procedures.
Djankov, Hart, McLeish and Shleifer (2008) use survey methodology to construct a
measure of efficiency for debt enforcement that is comparable across a wide set of
countries and shows that these measures are strongly correlated with economic
growth, and debt market development. Davydenko and Franks (2008) use micro
data on corporate defaults in France, Germany and the U.K. to highlight that
differences in creditors’ rights across these countries impact banks’ lending and
restructuring practices that try to mitigated the costs of insolvency proceedings.
Focusing on productivity growth, Adalet McGowan and Andrews (2018) discusses
policies relevant for firm exit and identify gaps in terms of OECD countries and time
series coverage of key insolvency indicators.
More recently, a widespread economic shutdown related to the 2020 pandemic
raised world-wide alarms regarding the potential amplification of economic distress
due to unsuitability of many insolvency regimes to handle restructuring in a timely
and effective manner, and on a high scale. (For example, see Greenwood, Iverson
and Thesmar (2020), Group of Thirty (2020), Becker and Oehmke (2021), and Ellias,
Iverson and Roe (2020)).
Because efficiency losses resulting from lack of proper and timely restructuring
procedures, and consequent misallocation of credit, this may deepen a crisis
and delay recovery. Minimizing zombie lending though implementation of
improved restructuring systems—and not solely through bank-targeted actions—
is key to economic crisis management. This intuition can be illustrated in the
framework of Diamond and Rajan (2011), which focuses on bank holdings of
illiquid assets. In their model, a negative shock leads to a fire sale of illiquid
assets. We can reinterpret their model with the cost of insolvency resolution
2 Zombie lending could also be encouraged by the government as a form of financial repression, but
such centrally-driven zombie lending has different policy implications.
Corporate Bankruptcy Rules and Zombie Lending 2taking the place of the fire sale discount of illiquid assets. In our setting, a negative shock leads to borrower insolvency and losses associated with restructuring. An important difference is that in the Diamond and Rajan (2011) model, the illiquid assets are not directly affected by the shock. So, ultimately, the inefficiency results from banks’ forced sales. This leads to the policy recommendation that to unfreeze the credit market, ex-post, the authorities should seek to move—in one way or another—illiquid assets away from the balance sheets of banks. Regulations that reduce banks’ risk exposure ex-ante can help reduce the likelihood of incentive problems ex-post. This framework delivers the standard policy implications for bank-driven zombie lending. With illiquid assets, however, no inefficiency is realized if assets are held until maturity. This is exactly why moving them away from the bank balance sheet realigns the incentives for efficient credit allocation, and forgoes the losses if assets are held to maturity. With insolvent assets that are facing additional losses due to inefficient restructuring procedures, mere movement of assets cannot resolve the problem, and could even turn the government into the zombie lender. Thus, if zombie lending is caused in part by deficiencies in restructuring systems, it cannot be effectively moderated by ex-ante or ex-post policy action targeting banks alone. We should clarify that the insolvency regime is relevant for firms that are still operationally viable, but have experienced a negative shock and, as a result, carry a capital structure that is no longer suitable. Underlying the zombie lending problem is capital misallocation. Some of the zombie firms might not be operationally viable, especially in a competitive setting. Evidently, this problem cannot be addressed through financial restructuring, and as such is outside of the scope of the question that we tackle in this study. However, cases where a firm becomes obsolete as a result of a broader economic shock, are likely to be few which, ultimately, is what makes the zombie lending phenomenon so hard to detect in a timely manner. To illustrate the significance of insolvency frameworks for zombie lending we use World Bank cross-country data that rates several aspects of insolvency procedures. (This study uses a range of variables and data sources; we elaborate on these in the next section.) First, we look at bankruptcies. Our point is that better insolvency procedures make restructurings more likely. Simply put, if bankruptcy proceedings are dysfunctional, empirically we will see no bankruptcies (and, therefore, under our hypothesis, more zombie lending.) The data show that—as one would expect—lower economic growth is associated with an increase in bankruptcies on average. However, this pattern differs by country. In countries with better insolvency proceedings, higher recovery rates, and shorter resolutions time, years with negative GDP growth show more bankruptcies. This pattern is absent in countries with poor systems. In other words, formal restructuring is more likely to fulfil its important cyclical role when it works better. Additional aggregate supporting evidence emerges from looking at the development of the private markets in several countries. Note that feasibility of restructuring and its direct and implicit costs might affect banks differently from other types of creditors. Ultimately, however, it should affect all types of debt investors. This is a distinct Corporate Bankruptcy Rules and Zombie Lending 3
feature of our hypothesis as compared to bank-centred explanations of zombie
lending. Outside of bank-originated credit, there are two other significant sources of
debt that we can consider: bond market and (non-bank) private debt. However, the
restructuring of bond debt is generally very hard due to coordination reasons (e.g.,
Bolton and Scharfstein (1996)) and institutional constraints (e.g., Chernenko and
Sunderam (2012)).

The private debt segment has mostly developed following the GFC. 3 However, it has
been growing at a fast pace. According to Preqin, in 2020, global private debt funds
had assets under management estimated at $848 billion, projected to grow at 11.4%
annually for the next five years. Like banks, private debt funds are highly
sophisticated and “active” lenders. In line with this observation, their debt products
tend to be highly customized. 4 Moreover, private debt creditors not only have the
necessary expertise but also have low coordination costs and institutional flexibility
to restructure debt of a struggling borrower. Indeed, they depend on the ability to
restructure, as they target higher returns than banks and finance riskier debt. 5 If
there is an event of default (either a missed payment or covenants violation), there
has to be a way to move forward in a timely and effective way. However, in the
absence of effective insolvency procedures, such private resolutions of distress do
not tend to emerge even if creditors themselves are flexible in their mandate and do
not face high coordination costs.

Our hypothesis, therefore, is that the development of private debt investments is
dependent on the strength of the insolvency framework. This is exactly what we find:
private debt markets are larger in country-years with better insolvency systems. Note
that most of the private debt investment is done by large, global funds. So, one way
to think about it is that we are measuring Blackstone’s or CVC’s or Ardian’s desire to
pursue private debt transactions in different jurisdictions. This finding also brings new
evidence to support the connection between country-wide insolvency resolution rules
and growth of debt markets. Among other papers, this literature includes Djankov,
Hart, McLeish and Shleifer (2008), Becker and Josephson (2016), and Ponticelli and
Alencar (2016)).

Finally, we present a set of results that uses firm level information to measure
zombie lending. We use the empirical literature that follows Caballero Hoshi and
Kashyap (2008) and focuses on credit “unusual cheapness”. To capture this
empirically, we construct a dummy variable indicating if the current interest rate on
loans is below the rate on new loans issued over the preceding four quarters and
rated “AA” in the benchmark market. For European loans we use benchmark loans
issued in the EU and U.K. markets excluding Greece, Ireland, Italy, Portugal, and
Spain. Our sample covers 2004-2020, that high rating cut-off and exclusion of some
of the countries from the benchmark assures that we are identifying “cheap” credit.

3   As an example, the Blackstone Group, the largest private equity group in the world, acquired GSO,
    which became its credit arm in early 2008. Specialized debt asset managers such as Owl Rock
    Capital, which of the leader in the segment where not started until several years later.
4   See for example Ivashina, Dione and Boyar (2017).
5   Private debt segment is relevant to our study for several reasons, But, as compared to banks, private
    debt lenders are much more constraint from “pretend” restructurings, as most of these are finite life
    closed-end funds similar to private equity funds.

Corporate Bankruptcy Rules and Zombie Lending                                                               4
To do so we rely on the data that contains accurate new loans and loan
amendments. The analysis is done by controlling for borrower size and leverage and
loan characteristics. We include industry and year fixed effects and control for
economic growth bank-sector capitalization. As before, we are interested in the rise
in zombie lending during economic downturns. We find that, in years with negative
GDP growth, “cheap” credit is less likely to take place in countries with stronger
insolvency frameworks. The results for recovery rates and time to resolution are
consistent with our hypothesis and economically meaningful, but not statistically
significant at conventional levels. 6
The question of zombie lending and credit misallocation is especially timely given
the rapid growth of debt markets, which reflect increases in corporate loan
securitization as well as high-yield markets more broadly. Specifically, corporate
leverage has increased in Europe and other developed markets. (See, for example,
Lane (2020)). At the same time, the banking sectors has re-emerged from the
aftermath of the GFC and Sovereign debt crisis with stronger financial positions. The
traditional, bank-centred narrative, therefore, would suggest that the overall risk of
zombie lending is low. This, however, puts us in danger of missing pressures for the
lending emerging from the lack of effective solvency resolution.
2 Data
We constrain our analysis to the country members of the European Union as of the
end of 2003, U.K. and U.S. We use multiple data sources.
Our central explanatory variables measure effectiveness of the restructuring
framework at the country level. For this we rely on the World Bank annual “Doing
Business” report which compares business regulation in a wide range of countries.
We specifically focus on the measures concerning resolution of business insolvency.
The methodology used for this section was developed based on the study by
Djankov, Hart, McLiesh, and Shleifer (2008). 7 Generally it is very hard to compare
actual outcomes of resolutions across-countries as there is a non-trivial selection into
which companies pursue a formal restructuring. (Our study highlights one such
source of selection.) The World Bank approach constructs a simple standard
scenario of a company in financial distress and then surveys experts to understand
the likely outcomes of a hypothetical resolution in different countries.
In what follows we will report four main variables: 8
• Recovery Rate Score is based on the expected creditor’s net recovery rate for a
standardized scenario, which takes into account resolution costs and time
6 Andrews and Petroulakis (2019) use a set of alternative measures of ease of financial restructuring and
find some evidence for “barriers to restructuring” to contribute to zombie lending problem in periods of
slower economic growth. They do not find evidence on other measures of the strength of insolvency
framework.
7 For more information see https://www.doingbusiness.org/en/methodology/resolving-insolvency.
8 Although the World Bank database provides alternative measures we found that several of them are
highly correlated within our sample. The four variable that we choose reflect the four distinct aspects of
insolvency reported in the World Bank data.
Corporate Bankruptcy Rules and Zombie Lending 5among other factors. The score ranges from 0 to 100, with 100 indicating
highest efficiency.
• Strength of Insolvency Framework Score is based on whether the country
adopted international practices in (i) commencement of insolvency proceedings,
(ii) management of the debtor’s assets, (iii) reorganization proceedings and (iv)
creditor participation in insolvency proceedings. 9 Similarly, this score ranges
from 0 to 100, with 100 indicating highest efficiency.
• Insolvency Restructuring Score (or Main Score) is the simple average of the two
previous scores.
• Resolution Time is the expected number of years to resolution of insolvency of
the standardized‚ in years. This is one of the separate components of the
recovery score. This measure has the opposite sign to the other three, with the
shortest duration time being a proxy for most effective resolution framework.
The availability of these measures dictates the period of our analysis which is 2004-
2020. 10
The World Bank data are not without caveats. It is a catch-all approach that is
intended to be meaningful in all countries participating in the survey. As a result, it is
stripped of much granularity. Although, as one can see in Chart 1, it still picks up
substantial variation among the countries in our sample and over time. Another
related issue with the World Bank data is that it paints a picture that is too positive in
that—to create a representative business that would be meaningful in all countries—
the survey focuses on a hypothetical firm with real estate assets and a single
secured bank loan. There are no international operations, no complex balance
sheets, no intangible assets. Realistically, if all these ingredients were included, the
U.S. would look better than some of the other countries. While these are important
considerations, as of today, we don’t have many meaningful cross-country
alternatives to measure insolvency system strength. For example, the OECD effort to
construct an alternative metric and reflected in Andrews and Petroulakis (2019) has
limited power when thinking about zombie lending.
Chart 1 plots Insolvency Restructuring Score for the countries in our sample. It is
easy to see that there is substantial variation even within these relatively narrow
samples. In 2020, Finland leads the group with the score of 92.69, followed by the
U.S. with 90.48. Greece and Luxemburg, on the other hand, have the lowest scored
with 53.13 and 45.48, respectively. There is also time-variation within country with
Spain and France showing the largest improvement over the period of our sample.
However, both of countries still have relative low score as compared to other
countries even in 2020.
9 The criteria reflected in this index were developed on the basis of the World Bank’s Principles for
Effective Insolvency and Creditor/Debtor Regimes (World Bank, 2011) and the United Nations
Commission on International Trade Law’s Legislative Guide on Insolvency Law (UNCITRAL, 2004).
10 Reported results backfill for the U.S. some of the measure that are not available before 2014, but this is
not essential to our conclusions.
Corporate Bankruptcy Rules and Zombie Lending 6Chart 1
Country-level variation in insolvency restructuring scores
World Bank Main Insolvency Score
(The score varies from 0 to 100.)
Sources: World Bank.
Notes: (*) US and Luxemburg data starts in 2014.
Bankruptcy data has been collected from a range of reliable sources which are
reported in the appendix. The major concern with the data collected from individual
sources, however, is their comparability across countries. To account for this
problem, we instead look at the growth rate in bankruptcies based on the preceding
two-year average. Given that bankruptcy filings tend to be concentrated in time,
looking at a two-year average allows us to moderate potential gaps.
We use DealScan and Refintiv data which primarily covers syndicated loan
origination. These datasets are comparable, but Refintiv has some rating data and
better coverage of loan amendments. Thus, we complement DealScan to include
this additional information.
We matched loan level samples to CapitalIQ which we use as a source of quarterly
financial information. We also use several aggregate variables. In particular, we use
IMF data on bank capitalization at the country level as a control variable.
3 Supporting Evidence
To build supporting evidence for the importance of insolvency regimes for zombie
lending, we start with the aggregate evidence. We first look at the intensity of use of
the formal bankruptcy system as a proxy for effective restructurings (the opposite of
zombie lending). If a company has difficulty servicing its debt as a result of an
Corporate Bankruptcy Rules and Zombie Lending 7economic shock, its capital structure should be restructured to reflect the new
economic reality. In a country with strong insolvency procedures, entering a formal
resolution process helps to solve this problem. Absence of bankruptcy filings would
be indicative of less efficient resolutions.
In a large sample analysis, we have limited visibility into whether a private
negotiation with creditors took place, and whether its outcome was efficient. So, we
should consider whether it is plausible that efficient private resolutions are more
likely when we see fewer formal bankruptcies. Of course, in an extreme, if the
bankruptcy system is very weak, all resolutions will be private. But the question is not
whether private resolutions go up, but whether they are efficient. This is why it is
important to emphasize that formal insolvency rules set up a benchmark that guides
out-of-court restructuring. For example, if filing for bankruptcy allows the firm to
operate as a going concern, and achieve mediated restructuring in a relatively
speedy manner, then any direct resolution with the creditors will have to be at least
as effective (otherwise the firm would file for bankruptcy protection.) 11 In sum, what
seems most plausible is that the correlation between efficiency of private resolutions
(unobservable) and strength of formal bankruptcy procedures is actually positive.
Building on the insight above, we look at the use of the formal bankruptcy system in
periods of economic stress. The regression results are reported in Table 1. The
dependent variable is the number of bankruptcies in a given year, scaled by the
average number of bankruptcies in the preceding two years. Columns (1) and (2)
show the basic cyclicality of financial distress: lower GDP growth, and negative GDP
growth are associated with spikes in bankruptcy rates. What interests us is cross-
country variation in use of bankruptcy in moments of economic stress and its relation
to the effectiveness of insolvency procedures. These results are reported in columns
(3) to (6). The coefficients of interest are interaction terms between measures of
effectiveness of the restructuring framework at the country level and the indicator for
whether GDP growth was negative (“stress” year). Consistent with our hypothesis,
we find that the better bankruptcy system leads to more bankruptcies (i.e., its higher
use.) The results are consistent across all four measures starting with the general
Insolvency Restructuring score.
11 When multiple creditors are involved, it might be desirable to use bankruptcy proceedings to lock in a
private resolution, since effective bankruptcy resolution does not require a universal creditor consent,
and instead is based on supermajority voting thresholds. For example, in the U.S., distressed
restructurings are typically achieved through pre-bankruptcy negotiation and creditor voting (in
accordance with bankruptcy rules) and formally “ceiled” through a bankruptcy filing. Filing for
bankruptcy with a pre-negotiated restructuring plan in turn allows for a quick resolution. Empirically, this
means that filings for bankruptcy actually are positively correlated with effective private restructuring.
Corporate Bankruptcy Rules and Zombie Lending 8Table 1
Use of formal bankruptcy resolution and efficiency of insolvency rules
(1) (2) (3) (4) (5) (6)
GDP growth -0.216* -- -- -- -- --
(0.123)
I (Negative GDP growth) 0.937 -6.383* -5.830* -7.519* 5.965***
(0.805) (3.711) (3.067) (3.940) (2.111)
Insolvency restructuring score -- -- -0.0129 -- -- --
(0.0248)
Insolvency restructuring score -- -- -- -- --
*Stress year 0.0874*
(0.0491)
Recovery rate score -- -- -- -0.0121 -- --
(0.0205)
Recovery rate score *Stress year -- -- -- 0.0796** -- --
(0.0397)
Strength of insolvency framework -- -- -- -- -0.0276 --
(0.0237)
Strength of insolvency -- -- -- --
framework*Stress year 0.114** --
(0.0520)
Resolution time -- -- -- -- -- -0.312
(0.598)
Resolution time*Stress year -- -- -- -- -- -3.533***
(1.222)
Constant -49.95*** -50.41*** -49.13*** -49.14*** -48.38*** -49.66***
(0.353) (0.348) (1.919) (1.682) (1.767) (0.933)
N 224 224 184 184 197 184
R2 0.014 0.006 0.018 0.023 0.030 0.069
Notes: The estimates correspond with an OLS regression. The dependent variable is the growth rate in bankruptcies with respect to
the preceding two-year average. The underlying data is an unbalance country*year panel. ***, **, * denote the 1%, 5% and 10% level
of significance respectively.
Another take at the aggregate tie between the insolvency resolution framework and
the prevalence of effective private insolvency resolution can be seen by looking at
the volume of private debt transactions. (See Table 2.) As discussed in the
introduction, non-bank direct lenders are highly sophisticated creditors that actively
engage in the customization of credit solutions. They lend across the spectrum of
firms, with a large emphasis on distressed and mid-cap firms (i.e., higher risk-higher
expected return as compared to bank lending). 12 Some additional institutional
aspects are important. Similar to private equity, private debt is typically funded
through finite life closed end funds. Although assets can be held beyond fund life, it
effectively requires a formal sale to the next fund. Thus, between higher risk, and
finite horizons, private debt creditors are particularly dependent on effective
insolvency systems. To reiterate, between expertise, flexible institutional mandates
and low coordination costs (as this debt is not widely held), private debt creditors are
also well positioned to put forward private resolutions of insolvency. Ultimately,
however, because private resolution is shaped by the formal insolvency rule, our
hypothesis is that we should see that private debt markets are less likely to develop
in weaker insolvency regimes.
12 For more information see 2020 American Finance Association Annual Meeting, Panel: “Shadow
Banking: Understanding Private Debt”, https://www.youtube.com/watch?v=kef3uEnvGOQ.
Corporate Bankruptcy Rules and Zombie Lending 9The results in Table 2 support this view. The dependent variable is the number of
private deals closed in the lead three-year window. Panel B include controls for
country-wide bank capitalization. The results are striking. For example, as little as a
1-point difference in insolvency restructuring score leads to 7.4 to 9.9 private deals
difference in the next three year. (We purposefully look at the number of deals and
not the volume.) This is as compared to the median of 21 for the whole sample and
average of 62 deals for European countries. U.S. is an outlier in this market with
1,418 deals on average over the sample. The potential impact of the resolution time
is particularly damming, with one extra year to resolution leading to 136.7 or 170.2
difference in the number of deals over three years.
Table 2
Private debt investments and efficiency of insolvency rules
Panel A
(1) (2) (3) (4)
Insolvency restructuring score 7.447*** -- -- --
(2.725)
Recovery rate score -- 2.760 -- --
(2.278)
Strength of insolvency framework -- -- 12.60*** --
(2.398)
Resolution time -- -- -- -136.7**
(68.08)
GDP growth 5.481 3.898 9.883 4.080
(13.44) (13.65) (13.39) (13.55)
Constant -410.9* -60.30 -724.8*** 357.3***
(213.8) (188.8) (181.8) (104.7)
N 176 176 188 176
R2 0.042 0.009 0.131 0.023
Panel B
(1) (2) (3) (4)
Insolvency restructuring score 9.902*** -- -- --
(3.485)
Recovery rate score -- 4.009 -- --
(2.813)
Strength of insolvency framework -- -- 13.68*** --
(3.148)
Resolution time -- -- -170.2**
(76.90)
GDP growth 8.821 7.666 11.76 8.225
(15.86) (16.17) (15.88) (16.02)
Bank capitalization -21.27* -23.51* -18.94 -23.45*
(11.94) (12.30) (12.12) (12.11)
Constant -228.1 258.8 -491.3 828.0***
(345.6) (296.2) (346.6) (249.3)
N 151 151 156 151
R2 0.072 0.034 0.140 0.052
Notes: The estimates correspond with an OLS regression. The dependent variable is the number of private deals closed in the lead
three-year window. The underlying data is an unbalance country*year panel. ***, **, * denote the 1%, 5% and 10% level of significance
respectively.
In Tables 3 and 4, we move the analysis to the firm level. This requires us to
construct an indicator of whether the firm is “subsidized” by the creditors. Measuring
“subsidized” credit, however, is challenging as banks can transfer resources to the
borrowers in a variety of ways. For example, Caballero, Hoshi and Kashyap (2008)
show that—in the context of the Japanese crisis— such assistance can include
interest concessions, debt forgiveness, and a moratorium on loan amortizations
Corporate Bankruptcy Rules and Zombie Lending 10and/or interest payments. In their sample, they also observe equity injection by
lenders, and debt-equity swaps. Post GFC changes had precluded European banks
from this type of transaction, but there are several anecdotal examples indicating
that equity transactions were common for European banks in the GFC context. The
existing literature detects the subsidy by benchmarking the interest rate implied in
the firms’ interest expected to what would be conservatively the lower bound on
market rate. For example, in European context, Acharya, Eisert and Hirsch (2019)
and Acharya, Crosignani, Eisert and Eufinger (2020) look at the firms that have
implied interest rates below the AAA-like firms.
We depart from this methodology in two ways. First, we look directly at interest rates
of loans, rather than inferring from accounting statements. Caballero, Hoshi and
Kashyap (2008) use implied interest rates (interest expenses divided by interest-
bearing debt in the balance sheet) due to lack of detailed data on the terms of
individual debts. Existing data sources for syndicate credit (which is the relevant
credit market segment for firms with available financial data, that is, firms that tend to
be the focus of firm-level zombie lending analysis) have a comprehensive cross-
country coverage not only of new credit, but also of loan amendments. 13 Given that
the existing narrative focuses on bank-driven zombie lending it makes sense to focus
on the cost of bank loans, as opposed to aggregate interest expenses, which may
include trade credit, market finance, non-bank loans and so on.
The second way in which our methodology differs from the previous literature is
where to draw the line for what we could consider to be unusually “cheap”, and
therefore potentially subsidized credit. One approach is to define a potential zombie
loan as any loan cheaper than the yield on AAA-rated bonds, in other words, the
highest quality credit. This approach suffers from data availability issues: there are
very few European bonds rated AAA. In the bank-centric European financial system,
there may be a “missing mass” of high-quality credits: loans that would be rated
“AAA” do not need to be rated since banks—unlike other large institutional
investors—rely on proprietary credit risk assessment methodologies. 14 Instead, we
focus on “AA”, the next rating category, and loan ratings instead of bond ratings.
There are enough observations of AA credit in our data to construct a reliable
benchmark. That is, in a standard methodology to identify zombie lending, one would
take yields for “AAA” rated bonds and then examine whether the average debt cost
implied in firm’s interest expense is above or below this threshold, regardless of
whether the firm in question is rated. Similarly, using data from Refintiv, we take
newly issued loans rated “AA” and construct a quarterly benchmark of all-fees-in
interest rates. (Not relying on the pricing of corporate bonds, which have different
seniority and tend to be much less standardized on maturity, should reduce noise in
our zombie classification.) To identify zombie loans, we then benchmark current rate
on all outstanding loans in a given quarter against this benchmark, regardless of
13 We should note that zombie lending affects firms of all sizes, including small and medium enterprises.
Loan syndication only applies to large loans. But while our data sources only allow us to look at
zombie lending for firms that borrow in the syndicated loan market, it is unlikely to be a big departure
from other empirical approaches as conditioning the sample to firms with extensive financial
information already constraints the sample to the largest firms.
14 Another contributing factor could be that corporate ratings tend to be capped at sovereign ratings. See
Almeida, Cunha, Ferreira, and Restrepo (2017). Only a handful of sovereigns are highly rated in
Europe.
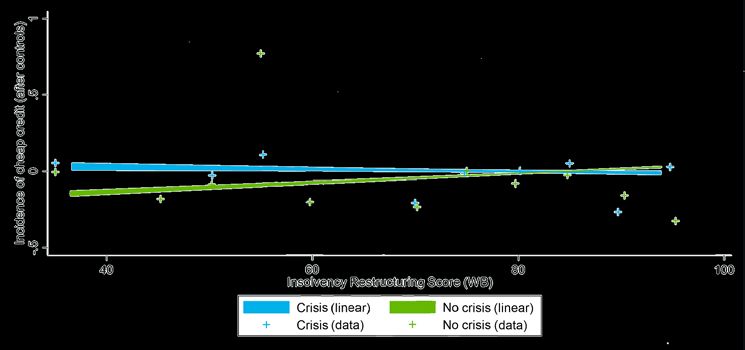
Corporate Bankruptcy Rules and Zombie Lending 11whether loans in question are rated. If the interest rate on the loan is below the “AA” mark we code it as a zombie loan. In addition, to construct benchmark the benchmark, we exclude debt issued by firms in Greece, Ireland, Italy, Portugal, and Spain from the benchmark. Our sample spans the Great Financial Crisis and its aftermath. Country risk might have influenced the rates for even better rated companies in those countries. The exclusion of issuers from the most affected economies leads to a more conservative approach (which is in line with the previous zombie literature) and assured that we are picking truly cheap credit when the firm is classified as a zombie. The benchmark for the U.S., market is computed separately from Europe. The basic result is plotted in Chart 2, and corresponds to estimates in the first column of Table 3, Panel A. The explanatory variables of interest in Table 3 are a regression of Insolvency Restructure Score and Insolvency Restructuring Score*Stress Year. To generate Chart 2, we first omit these variables and instead plot residuals against Insolvency Restructure Score separately for years with negative GDP growth (“crisis”) and years without positive GDP growth (“no crisis”). (Confidence intervals do not account for clustering, but still help give some sense of precision.) The idea is the following: imagine that we would just plot the zombie dummy against the insolvency score separately for (i) crisis years (blue); (ii) non- crisis years (green), and then draw a linear fit through each of these samples. This is the intuition behind Chart 2, except that in our context there are a few controls. In particular, we ought to account for firm level and loan characteristics. So, instead of plotting raw data we plot residuals from regressing data on controls. To give a sense of residuals dispersion, the chart also plots underlying data grouped in buckets of five on the insolvency score. In sum, Chart 2 suggests that—in a crisis—weak insolvency regimes give cheap credit (which given the firm level controls are used as a zombie proxy). Corporate Bankruptcy Rules and Zombie Lending 12
Chart 2
Use of bankruptcy and strength of insolvency regime

World Bank Main Insolvency Score
(The score varies from 0 to 100.)

Notes: The figure shows the linear regression relationship between zombie lending and the Insolvency Restructuring Score (or Main
Score) from the World Bank survey. The blue line refers to crisis years (negative GDP growth) and the green line refers to non-crisis
years (positive GDP growth). Data points refer to averages by grouping observations with similar insolvency scores (only buckets with
100 or more borrower-year observations are plotted).

Table 3 reports results of the regressions. The dependent variable is a dummy equal
to 100 if the active interest rate on the loan is below the rate on the new loans issued
over the preceding four quarters and rated “AA” in the benchmark market, and zero
otherwise. All regressions include 2-digit SIC industry controls and year fixed effects.
In addition, we control for loan characteristics including loan amount maturity at
origination or amendment and dummy for whether the loan is a revolving line. 15 We
also control for lagged firm size and leverage. Standard errors are clustered at the
country level. Panel A focuses on country-specific “stress years” defined as years
with negative GDP growth. In Panel B, stress years are defined as 2008-2013 and
2020.

As before, the explanatory variables of interest are interaction terms between
measures of country’s resolution system efficiency and stress years. The results
indicate that in countries with better insolvency frameworks and better overall
restructuring, scoring cheap credit is less likely to take place in economic downturns.
Note that this cannot be merely picking up a differential flight to quality given the firm
level controls. Thus, what we see it not that in countries with weaker insolvency
systems lenders shift to large or less levered borrowers, but instead shift to
substantially cheaper credit controlling for these characteristics. In a year with
negative GDP growth, a 10-point increase in the Insolvency Restructuring Score is
associated with a 4.8 percentage point increase in the likelihood of there being a
zombie loan, which is sizable as compared to the unconditional mean of 12.3%.
Although the results on recovery rates and resolution duration are not statistically

15   Syndicated loans typically contain multiple facilities. Although many of the facilities are shared through
     the credit agreement, e.g., the core facilities are pari passu, they could have different maturities and
     interest rates. Given our emphasis on the cost of credit each observation in out sample is a facility.

Corporate Bankruptcy Rules and Zombie Lending                                                                                    13
significant at conventional levels, they are the predicted sign and economically meaningful. Corporate Bankruptcy Rules and Zombie Lending 14
Table 3
Zombie lending and efficiency of insolvency rules
Panel A: “Stress year” is a year of negative GDP growth in a given country

                                                                          (1)        (2)         (3)         (4)
 Insolvency restructuring score                                        0.475**        --          --          --
                                                                        [0.164]
 Insolvency restructuring score *Stress year                           -0.501**       --          --          --
                                                                        [0.174]
 Recovery rate score                                                       --       0.034         --          --
                                                                                   [0.112]
 Recovery rate score *Stress year                                            --    -0.029         --          --
                                                                                   [0.148]
 Strength of insolvency framework                                            --       --      0.321***        --
                                                                                               [0.070]
 Strength of insolvency framework*Stress year                                --       --      -0.297***       --
                                                                                               [0.067]
 Resolution time                                                             --       --          --       -8.377**
                                                                                                            [3.870]
 Resolution time*Stress year                                                 --       --          --         4.940
                                                                                                            [4.506]
 Log(Loan amount)                                                       -1.101      -0.780      -0.320      -1.098
                                                                        [0.751]     [0.800]     [0.369]     [0.726]
 Loan maturity                                                          -0.016      -0.024      -0.005      -0.014
                                                                        [0.017]     [0.015]     [0.009]     [0.015]
 I(Revolving line)                                                     4.178***    4.448***    4.230***    4.123***
                                                                        [1.068]     [0.951]     [0.386]     [1.046]
 Log (assets), t-1                                                     4.149***    3.959***    3.426***    4.208***
                                                                        [1.239]     [1.295]     [0.484]     [1.242]
 Book leverage, t-1                                                    -13.209     -12.099    -12.705***   -12.501
                                                                        [7.808]     [8.093]     [2.150]     [8.163]
 I (Negative GDP growth)                                               35.865**     -0.088    21.339***     -8.209
                                                                       [14.517]    [11.760]     [5.751]     [6.741]
 Fixed effects: Year/Industry                                          Yes/Yes     Yes/Yes     Yes/Yes     Yes/Yes
 N                                                                     103,339     103,339     224,677     103,339
 R2                                                                      0.122       0.111       0.152       0.116

Panel B: “Stress years” are 2008-2013 and 2020

                                                                           (1)       (2)         (3)         (4)
 Insolvency restructuring score                                         0.567***      --          --          --
                                                                         [0.178]
 Insolvency restructuring score *Stress year                           -0.562***      --          --          --
                                                                         [0.186]
 Recovery rate score                                                        --      0.044         --          --
                                                                                   [0.158]
 Recovery rate score *Stress year                                            --    -0.036         --          --
                                                                                   [0.185]
 Strength of insolvency framework                                            --       --      0.351***        --
                                                                                               [0.090]
 Strength of insolvency framework*Stress year                                --       --      -0.236**        --
                                                                                               [0.090]
 Resolution time                                                             --       --          --       -9.395**
                                                                                                            [4.350]
 Resolution time*Stress year                                                 --       --          --         7.582
                                                                                                            [5.311]
 Log(Loan amount)                                                       -1.117      -0.774      -0.280      -1.093
                                                                        [0.741]     [0.803]     [0.386]     [0.716]
 Loan maturity                                                          -0.018      -0.024      -0.003      -0.017
                                                                        [0.017]     [0.016]     [0.010]     [0.016]
 I(Revolving line)                                                     4.162***    4.460***    4.263***    4.111***
                                                                        [1.057]     [0.915]     [0.356]     [1.036]
 Log (assets), t-1                                                     4.102***    3.960***    3.402***    4.182***
                                                                        [1.245]     [1.291]     [0.494]     [1.233]
 Book leverage, t-1                                                    -13.494     -12.143    -12.699***   -12.621
                                                                        [7.698]     [8.072]     [2.154]     [8.143]
 Fixed effects: Year/Industry                                          Yes/Yes     Yes/Yes     Yes/Yes     Yes/Yes
 N                                                                     103,339     103,339     224,677     103,339
 R2                                                                      0.124       0.110       0.153       0.117

Corporate Bankruptcy Rules and Zombie Lending                                                                      15
Notes: The estimates correspond with an OLS regression (this allows inclusion of fixed effects). The dependent variable is a dummy equal to 100 if the current interest rate on the loan is below the rate of the new loans issued over the preceding four quarters and rated “AA” in the benchmark market. Loans to US companies are benchmarked against the rates in the US market, and loans to European companies and benchmarked against loans issued in the EU and U.K. market excluding Greece, Ireland, Italy, Portugal, and Spain. Standard errors are clustered at the country level. ***, **, * denote the 1%, 5% and 10% level of significance respectively. Table 4 includes controls for country-level bank-sector capitalization. Low bank capitalization sharpens bank incentives to issue zombie loans. Controlling for bank capitalization partially helps to focus on incentives to pursue zombie lending that are grounded in lack of insolvency restructuring solutions. Although, the exact separation of these interlinked effects cannot be achieved without an instrumental approach. We use country-average Tier 1 bank sector capitalization as reported in the Bank for International Settlements (BIS) database. The results in Table 4 indicate that zombie loans are less likely to take place in countries with higher bank capitalization. This is consistent with the standard prediction and result in the literature (e.g., Schivardi, Sette and Tabllini, 2021). Our focus continues to be on interaction terms between measures of insolvency framework strength and stress years. The results are robust to these additional controls: in a year with a negative GDP, a 10 point higher Insolvency Restructuring Score is associated with a 4.0 percentage point increase in the likelihood of there being a zombie loan (as compared to the unconditional mean of 12.3%.) Corporate Bankruptcy Rules and Zombie Lending 16
Table 4
    Zombie lending and efficiency of insolvency rules, conditional on bank capitalization
    Panel A: “Stress year” is a year of negative GDP growth in a given country

                                                                                (1)              (2)              (3)               (4)
     Insolvency restructuring score                                          0.398***             --               --                --
                                                                              [0.123]
     Insolvency restructuring score *Stress year                             -0.391**             --               --                --
                                                                              [0.164]
     Recovery rate score                                                         --           0.180**              --                --
                                                                                              [0.074]
     Recovery rate score *Stress year                                            --           -0.054               --                --
                                                                                              [0.137]
     Strength of insolvency framework                                            --              --             0.167**              --
                                                                                                                [0.072]
     Strength of insolvency framework*Stress year                                --               --           -0.203**              --
                                                                                                                [0.078]
     Resolution time                                                             --               --               --          -10.038***
                                                                                                                                 [2.522]
     Resolution time*Stress year                                                 --               --               --             3.853
                                                                                                                                 [3.748]
     Bank capitalization                                                     -2.333***       -2.831***         -2.151***        -2.646***
                                                                              [0.373]         [0.370]           [0.308]          [0.357]
     Fixed effects: Year/Industry                                            Yes/Yes         Yes/Yes           Yes/Yes          Yes/Yes
     Controls (Table 3)                                                         Yes             Yes               Yes              Yes
     N                                                                        87,483          87,483            159,889          87,483
     R2                                                                        0.145           0.142             0.151            0.147

    Panel B: “Stress years” are 2008-2013 and 2020

                                                                                (1)              (2)              (3)               (4)
     Insolvency restructuring score                                          0.490***             --               --                --
                                                                              [0.149]
     Insolvency restructuring score *Stress year                             -0.431**             --               --                --
                                                                              [0.171]
     Recovery rate score                                                         --           0.210*               --                --
                                                                                              [0.101]
     Recovery rate score *Stress year                                            --           -0.080               --                --
                                                                                              [0.131]
     Strength of insolvency framework                                            --              --             0.242**              --
                                                                                                                [0.083]
     Strength of insolvency framework*Stress year                                --               --           -0.297***             --
                                                                                                                [0.081]
     Resolution time                                                             --               --               --          -10.702***
                                                                                                                                 [2.617]
     Resolution time*Stress year                                                 --               --               --             4.166
                                                                                                                                 [3.486]
     Bank capitalization                                                     -2.181***       -2.796***         -2.099***        -2.595***
                                                                              [0.394]         [0.384]            [0.302]         [0.385]
     Fixed effects: Year/Industry                                            Yes/Yes         Yes/Yes           Yes/Yes          Yes/Yes
     Controls (Table 3)                                                         Yes             Yes                Yes             Yes
     N                                                                        87,483          87,483            159,889          87,483
     R2                                                                        0.146           0.141              0.152           0.146

    Notes: The estimates correspond with an OLS regression (this allows inclusion of fixed effects). The dependent variable is a dummy
    equal to 100 if the current interest rate on the loan is below the rate of the new loans issued over the preceding four quarters and rated
    “AA” in the benchmark market. Loans to US companies are benchmarked against the rates in the US market, and loans to European
    companies and benchmarked against loans issued in the EU and U.K. market excluding Greece, Ireland, Italy, Portugal, and Spain.
    Bank capitalization corresponds to country level bank capitalization from Bank for International Settlements. Standard errors are
    clustered at the country level. ***, **, * denote the 1%, 5% and 10% level of significance respectively.

4   Final Discussion
    We propose that zombie lending – the practice of issuing bank loans at subsidized
    rates to otherwise insolvent borrowers – is affected not just by banks’ incentive
    problems and the conventional understanding, but also by the financial outcomes for

    Corporate Bankruptcy Rules and Zombie Lending                                                                                         17
lenders in insolvency processes. Insolvency processes vary significantly in quality and efficiency across countries. We argue that poor insolvency outcomes encourage zombie lending, as a way of avoiding triggering procedures. Banks incentive still matter, but policy actions that solely seek to ex-ante better align or ex-post realign banks’ incentives cannot singlehandedly resolve zombie problem. Weak insolvency processes also create zombie lending incentives for all types of creditors and not just banks. This point is central to consider given insurance companies’ role in the debt market, and pension funds active expansion into direct lending. It is also relevant for the leveraged loan market, which is originated by banks and largely funded by a wide range of institutional investors including mutual funds and structured products marketed to insurance companies, and pension funds. In sum, even if the problem would be solely constrained to banks, strong insolvency proceedings would be a necessary policy action to address zombie lending. But the problem percolates though a wide range of essential financial institutions and not just banks. (This also highlights a limitation of empirical research focused solely on bank credit.) Overall, improvement in the insolvency regime is of macroeconomic importance, as zombie lending has been shown to stale economic growth through the misallocation of credit. There is also a practical policy matter: insolvency frameworks, which have deep historical and cultural roots, cannot be fixed overnight, and ex-post set of tools on this front is limited. As a final matter, we want to raise the observation that reform of formal insolvency procedures is likely to be more effective if it can be broad-based and standardized across countries. A critical issue, beyond the scope of this paper, is the role of insolvency resolution outside of formal procedures. Formal insolvency processes often set a floor for resolution efficiency, and private resolutions can improve upon it. But corporate restructurings – especially for companies with complex capital structures, intangible assets and multinational operations – are unavoidably complex and require profound understanding of both economics and law. For such expertise to emerge and be competitive, there must be sufficient scale to justify this building expertise. In a European setting, if each country has a unique set of rules for insolvency resolution, lack of scale in resolutions will hamper efficiency of private solutions. This is consistent with the evidence that non-bank private debt development lags in countries with weak insolvency systems. For all these reasons, the European Union Insolvency Reform offers the best hope for developing an effective framework that facilitates and fosters efficient resolution, and, among other things, helps to reduce zombie lending. Appendix Bankruptcy data was collected from individual countries official sources. This appendix presents a table that summarizes the sources. After collecting the data, we filtered out NACE Rev2 industry sectors “K - Financial and insurance activities”, “T - Activities of households as employers; undifferentiated goods- and services- Corporate Bankruptcy Rules and Zombie Lending 18
producing activities of households for own use”, and “U - Activities of extraterritorial
organizations and bodies”. For US we only use Chapter 7 and Chapter 11
bankruptcies.

Table A.1
Bankruptcy data sources by country

 Country             Source                                Website
 Austria             Statistik Austria                     https://www.statistik.at/web_en/statistics/ind
                                                           html

 Belgium             Statbel                               https://bestat.statbel.fgov.be/bestat/crossta
                                                           html?view=f00cf502-ee2f-48a8-8b1a-
                                                           0b323f02350b

 Denmark             Statbank Denmark                      https://www.statbank.dk/statbank5a/default
                                                           ?w=1920

 Finland             StatFin                               https://pxnet2.stat.fi/PXWeb/pxweb/en/Stat

 France              Banque de France                      http://webstat.banque-
                                                           france.fr/en/browseBox.do?node=5385030

 Germany             Statistisches Bundesamt               https://www.destatis.de/EN/Service/_node.

 Greece              Hellenic Statistical Authority        https://www.statistics.gr/en/statistics/-
                                                           /publication/SJU21/2019

 Italy               Camera di Commercio delle Marche      https://opendata.marche.camcom.it/datase
                                                           ?url=https://opendata.marche.camcom.it/da
                                                           rocedure-Concorsuali-Italia.json&r1=2&c1=

 Luxembourg          Statistics Portal Grand Duchy of https://statistiques.public.lu/stat/TableViewe
                     Luxembourg                       bleView.aspx?ReportId=13303&IF_Langua
                                                           eng&MainTheme=4&FldrName=1&RFPath
                                                           835%2c13847

 Netherlands         CBS Open data StatLine                https://opendata.cbs.nl/portal.html?_la=en&
                                                           talog=CBS&tableId=82522ENG&_theme=1

 Portugal            Instituto Nacional de Estatistica     https://www.ine.pt/xportal/xmain?xpid=INE&
                                                           id=ine_indicadores&contecto=pi&indOcorrC
                                                           0008466&selTab=tab0

 Spain               Instituto Nacional de Estatistica     https://www.ine.es/jaxiT3/Tabla.htm?t=316

 Sweden              SCB                                   http://www.statistikdatabasen.scb.se/pxweb
                                                           ssd/START__NV__NV1401/KonkurserFore
                                                           ?rxid=b076f788-b670-4e06-a5f3-c1431573

 United Kingdom      CEIC                                  https://insights-ceicdata-com.prd1.ezproxy-
                                                           prod.hbs.edu/login

 United States       New Generation Research
                     Bankruptcy Data

References
Acharya, V.V., Crosignani, M., Eisert, T. and Eufinger, C. (2020), “Zombie Credit and
(Dis-)Inflation: Evidence from Europe”, National Bureau of Economic Research
Working Paper 27158.

Corporate Bankruptcy Rules and Zombie Lending                                                          19
Acharya, V.V., Eisert, T. and Hirsch, C. (2019), “Whatever It Takes: The Real Effects of Unconventional Monetary Policy”, Review of Financial Studies, Vol. 32, No. 9, pp. 3366-3411. Adalet McGowan, M. and Andrews D., 2018, “Insolvency Regimes and Productivity Growth: A Framework for Analysis,” OECD Economics Department Working Papers 1309. Almeida, H., Cunha, I., Ferreira, M., and Restrepo, F. (2017), “The Real Effects of Credit Ratings: The Sovereign Ceiling Channel”, Journal of Finance, Vol. 72, No. 1, pp. 249-290. Andrews, D. and Petrolakis, F. (2019), “Breaking the Shackles: Zombie Firms, Weak Banks and Depressed Restructuring in Erurope”, European Central Bank Working Paper 2240. Banerjee, R. and Hofmann, B. (2018), “The Rise of Zombie Firms: Causes and Consequences”, BIS Quarterly Review, September, pp. 68-77. Becker, B. and Josephson, J. (2016), “Insolvency Resolution and the Missing High- Yield Bond Markets”, Review of Financial Studies, Vol. 29, No. 10, pp. 2814-2849. Becker, B. and Oehmke, M. (2021), “Preparing for Post-Pandemic Rise in Corporate Insolvencies”, European Systemic Risk Board, ASC Insight, No 2. Blattner, L, Farinha, L. and Rebelo, F. (2019), “When Losses Turn into Loans: The Cost of Undercapitalized Banks”, European Central Bank – Lamfalussy Fellowship Programme, No. 2228. Bolton, P. and Scharfstein, D. (1996), “Optimal Debt Structure and the Number of Creditors,” Journal of Political Economy, Vol. 104, No.1, pp. 1-25. Caballero, R., Hoshi, T. and Kashyap, A.K. (2008), “Zombie Lending and Depressed Restructuring in Japan”, American Economic Review, Vol. 98, No. 5, pp. 1943-1997. Chernenko, S. and Sunderam, A. (2012), “The Real Consequences of Market Segmentation,” Review of Financial Studies, Vol. 25, No. 7, pp. 2041-2070. Davydenko, S.A. and Franks, J.R. (2008), “Do Bankruptcy Codes Matter? A Study of Defaults in France, Germany, and the U.K.”, Journal of Finance, Vol. 63, No. 2, pp. 565-608. Diamond, D.W. and Rajan, R. G. (2011), “Fear of Fire Sales, Illiquidity Seeking, and Credit Freezes”, Quarterly Journal of Economics, Vol. 126, No. 2, pp. 557-591. Djankov, S., Hart, O., McLiesh, C. and Shleifer, A. (2008), “Debt Enforcement around the World”, Journal of Political Economy, Vol. 116, No. 6, pp. 1105-1149. Ellias, J., Iverson, B., and Roe M. (2020), “Estimating the Need for Additional Bankruptcy Judges in Light of the COVID-19 Pandemic,” Harvard Business Law Review, Vol. 11. Corporate Bankruptcy Rules and Zombie Lending 20
Greenwood, R., Iverson, B., and Thesmar, D. (2020), “Sizing up Corporate
Restructuring in the COVID Crisis”, NBER Working paper 28104.

Group of Thirty, 2020, “Revitalizing and Restructuring Corporate Sector Post-Covid,”
https://group30.org/publications/detail/4820.

Hoshi, T. and Kashyap, A. K. (2004), “Japan’s Financial Crisis and Economic
Stagnation”, Journal of Economic Perspectives, Vol. 18, No, 1, pp. 3-26.

Ivashina, V., Dionne, J. and Boyar, J. (2017), “Blackstone’s GSO Capital: Crosstex
Investment,” Harvard Business School Case 218-008.

Jensen, M. and Meckling, W. H. (1976), “Theory of the firm: Managerial behavior,
agency costs and ownership structure”, Journal of Financial Economics, Vol. 3, No.
4, pp. 305-360.

Lane, P. R., “Monetary Policy in a Pandemic: Ensuring Favourable Financing
Conditions,” Trinity College Dublin, 26 November 2020.

McGowan, M.A., Andrews, D. and Millot, V. (2018), “The walking dead? Zombie firms
and productivity performance in OECD countries”, Economic Policy, Vol. 33, No. 96,
pp. 687-736.

Peek, J. and Rosengren, E.S. (2005), “Unnatural Selection: Perverse Incentives and
the Misallocation of Credit in Japan”, American Economic Review, Vol. 95, No. 4, pp.
1144-1166.

Ponticelli, J. and Alencar, L.S. (2016), “Court Enforcement, Bank Loans, and Firm
Investment: Evidence from a Bankruptcy Reform in Brazil”, Quarterly Journal of
Economics, Vol. 131, No. 3, pp. 1365-1413.

Schivardi, F., Sette, E. and Tabellini, G. (2021), “Credit Misallocation During the
European Financial Crisis”, The Economic Journal.

Corporate Bankruptcy Rules and Zombie Lending                                         21
You can also read