Corporate Bond Markets - Drivers of Liquidity During COVID-19 Induced Market Stresses Discussion Paper - OR02
←
→
Page content transcription
If your browser does not render page correctly, please read the page content below
Corporate Bond Markets – Drivers of Liquidity
 During COVID-19 Induced Market Stresses

               Discussion Paper

                     The Board

                       OF THE
 INTERNATIONAL ORGANIZATION OF SECURITIES COMMISSIONS
OR02                                       APRIL 2022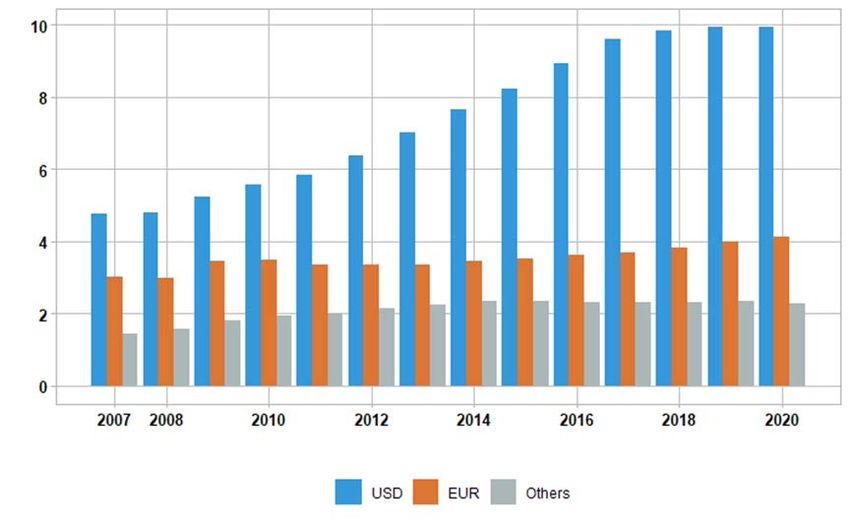
Table of Contents

Executive Summary .............................................................................................................. 1
Part A - Background of corporate bond markets globally ................................................ 9
   A1 - Corporate bonds are essentially buy and hold instruments ................................................ 9
   A2 - Issuance and market growth over the past decade .............................................................. 9
   A3 - The role of primary markets ................................................................................................. 11
Part B - Liquidity during the COVID-19 induced stress .................................................... 12
   B1 – Measure of liquidity – level of primary markets issuance .................................................. 12
   B2 – Measure of liquidity - level of activity ................................................................................. 13
      B2.1 - The level of activity varied across jurisdictions ............................................................. 13
      B2.2 - The level of activity varied across types of bonds ......................................................... 14
      B2.3 - The level of activity was impacted by the central bank interventions ....................... 14
   B3 - Measure of liquidity - price/transactions costs ................................................................... 15
Part C - The drivers of liquidity - supply, demand, and market participant behaviors. 16
   C1 - The demand for liquidity .......................................................................................................16
      C1.1 - The role of long-term investors ....................................................................................... 16
      C1.2 - The role of open-ended funds ......................................................................................... 22
      C1.3 – The role of the official sector .......................................................................................... 23
      C1.4 – The role of distressed buyers .......................................................................................... 24
   C2 - The supply of liquidity - the role of dealers ....................................................................... 26
      C2.1 - Dealer behavior during and since the March 2020 turmoil ......................................... 27
      C2.2 - Dealer inventory and central bank intervention: ......................................................... 28
      C2.3 - Drivers of dealer behavior ............................................................................................... 30
Part D - Corporate bond markets’ structure and implications on liquidity provision .. 32
   D1 – General features of the corporate bond markets microstructure ..................................... 32
   D2 – Dealer intermediation and concentration ......................................................................... 33
   D3 - Corporate bond heterogeneity and standardization ......................................................... 34
   D4 - Trading in corporate bonds ................................................................................................ 35
   D5 - Growth of electronic trading ............................................................................................... 36
   D6 - Increased transparency ....................................................................................................... 39
Annex 1 – Discussion questions ......................................................................................... 41
Annex 2 – References ......................................................................................................... 43
Abbreviations used in this report .....................................................................................45

                                                                    ii
Executive Summary
Corporate bond markets are an important part of the global capital markets and play a key role
in financing the real economy. As part of IOSCO’s objectives, there is keen interest in ensuring
the fair, efficient and transparent functioning of these markets and in reducing systemic risk.
The COVID-19 induced market stresses in March 2020 highlighted the potential systemic
importance of liquidity dysfunction in corporate bond markets. This episode also offers
regulators the opportunity to observe and develop insights into how corporate bond markets
operate under stressed conditions.

As part of its 2021-22 work plan, IOSCO established a Corporate Bond Market Liquidity (CBML)
working group through its Financial Stability Engagement Group (FSEG). The CBML was tasked
with analyzing the corporate bond market microstructure, resilience and liquidity provision
during the COVID-19 induced market stresses of March 2020 and subsequent months. 1 Parts of
the CBML’s work have also contributed to IOSCO’s wider input to the Financial Stability Board
(FSB) Non-Bank Financial Intermediation (NBFI) workplan.

The work was conducted over two phases. Phase 1 provided a data-driven diagnostic review of
the corporate bond markets liquidity during the COVID-19 induced market stresses. Phase 2
expanded on the Phase 1 work, firstly, by analyzing in greater depth the market participant
behavior during the COVID-19 induced market stresses and the drivers of the behavior, and
secondly, by analyzing possible vulnerabilities in the corporate bond market structure.

The analysis relies on data from key jurisdictions for the US Dollar, Euro, British Pound,
Canadian Dollar, Japanese Yen and Brazilian Real corporate bond markets and is supplemented
by a literature review as well as by extensive external stakeholder engagement. 2, 3

Purpose of discussion paper.

This report summarizes the results of IOSCO’s analysis and solicits views from stakeholders on
the key outcomes described below. Specifically, IOSCO is interested in stakeholders’ feedback
on possible ways to help improve market functioning and liquidity provision, such as assessing

1   IOSCO has previously undertaken work to better understand how corporate bond markets function, including
    during periods of stress. For example, in 2017 IOSCO published a report by its Committee 2 on Secondary
    Markets (C2) examining liquidity in corporate bond
    (https://www.iosco.org/library/pubdocs/pdf/IOSCOPD558.pdf) markets and in 2018 published
     recommendations by C2 to improve regulatory reporting and transparency:
     (https://www.iosco.org/library/pubdocs/pdf/IOSCOPD597.pdf). In addition, in 2019, the IOSCO published a
    report by its Committee on Emerging Risks (CER) that examined how liquidity in corporate bond markets might
    behave under conditions of market stress (https://www.iosco.org/library/pubdocs/pdf/IOSCOPD634.pdf).
2   IOSCO conducted a series of industry round tables, follow up discussions with participants, bilateral discussions
    with market participants, extensive engagement with trade bodies (including with a large number of their
    members) and selected surveys of IOSCO and FSB jurisdictions.
3   Note that the descriptions of market trends, observations, and key outcomes identified during the analysis
    may not be applicable to all jurisdictions.

                                                        1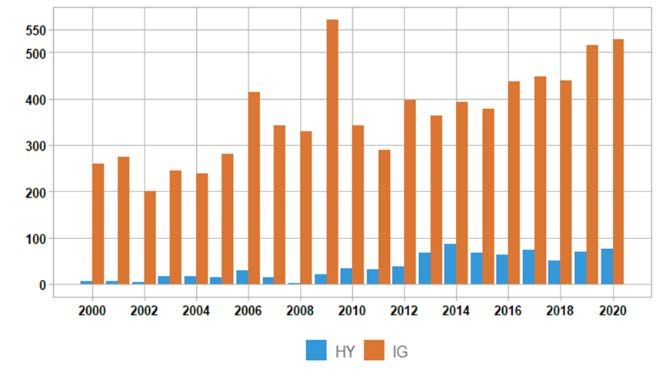
the feasibility, benefits and costs of mitigating shifts in liquidity demand and alleviating supply
side market constraints, including the potential unintended consequences from any prospective
market changes. Possible areas of further inquiry, as raised by industry and academia during the
development of this report, include analyzing whether there could be greater use of “all-to-all”
trading or ways to reduce the frictions currently inhibiting its wider use. This might include
consideration of improving price transparency in corporate bond markets and a further
exploration of the benefits, drawbacks, and practicality of reducing heterogeneity of bonds and
increasing standardization.

IOSCO would also be interested in stakeholders’ perspectives on how to advance the quantity,
quality, and availability of public and private data. Consistent, comparable data is a critical
component for market participants, central banks, and regulators alike, allowing them to trade
and monitor markets fairly, efficiently, and effectively, particularly during times of stress.

Key discussion questions are included under each section of the report and are collated in Annex
1 – Discussion questions

Who will be interested in this discussion paper?

This report will interest a broad audience, including direct and indirect market participants,
credit rating agencies, and academia.

The report is organized around four sections.

Section A provides background information and a brief description of the main features of the
corporate bond markets.

Section B includes a summary of the Phase 1 outcomes with respect to the state of liquidity
during the March stress. Liquidity is measured along three dimensions: (1) primary issuances
levels, (2) secondary market trading volumes; and (3) the prices or implied costs of executing
secondary market transactions in corporate bonds.

Section C analyses the supply of and demand for liquidity. This includes analyzing how market
participants, namely long-term investors such as insurance companies and pension funds, as
well as asset managers and hedge funds, drove the demand for liquidity during the COVID-19
market stress. On the supply side, this section looks at the behavior of dealers, 4 the drivers for
their behavior, and their role in supplying liquidity to the market. Section D also touches on the
role of central banks and other large official sector participants.

The report concludes with Section D, an analysis of corporate bond market structure. This
section investigates how the evolution of corporate bond markets, including its structural
features, have impacted the provision of liquidity. The section first looks at the recent evolution
of the corporate bond market microstructure, focusing on the key features of the traditional
dealer-based model that uses bilateral over-the-phone “voice” model to connect investors and

4   This includes broker-dealers.

                                                2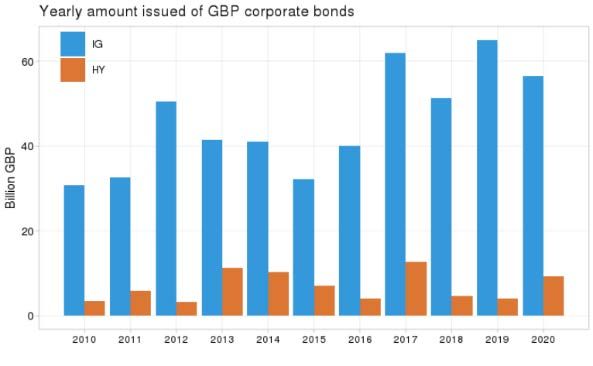
dealers (versus multilateral Request-for-Quote (RFQ) platforms). The report then looks closer
at specific elements of market structure, such as bond heterogeneity, standardization,
electronification, trading characteristics, and transparency.

The key outcomes of this report are summarized below.

Corporate bond markets have grown significantly since the Global Financial Crisis (GFC).
IOSCO’s analysis attributes this to several factors, including benign economic conditions
underpinned by accommodative monetary policies, banking sector deleveraging, supportive tax
treatment of debt over equity, and the increased role of central banks in certain corporate bond
markets. This is in conjunction with post-GFC reforms, which, in part by design, have shifted
credit intermediation to the capital markets.

Although market dynamics are evolving with new entrants such as ETFs and increased
electronification, corporate bond markets maintain a large institutional and buy-and-hold
component and remain mostly reliant on a limited number of dealers for intermediation. The
continued reliance on bilateral OTC dealer-intermediated trading also comes at a time when
the liquidity supply by dealers is more constrained and less responsive to sudden increases in
demand than before the GFC. Dealers are also committing less of their balance sheets to market-
making activities. No single factor can explain dealer behavior in March 2020, but a few factors
do stand out, including large one-sided flows; internal risk appetite and management of balance
sheet limits; and the extreme uncertainty that made risk management difficult.

There are currently limited alternative sources of liquidity, as well as challenges to improving
market-making. These factors, taken together mean that corporate bond markets may be unable
to absorb significant and sudden increases in selling pressure, such as those experienced under
market stress.

During the COVID-19 induced market stresses of March 2020, the corporate bond markets
experienced reduced liquidity. It is difficult to assess whether corporate bond market liquidity
declined primarily because of reduced liquidity supply by dealers, increased liquidity demand
by investors, or a combination of both – and what the greater relative contributor to the stresses
was.

                                   Summary key outcomes:

1.     Corporate bond markets have grown significantly, including on a cross-border
basis, over the past decade, with new issuance volume almost tripling in certain
jurisdictions.

The size of the corporate bond markets has grown significantly over the past decade reflecting
growth in corporate leverage. In the US, the amount outstanding for corporate bonds increased
from 2008 to Q1 2020 by approximately 80%, to almost US$10 trillion. Corporate bonds
outstanding in the euro area rose by one-third over the same period, to US$4 trillion.

Various factors have contributed to the growth of the corporate bond markets, including benign
economic conditions driven by accommodative monetary policies, banking sector deleveraging,

                                                3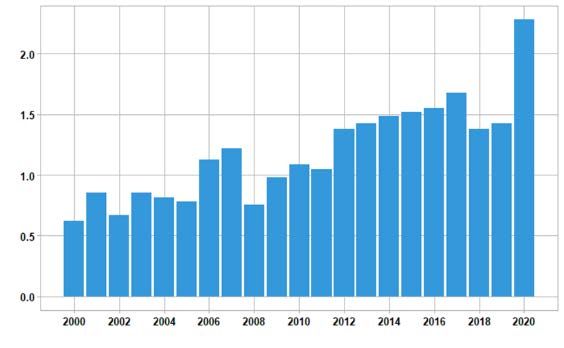
supportive tax treatment of debt over equity, and the increased role of some central banks in
corporate bond markets. 5

2.   Corporate bond markets are less liquid than some other traded markets and the
number of individual corporate debt securities that trade regularly is small.

Secondary trading in corporate bonds differs from trading in other asset classes, such as equities.
Bonds are heterogeneous securities compared to equities, with an interest rate component
across different maturities, structures, and risk profiles. Generally, only the largest bonds trade
regularly. Even those bonds that are largest in outstanding size and most traded do not match
the liquidity and relatively narrow bid-ask spreads of agency Mortgage-backed Securities,
Treasuries or, as an alternative point of comparison, large corporate equity listings.

While large-cap equities trade thousands of times a day (or more), bonds – even the ones
considered liquid – may not trade every day. Larger institutional trades have historically
dominated these markets. However, corporate bond turnover ratios (value traded over amount
outstanding) are not much lower than the turnover ratios for stocks. This is because when
corporate bonds do trade, the amounts are large.

3.      Primary markets are important to the overall market liquidity

Active primary corporate bond markets signal positive sentiment for the asset class, provide an
important component in price discovery and assessing credit spreads, and provide the buyside
with essential depth on the offer side of the market. Newly issued (“on-the-run”) bonds are
generally more heavily traded. Trading in secondary markets is closely connected to conditions
in primary markets. At the same time, primary issuance normally only occurs in a stable
secondary market environment.

Primary markets constitute a monetary policy transmission channel for some central banks. As
a result, the market dysfunction and resulting yield increases triggered rapid central bank
interventions to restore market liquidity.

4.     Overall, the broader corporate bond market showed reduced liquidity during
the turmoil.

The March 2020 episode was a sharp and short-lived market liquidity crisis triggered by a shock
originating from outside the financial system. Therefore, it differed significantly from the GFC,
which was a large-scale credit crisis endogenous to the financial system that unfolded over
several months. Following the announcement of coordinated central bank intervention in
March 2020, market confidence and functioning were restored and, as a result, the most severe
market disruption lasted only a few weeks.

Nonetheless, during those few weeks, the effects of the pandemic and the public health
measures taken by governments to contain them led to widespread uncertainty and investor

5    The importance of each factor varies by jurisdiction. For example, prior to March 2020, the US Federal
     Reserve did not participate in corporate bond markets, whereas central banks played an active role in other
     jurisdictions.

                                                        4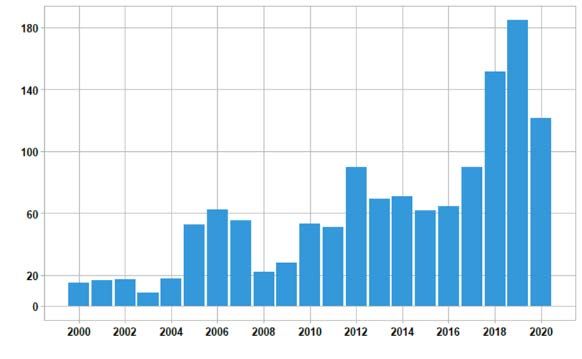
demand for cash liquidity. Liquidity challenges affected some parts of the corporate bond
market more severely than others. Trading was particularly challenging for block trades. In most
jurisdictions, reflecting investor liquidity needs, initially only shorter dated and high-quality
bonds were traded, although even the market in those thinned out and the credit curve flattened
or even inverted. Liquidity was more robust in larger bond issues, particularly in the US.

The markets swiftly recovered following central bank intervention, with issuance levels reaching
record volumes in investment grade bonds (albeit at a higher risk premium compared to before
the crisis).

5.     It is difficult to assess whether corporate bond market liquidity primarily dried-
up because of reduced liquidity supply by dealers, increased liquidity demand by
investors, or a combination of both – and what was the greater relative contributor to
the stresses.

Market participant behavior played a significant role during the weeks before central bank
intervention, either in exacerbating or failing to stabilize market liquidity. Given the central role
of bank-dealers in the corporate bond markets, the reduced elasticity of their balance sheets
was one factor that likely limited their ability to absorb significant marginal selling pressures
(i.e., the increased demand for liquidity). These dealer balance sheet constraints may be one of
the causes for the liquidity dry-up. This must be weighed against that impact of the sharp
increase in liquidity demand that resulted from the flight-to-safety and subsequent dash-for-
cash.

6.    On the demand side, evidence on the influence of long-term investors in
corporate bond markets during the COVID-19 stress is mixed, in part because their
behavior varies considerably by jurisdiction, in part due to the nature of their
investment strategies, and in part due to the extraordinary speed of the crisis and
subsequent recovery.

The volume of corporate bonds bought or sold by long-term investors varied across credit types
and maturities and was dependent on the structure of the investor base and jurisdiction.
Limitations in available data on long-term investor activity in corporate bonds means it is
difficult to concretely determine long-term investors’ relative influence on the COVID-19
induced market stresses of March 2020. For the UK and EU markets, anecdotal evidence, as well
as available transaction data, shows that trading activity during the peak of the March stress
was largely unchanged and could suggest that long-term investors were not the main drivers of
liquidity demand. This data, however, may not be entirely representative of the long-term
investor base as it does not capture trading activity from long-term investors that have delegated
their portfolio management to asset managers.

In principle, due to their long-dated liabilities and corresponding investment horizons, long-
term investors face less pressure than other investors to liquidate tradable assets, such as
corporate bonds, during periods of stress. These characteristics of long-dated liabilities also
imply that long-term investors may be able to buy assets being sold by other investors facing
redemption or deleveraging pressures, which can help to limit the magnitude of asset price falls.

                                                 5
However, in practice and in particular events, long-term investors may not always invest
countercyclically for a variety of reasons. For example, long-term investors may have limited
ability to rebalance their asset holdings at short notice. This can mean that to invest
countercyclically during a period of acute stress, long-term investors may have to hold higher
cash balances on average (which could lower return relative to their benchmarks) or use
leverage (which some investment mandates do not permit).
7. Liquidity in open-ended funds (OEFs) during the COVID-19 induced market
stresses of March 2020 showed that some OEFs contributed to selling pressure in some
jurisdictions, driven by investor redemptions mostly related to the flight-to-quality and
the dash-for cash.
In March 2020, many OEFs faced liquidity pressures, dealing with large outflows and
deterioration in market liquidity. While data is not available on the global proportion of
corporate bonds held by OEFs, IOSCO and FSB member jurisdiction estimates for the share of
corporate bonds held by OEFs ranged from 13 to 25%.
In the US, investors withdrew more than $200 billion from US taxable bond OEFs in March
2020. In Europe, corporate high yield (HY) bonds faced cumulative redemptions of 5% of total
net asset value (NAV) within a month. From an ESMA sample, net outflows in Undertakings for
the Collective Investment in Transferable Securities (UCITS) 6 represented 5.9% of NAV, while
alternative investment funds (AIFs) in the sample recorded small inflows from 17 February to 31
March. In UK authorized corporate bond funds, there were net outflows of 2.6% of NAV in
March. In Hong Kong, net outflows from fixed income and/or mixed allocation OEFs ranged
from 4% of investment grade bond OEFs’ assets under management (AUM) to approximately
13% of the HY bond OEFs’ AUM.
8. The distressed asset community played an important role, particularly in longer
duration IG bonds (which is not their typical investment strategy) and other
traditionally safe sectors.
The March turmoil offered opportunities for debt funds which typically focus on “mispriced”
debt (i.e., debt that has dropped in price for “non-economic reasons” as investors feel pressure
to sell due to liquidity concerns when markets are dislocated).
On the other hand, market participants noted that given the brevity of the dislocation in March
due to the rapid central bank intervention, hedge funds struggled to raise capital in time to take
advantage of the pricing changes. It was reported that there was a scramble to launch new
distressed debt and special situations funds. As with long-term investors, distressed buyers
accelerated their bond purchases after the central banks’ interventions and the re-opening of
the primary market.
9. On the supply side, dealers did not contribute to selling pressure in the way they
did during the GFC. However, their behavior had little dampening effect to the extent
6 UCITS - Undertakings for the Collective Investment in Transferable Securities. This refers to funds that are
under the UCIT regulatory framework of the European Commission which creates a harmonized regime
throughout Europe for the management and sale of mutual funds.
6that dealers did not expand their market-making activities to meet increased liquidity
demands during the peak phase of the turmoil and were inclined to reduce pre-trade
transparency to the market.
No single factor can explain dealer behavior in March 2020, but a few factors stand out. The
most important factors cited are large one-sided flows; internal risk appetite and management
of balance sheet limits; and extreme uncertainty that made risk management particularly
difficult. Market structure, prudential requirements, the difficulties in hedging positions and
operational risk considerations are seen as somewhat important in explaining the behavior of
dealers during the COVID-19 induced market stresses of March 2020.
Whilst the main request for quote (RFQ) trading protocol has not changed, the last ten years
has seen a greater shift by dealers in some jurisdictions towards riskless principal client
facilitation model where bonds are bought from clients contingent on an exit strategy involving
a “matched sale”.
Higher capital and liquidity requirements ensured that bank dealers were resilient and could
absorb the shock rather than amplify it through deleveraging, as was the case in the GFC.
Nonetheless, the large increase in the size of corporate bond markets coupled with a decrease
in aggregate (i.e., market-wide) dealer balance sheet capacity post-GFC has affected supply-side
market intermediation under stress. Other factors have also impacted liquidity supply under
stress. In particular, the risk-adjusted return of intermediating corporate bonds is not large in
normal conditions, and it can be quickly wiped out by the additional risk in stressed market
conditions.
Overall, academic research found that dealers did not step up to meet the additional demand
and buy corporate bonds as prices were dropping, and instead some initially reduced their
exposure.
10. The structure of the corporate bond markets also contributed to the constraints
in meeting demand for liquidity during the COVID-19 induced market stresses of March
2020.
Trading in corporate bond markets remains essentially institutional with little direct retail
participation. Although corporate bond ETF market participation and growth is altering these
dynamics, there remains a large buy-and-hold component to investment in these markets, with
minimal trading in specific bonds beyond the first six months after issuance. For example, the
turnover ratio (measured by trading volume divided by outstanding debt) has declined over the
last decade and remains low.
In contrast to the markets for equities and centrally cleared derivatives, corporate bond markets
have seen little standardization. In addition, the number of distinct ISINs has grown
significantly, with some corporates having hundreds of distinct bonds outstanding. Despite
some increased electronification, corporate bond trading remains mostly an OTC dealer-
intermediated market, where intermediation is concentrated in a small number of dealers. All-
to-all trading and portfolio trading have grown but remain a small proportion of total trading
and trading is mostly through RFQ.
7Discussion questions
1. What are your views on the key outcomes drawn from IOSCO’s analysis of the corporate
bond markets? Are there any aspects of the diagnostic analysis and the key outcomes with
which you disagree or that would benefit from more nuance? Are there additional regional
or jurisdictional specific considerations? Please be specific to each observation and indicate
why.
2. Does the report capture and accurately describe the main features of the corporate bond
markets? Is there a particular aspect (or aspects) that may be missing?
3. Are there ways to improve the market functioning and liquidity provision in corporate bond
markets, notably under stressed market conditions? If so, please explain how and the extent
to which this could be addressed at an international level?
4. What further work, if any, should IOSCO consider in the context of corporate bond
markets? 7
7 See previous IOSCO work on corporate bond markets: (1) IOSCO Committee 2 on Secondary Markets (C2)
(2017). “Examining liquidity in corporate bond markets”, (2) IOSCO Committee 2 on Secondary Markets (C2)
(2018) “Regulatory Reporting and Public Transparency in the Secondary Corporate Bond Markets”, and (3)
IOSCO Committee on Emerging Risks (CER) (2019). “Liquidity in corporate bond markets might behave
under conditions of market stress”
8Part A - Background of corporate bond markets globally
This section provides an overview of the state of the corporate bond markets pre-pandemic and
how they have evolved since the GFC. It gives a brief description of the growth of the market,
the relationship between primary and secondary markets, the types of instruments and the way
they are traded.
Overall, the report finds that the corporate bond markets have grown significantly, including
on a cross-border basis over the past decade, with new issuance volumes almost tripling in
certain jurisdictions. Although new participants, such as Principal Trading Firms (PTF), have
entered the market and grown in importance, the corporate bond markets remain dealer
intermediated. At the same time, the relationship between the buy-side and sell-side has
evolved with market participants now placing greater emphasis on competitive pricing.
Primary and secondary corporate bond markets are closely interlinked with trading in
secondary markets closely connected to conditions in primary markets. At the same time,
primary issuance normally only occurs in a stable secondary market environment.
A1 - Corporate bonds are essentially buy and hold instruments
Secondary trading in corporate bonds differs from trading in other asset classes, such as equities.
This is in part driven by the features of the underlying instruments. Bonds are heterogeneous
securities compared to equities, with an interest rate component across different maturities,
structures, and risk profiles. They are also often issued in large numbers of separate non-
fungible bonds by an individual company. The diversity of issuers also impacts the relative
illiquidity of the corporate bonds markets; some bond lines, issuers and sub-sectors are more
liquid than others.
Corporate bonds tend to be traded less frequently than large cap equities or core sovereign
bonds. The turnover ratio, which measures the volume of trading each day compared to the
outstanding amount of corporate bonds is lower than publicly traded equities (between 0.5%
and 1% in the US and less than 0.5% in the UK and Canada).
The largest group of investors in corporate bonds remain long-term investors (i.e., such as
insurers and pension funds) who are predominantly buy and hold investors because of their
long-term liability and liability-matching investment strategies. As a result, volatility and
trading in corporate bond markets is comparatively low which has not attracted short-term
arbitrage-driven or quantitative strategy investors (in contrast to the government bond or
equity markets). Nonetheless, the growth of fixed income ETFs impacted this landscape and
there are some high frequency traders that have entered the markets in some jurisdictions.
A2 - Issuance and market growth over the past decade
The size of the corporate bond markets has grown significantly over the last decade, reflecting
growth in corporate leverage. Various factors have contributed to such growth, including
9relatively benign economic conditions driven by accommodative monetary policies, banking
sector deleveraging, and the increased role of central banks in corporate bond markets in certain
jurisdictions. In the US, the amount of outstanding corporate bonds increased by approximately
80% between 2008 and Q1 2020, to almost US$10 trillion. 8,9 Corporate bonds outstanding in the
euro area rose by one-third over the same period, to US$4 trillion. In the UK, outstanding GBP
Investment Grade (IG) credit has doubled since 2008, from around GBP 300 billion to over GBP
600 billion, and the GBP High Yield (HY) bond market has increased from a very low level prior
to 2012 to around GBP 50 billion in 2020. In Brazil, an acceleration of issuance is observed in
BRL of HY credit, almost tripling over the last 5 years up to 2019 but seeing a 1/3 decline in 2020
due to COVID-19.
Commensurate with the growth in outstanding volumes, the number of issuers and individual
bonds also has expanded considerably.
Figure 1 – Total outstanding corporate bonds
In trillion $
Source: Dealogic, IOSCO calculations
The growth in IG bonds over the past decade is concentrated in BBB-rated bonds, which has
reduced the average credit quality of IG bonds. For example, in the US, in 2000, fewer than 30%
of IG bonds were BBB-rated, compared to 2020, when BBB-rated issuances constituted nearly
45% of IG bonds. Similarly, the share of bonds rated BBB– (the lowest IG rating) increased from
8% to 12% over the same period. 10 This may be due to investors reaching for yield which is
consistent with expectations of a long low interest rate environment. In Europe, this may also
have been driven by central banks purchases with a minimum rating at BBB. By contrast,
8 See SIFMA Chart on Fixed Income Outstanding
9 US and foreign corporate bond US capital market see SEC’s Staff Report, Division of Economic and Risk
Analysis, US Credit Markets Interconnectedness and the Effects of the COVID-19 Economic Shock, available at,
https://www.sec.gov/files/US-Credit-Markets_COVID-19_Report.pdf
10 US and foreign corporate bond US capital market see SEC’s Staff Report, Division of Economic and Risk
Analysis, US Credit Markets Interconnectedness and the Effects of the COVID-19 Economic Shock, available at,
https://www.sec.gov/files/US-Credit-Markets_COVID-19_Report.pdf
10average credit quality in sub-investment grades barely changed over the past decade, partly
because low rated issuers shifted to raising an increasing proportion of their debt in the
leveraged loan market. 11
Figure 2 –Issuances of corporate bonds
European Issuance (EUR Billion) US Issuance (USD Trillion)
UK Issuance (GBP Billion) BR High Yield Issuance (BRL Billion)
Source: Dealogic, IOSCO calculations
A3 - The role of primary markets
Primary markets are more important to the overall market liquidity in bonds than is the case in
equity markets. Equities are perpetual instruments that represent the riskiest end of the capital
structure. By contrast, bonds are usually dated instruments with security or seniority against
default risk. For these reasons, primary bond markets see more frequent issuance and regular
refinancing.
Primary bond markets are a barometer for a healthy market. When active, prime bond
markets signal positive sentiment for the asset class, provide an important component in price
discovery and assessing credit spreads, and provide the buyside with depth on the offer side of
the market. Newly issued (“on-the-run”) bonds are generally more heavily traded. Trading in
secondary markets is closely connected to
conditions in primary markets, particularly when accommodating investors switch into new
11 See FSB report: FSB report assesses vulnerabilities of leveraged loans and CLOs – Financial Stability Board
11issues, rather than purchasing outright. At the same time, primary issuance normally only
occurs in a stable secondary market environment. 12
Discussion questions:
5. Are the features and key characteristics of the corporate bond markets accurately captured
and described? Is there a particular aspect (or aspects) that may be missing?
Part B - Liquidity during the COVID-19 induced stress
In contrast to the 2008 crisis, the COVID-19 induced stress originated outside the financial
system. The March 2020 shock was unprecedented, affecting all aspects of the economy and
across all jurisdictions. It triggered a rapid response by authorities 13 focused on easing monetary
and fiscal policy to support demand and cover lost incomes associated with lockdowns to
contain the spread of COVID-19. Following the announcement of large-scale and coordinated
intervention by authorities and central banks, market confidence and functioning was restored
and, as a result, the most severe market disruption lasted only a few weeks. Consequently, there
remains considerable uncertainty around the potential impact on market liquidity – and
ultimately the real economy – had policy intervention not occurred. Nonetheless, during those
critical few weeks, the effects of the pandemic and the public health measures taken by
governments to contain them 14 led to a widespread need for liquidity and a severe disruption of
the corporate bond markets.
The report focusses on three measures of liquidity which, taken together, give a picture of the
liquidity disruption in the corporate bond markets during the event of March 2020: 1) the level
of bond issuance in the primary markets, 2) the level of secondary trading activity and 3) the
cost/credit spread levels at which bonds were trading. Overall, nearly all jurisdictions
experienced a severe drop in primary issuances, and a spike in credit spreads and bid-ask
spreads. Trading activity was more idiosyncratic, but most jurisdictions witnessed an increased
or sustained level of trading activity.
B1 – Measure of liquidity – level of primary markets issuance
Corporate bond primary market activity was significantly curtailed from February to mid-March
2020, with most markets effectively closed for two weeks in early March. Some corporates were
able to postpone planned issuances to wait for the markets to settle; some corporates drew on
their bank credit facilities to bridge their short-term liquidity needs. There is, however,
insufficient data to assess how many corporates attempted to issue bonds during this period but
were unable to do so given prevailing market conditions.
12 Goldstein et al. (2019) documents the impact of expected secondary market liquidity on the yield spread of
primary market. Goldstein and Hotchkiss (2012) and Brugler et al. (2018) examine the link between
underpricing and post-trade transparency under TRACE.
13 See FSB report: COVID-19 Pandemic: Financial Stability Implications and Policy Measures Taken
14 Including lockdown measures.
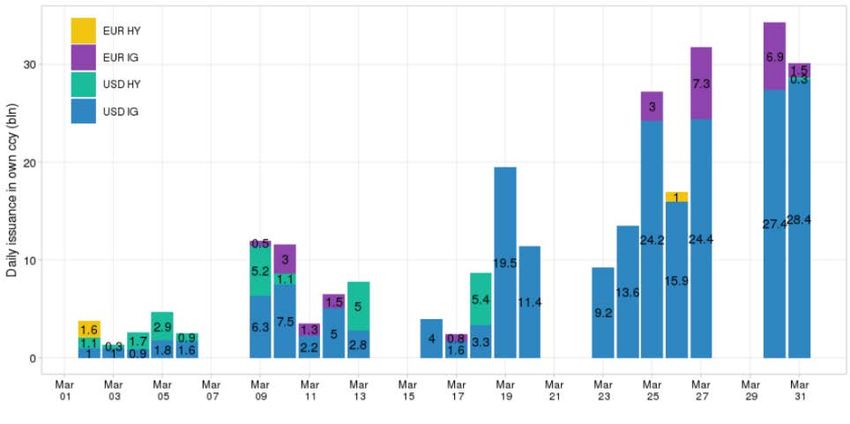
12Figure 3 – Daily issuance of corporate bonds
In USD billion
Source: Dealogic, IOSCO calculation
Primary corporate bond markets play a significant role in the financing of the economy and, as
such, constitute a major monetary policy transmission channel. Their dysfunction triggered
rapid central bank intervention to restore liquidity. As a result, the worst of the crisis was short-
lived, and the functioning of corporate primary and secondary markets was quickly restored
(albeit at a higher risk premium compared to before the crisis). Due to the speed of the
intervention and the short nature of the stress, it is difficult to determine whether the primary
market affected the secondary market or the other way around.
Central bank interventions were key to the levels of primary activity. In the weeks following
central bank intervention, issuance levels for IG bonds reached unprecedented volumes. In the
second quarter of 2020, IG bond issuance in the US totaled a record $693 billion. In its report
on the Impact of COVID-19 on European Capital Markets, 15 AFME noted that “the second
quarter of 2020 was, by far, the highest quarterly value of investment grade bond issuance in
Europe reaching a total of EUR 225 billion”. A similar trend could be observed in the GBP
market.
B2 – Measure of liquidity - level of activity
B2.1 - The level of activity varied across jurisdictions
Increased levels of activity: Secondary trading increased during the middle two weeks of March
(prior to 23rd March Federal Reserve Board (Fed) intervention) in the US and liquidity remained
healthier than in other core markets (e.g., the short-term funding markets) although bid-ask
15 https://www.afme.eu/Publications/Reports/Details/Impact-of-COVID-19-on-European-Capital-Markets-
Market-Update
13spreads increased as well. Similarly, in Brazil, the activity increased considerably in March and
April, particularly for shorter maturity bonds.
Unchanged levels of activity: Data shows that trading activity in Euro denominated bonds was
mostly unchanged, although the overall liquidity in terms of market price impact dropped
substantially. 16 Similarly, the volume, frequency, or scope (days traded) of corporate bond
trading in Canada were impacted little by the March 2020 turmoil. The corporate bond market
in Japan, which consists mostly of IG bonds, observed a relatively small impact on liquidity
during the March turmoil.
Lower level of activity: Market participants however reported that liquidity was particularly
difficult to source in some other markets such as GBP. Finally, even though liquidity for HY
bonds was lower across nearly all jurisdictions, the drop in HY liquidity was most pronounced
outside the US.
B2.2 - The level of activity varied across types of bonds
Liquidity challenges affected some parts of the corporate bond markets more severely than
others. Trading was particularly challenging for large trades and block trades and the normal
relationship between transaction costs and trade size reversed, as trading large parcels became
more costly than trading smaller parcels. 17 Consistent with the “dash for cash” market
participants reported that in most jurisdictions, initially, only short-term and high-quality
bonds could trade. However, some market participants reported that even the market for
shorter-dated bonds thinned out as the crisis deepened and investors tried to sell bonds with
the least price impact. As a result, the credit curve flattened and even inverted, as spreads on
shorter-term bonds increased relative to longer term bonds. With the worsening sell-off, it
became easier to trade longer duration bonds because dealers tended to concentrate scarce
capital further down the maturity curve into bonds where trading might be more profitable.
B2.3 - The level of activity was impacted by the central bank interventions
After the intervention of central banks, markets saw increased frequency, volume, trade size
and breadth of corporate bond trading. US data indicates trading increased, especially for IG
issues larger than USD 250 million, consistent with eligibility for the Fed facilities. Estimates of
transaction costs decreased, with bid-ask spreads dropping immediately for IG. Liquidity in HY
bonds recovered more slowly, reflecting the later added fallen angel provision in the Fed’s
intervention and the potential spill-over from the support for IG markets. The inverted trade-
size pricing of estimated bid-ask spreads also reversed. 18 Similar immediate impacts were
16 See liquidity metrics on: The-European-investment-grade-corporate-bond-secondary-market-and-the-COVID-
19-crisis-280520v2.pdf (icmagroup.org) and Market data and commentary on COVID-19 Information Hub
(icmagroup.org)
17 At the height of the crisis, transaction costs on large block trades exceeded those of smaller trades, reversing
the normal trend where market participants can negotiate better prices on block orders.
18 It reverted to the normal trend where it is easier to negotiate better pricing on large block trades than on smaller
one.
14observed in other jurisdictions, reflecting both local central bank interventions and the ripple
effect being felt from the US market.
Academic research and market participants noted that the impact on liquidity was felt
immediately after the Fed announcement and before any purchases under the Secondary
Market Corporate Credit Facility (SMCCF). 19, 20 The improvement in liquidity following the
announcement of the SMCCF has been attributed to a mix of factors, including reduced selling
pressures, increased capacity and willingness of dealers to supply liquidity and a reduction in
expected credit losses (for example, Haddad, Moreira, and Muir, 2020; Nozawa and Qiu, 2021;
and D'Amico et al, 2020). These outcomes reflect the importance of the Fed signaling its
intention to provide a liquidity backstop to the corporate bond market.
B3 - Measure of liquidity - price/transactions costs
During the two weeks leading to the announcement of Fed interventions on 17 and 23 March
2020, transaction costs soared as measured by bid-ask spreads. The cost of trading short
maturity HY bonds increased substantially, as did the cost of trading longer dated IG bonds.
There was a smaller increase in absolute terms in the cost of trading shorter IG bonds, however
in yield terms (i.e., relative to the price of a short-dated bond), this increase was material given
the lower convexity of this sector.
In addition, the relationship between estimated trade-size pricing and bid-ask spread inverted.
Spreads of large blocks (>=25M) became higher than for smaller trades of 1-5M and 5-25M.
Feldhutter's measure 21 of spread may not be well suited for block trades as it requires buy and
sell of matching size, a significant limit for large trades. Yet O'Hara et al (2020) observes the
same evidence using an alternative measure.
Evidence from research shows that the dislocation in IG bonds across all maturities was worse
overall than in HY bonds. 22 The CDS-bond basis spread for IG bonds widened more than for HY
bonds during the period (Ma, Xiao, Zeng, 2020) and the increase in credit spreads was
significantly greater than the increase in CDS for the same IG corporate (Haddad, Moreira and
19 Sharpe, Steven A., and Alex X. Zhou (2020). "The Corporate Bond Market Crises and the Government
Response," FEDS Notes. Washington: Board of Governors of the Federal Reserve System, October 07, 2020,
https://doi.org/10.17016/2380-7172.2769
20 https://www.federalreserve.gov/monetarypolicy/smccf.htm
21 We use Feldhutter’s (2012)21 method to compute roundtrip transaction costs based on trade prices
(transaction level data). Since bonds are often traded with multiple trades taking place in a short time frame
with identical trade volumes, it is reasonable to assume that dealers are undertaking what he calls imputed
roundtrip trades (IRT) to coordinate buys and sells of investors. We aggregate all trades per bond with the
same volumes that occur within a time window to an IRT. We then compute the absolute effective spread
estimator as the doubled difference between the lowest and highest trade prices for each IRT. To get a relative
spread proxy, we divide the roundtrip transaction costs by the mean of the maximum and minimum prices.
22 A probable explanation pattern is that as bond investors sold the most liquid bonds first, putting large
downward pressure on prices and driving up yields.
15Muir,2020). As noted above, the dislocation in core government bond markets, swap rates and
cross-currency markets all played a significant role in the volatility of corporate bond prices.
Discussion questions:
6. Does the report accurately describe the state of liquidity in corporate bond markets during
the COVID-19 induced market stress across the three stated measures employed in the
report?
Part C - The drivers of liquidity - supply, demand, and market
participant behaviors.
Market participants’ behavior played a significant role during the weeks before central bank
intervention, either in exacerbating or failing to stabilize market liquidity. However, it is
difficult to assess whether corporate bond market liquidity primarily dried-up because of
reduced liquidity supply by dealers, increased liquidity demand by investors, or a combination
of both – and what was the greater relative contributor to the stresses. Limitation in dealers’
ability to absorb the significant marginal selling pressures (i.e., the increased demand for
liquidity) due to risk management limits and balance sheet constraints may be one of the causes
for the liquidity dry up, particularly given the central role of bank-dealers in the corporate bond
markets. However, this must be weighed against the impact of the sharp increase in liquidity
demand that resulted from the dash-for-cash. Research shows that the COVID-19 liquidity dry-
up in corporate bond markets can be attributed equally to both the supply and the demand
functions, although the research also points to changes in supply that had a much bigger impact
on risk premiums than changes in demand. 23
C1 - The demand for liquidity
While bond investments through open-ended mutual funds and ETFs have grown, a large
proportion of fixed income assets are held by other types of long-term investors such as pension
fund managers and insurers. For example, in the US, it is estimated that insurance companies,
registered investment companies (e.g., open ended funds (OEFs) and exchange traded funds
(ETFs)) and pension funds owned 31%, 19%, and 9% of outstanding bonds, respectively. 24
This section analyses the behavior of the long-term investors, asset managers, and distressed
funds.
C1.1 - The role of long-term investors
The main types of long-term investors considered in this chapter are insurance companies and
pension funds. In conducting its research, the working group noted that it was challenging to
23 Chikis, C., & Goldberg, J. (2021). “Dealer Inventory Constraints in the Corporate Bond Market during the
COVID Crisis (FEDS Notes). Board of Governors of the Federal Reserve System”.
24 US and foreign corporate bond US capital market see SEC’s Staff Report, Division of Economic and Risk
Analysis, US Credit Markets Interconnectedness and the Effects of the COVID-19 Economic Shock, available at,
https://www.sec.gov/files/US-Credit-Markets_COVID-19_Report.pdf
16obtain granular data on the trading activity of long-term investors across jurisdictions. Publicly
available reporting data is scarce. In addition, insurers and pensions funds delegate vast amount
of their investments to asset managers making it difficult for market regulators to build a
comprehensive picture of the behavior of some types of market participants in the corporate
bond market.
Long-term investors have grown considerably in recent decades and are large investors in many
asset classes, including corporate bonds. Assets of insurance companies worldwide exceeded
USD 36 trillion at the end of 2019, 25 whilst retirement savings in pension funds, pension
insurance contracts and in other vehicles exceeded USD 50 trillion worldwide (USD 49.2 trillion
in the OECD). In advanced economies, long-term investors’ total financial assets have grown
more quickly than GDP since the early 2000s, owing to a mix of factors including rising wealth,
increasing asset valuations in the low interest rate environment, and the accumulation of wealth
by ageing populations (Figure 4).
Figure 4 – Long-term investors total financial assets
As % of GDP
Long-term Investors - Total Financial Assets
Advanced economies; per cent of GDP
85
Insurance companies
80
Pension funds
75
70
65
60
55
50
45
2002 2004 2006 2008 2010 2012 2014 2016 2018
Source: Financial Stability Board
Long-term investors allocate on average a third of their balance sheet to corporate bonds,
making it the largest asset class they invest in aside from government bonds. For example,
government and corporate bonds make up around two-thirds of European Economic Area
(EEA) insurance companies’ total investment portfolio ahead of equities (listed and unlisted).
The investment allocation of EEA Institutions for Occupational Retirement Provisions (IORPs),
in the end of 2019, consisted of equity for 33% and for bonds for 50%. 26, 27
Long-term investors have liabilities that are often medium or long-term in nature. This means
that, while individual investor portfolios differ significantly, the asset allocation of a typical
25 Source: Statista for insurance companies and OECD report Pension markets in focus 2020
26 Investment allocation is highly divergent amongst Member states with some IORP allocating up to nearly 60%
of equity whiles other have up to 70% in bonds.
27 Source: EIOPA Financial Stability report July 2020.
17long-term investor is heavily weighted towards high quality fixed-income securities with longer
maturities to match their assets with future liabilities and projected pay-outs. 28
Partly due to tax reasons, insurance companies tend to be buy-and-hold investors and would
not be expected to make significant portfolio sales of corporate bonds in response to rapidly
changing market conditions. 29
However, insurance companies are sensitive to credit rating changes and, particularly to fallen
angels. This is because their capital requirement increases non-linearly depending on the rating
change. For example, research shows that under the EU solvency II rules, the downgrade of a
five-year duration security from AA to A increases the solvency capital requirement by an extra
1.5%, whilst it jumps by 10% in the case of a downgrade from BBB to BB. 30 In the US, risk-based
capital standards set by the National Association of Insurance Commissioners (NAIC) feature
similar non-linearity, though the actual requirements vary by type of insurance. For example,
for life insurance companies, NAIC standards call for a 0.40% asset valuation reserve (AVR) for
bonds in the A/AA/AAA range, 1.30% for bonds in the BBB range, and 4.60% for bonds in the
BB range. For property and casualty and health insurance, the capital requirements are 0.30%,
1.00%, and 2.00%. 31
In principle due to their long-dated liabilities and corresponding investment horizons, long-
term investors face less pressure than other investors to liquidate liquid assets, such as corporate
bonds, during periods of stress. These characteristics of long-dated liabilities also imply that
long-term investors may be able to buy assets being sold by other investors facing redemption
or deleveraging pressures, which can help to limit the magnitude of asset price falls. Periodic
portfolio rebalancing to benchmark weights can also contribute to long-term investors investing
countercyclically.
However, in practice and in particular events, long-term investors may not always invest
countercyclically for a variety of reasons. For example, long-term investors may have limited
ability to rebalance their asset holdings at short notice. This can mean that to invest
countercyclically during a period of acute stress, long-term investors may have to hold higher
28 For example, in the EU, in the pre-CovidCOVID-19 period, insurers tended to buy mostly A and BBB rated bonds
(respectively 28 and 23% of the total purchases) almost half of the bonds have a maturity longer than 7 years.
29 As an example, analysis in the EU by EIPOA shows that “in normal times, in each quarter, approximately 4% of
the corporate bonds held by European insurers are sold, meaning that EEA insurers’ bond portfolio do turn
over in approximately 6 years”.
30 Vulnerabilities and resilience in insurance investing: studying the COVID-19 pandemic by Patrick M Liedke
31 For NAIC risk-based capital requirements, see
https://www.naic.org/documents/committees_e_capad_investment_rbc_wg_related_irbc_factors.pdf.
For a mapping of the NAIC credit rating scale to credit rating agency scales, see
https://content.naic.org/sites/default/files/inline-
files/Master%20NAIC%20Designation%20and%20Category%20grid%20-
%202020.pdf.https://content.naic.org/sites/default/files/inline-
files/Master%20NAIC%20Designation%20and%20Category%20grid%20-%202020.pdf.
18cash balances on average (which could impact their benchmarking) or use leverage (which some
investment mandates do not permit).
Accounting rules, and binding regulations or internal risk limits, can also incentivize long-term
investors to invest procyclically. For example, marking-to-market assets and valuing liabilities
using prevailing interest rates can incentivize long-term investors to sell riskier assets (such as
corporate bonds) and long-dated sovereign bonds to contain duration mismatches between
assets and liabilities. Further, long-term investors’ buying of long-dated sovereign bonds can
extend declines in interest rates, which can in turn lower solvency ratios if the present value of
long-dated liabilities increases more quickly than the present value of long-term investors’ long-
dated assets (Domanski and Shin, 2017). Long-term investors operating close to their regulatory
capital requirements or internal risk limits can also be more inclined to sell downgraded assets
to de-risk their portfolios (Merrill et al, 2012; Chodorow-Reich, Ghent, and Haddad, 2021).
Insurers also use derivatives to hedge risks from investment portfolios and underwriting.
According to European Insurance and Occupational Pensions Authority (EIOPA), interest rate
swaps (IRS) are the largest derivative type held by EEA insurers and make up 50% of the notional
of derivatives (as of 2019 Q4). In a period of increased volatility in interest rates, insurers could
face liquidity shortfalls due to margin calls on their IRS derivatives portfolios (Hall, 2021). The
need to extend the duration of assets in periods of low yields and negative duration may explain
the increase in use of IRS by insurers. However, as a result, EEA insurers are more exposed to
interest rates going up. 32
Long-term investors behavior in corporate bond markets during and since the March
2020 turmoil
Long-term investors were particularly exposed to the March turmoil in terms of solvency risk,
profitability risk and reinvestment risk. On the one hand, insurers and pension funds are
affected by the decrease in the value of their investments because of the sudden increase in risk
premia, and the increase of default risk which could trigger large-scale rating downgrades
affecting capital requirements. On the other hand, the risk of low interest rates and the
weakening macro economy could challenge the profitability of new business 33.
Available evidence on the influence of long-term investors in corporate bond markets during
the COVID-19 induced markets stress is mixed, in part because their behavior varies
considerably by jurisdiction, in part due to the nature of their investment strategies and to the
extraordinary speed and short duration of the crisis. The volume of corporate bonds bought or
sold by long-term investors varied across credit types, maturities, and was dependent on the
structure of the investor base and its jurisdiction. Limitations in available data means it is
32
EIOPA Financial Stability Report 2021 - https://www.eiopa.europa.eu/document-library/financial-stability-
report/financial-stability-report-july-2021_en
33 Quote the IOPA report
19You can also read