Construction work cost and duration analysis with the use of agent-based modelling and simulation
←
→
Page content transcription
If your browser does not render page correctly, please read the page content below
Open Engineering 2021; 11: 830–844
Regular Article
Grzegorz Śladowski* and Bartłomiej Sroka
Construction work cost and duration analysis
with the use of agent-based modelling and
simulation
https://doi.org/10.1515/eng-2021-0081
received October 31, 2020; accepted May 19, 2021
1 Introduction
Abstract: Assuming a systemic approach, a construction Construction projects are complex processes performed
project can be treated as a complex system composed of within dynamic environments. Recording and analysing
many different interlinked elements such as construction this complexity require system-based thinking wherein
works, human agents, equipment, materials and the construction projects are conceptualised as a set of ele-
knowledge needed to perform the said work. The sys- ments (construction works, persons, equipment, materials
tem’s structure can be divided into many mutually con- and knowledge) that remain in specific relationships. In
nected precision levels. This multilevel decomposition of a system-based approach, the complexity of a construc-
the system facilitates a bottom-up approach in assessing tion project is first described as its detail complexity,
the performance of a planned project, while starting the which is time-independent and arises from the system’s
analysis at its lowest aggregation levels. The basic level structure (the type and number of its elements and the
distinguishes three typical units and their attributes: per- amount of connections between them). Apart from detail
sons, knowledge and construction resources. Unit attri- complexity, a project is also characterised by dynamic
butes and their dynamic interactions under changing complexity, which evolves over time and is the effect
environmental conditions affect the properties and per- of the system’s operational behaviours, whose cause-
formance of a given construction work and, as a conse- and-effect character can be non-linear or even unpredict-
quence, the properties and performance of the project.
able [1,2]. One specific property of complex systems (and
The objective of this article is to analyse the attributes
construction projects as well) is the fact that changes in
and micro-behaviours of units through bottom-up project
some elements can cause unforeseen changes in others,
assessment, allowing the estimation of its parameters
while feedback between these elements contributes to
such as completion time and cost. We utilised multiagent
the system’s evolution over time [3]. The system’s beha-
modelling that allows for performing micro-simulations
viour and its interaction with the environment lead to
in complex systems with adaptive components. The ana-
emergent properties, such as susceptibility to threats, its
lysis was backed by a case study of road renovation work
adaptive capacity to changing conditions and, as a con-
performed under specific conditions on the grounds of a
sequence, the system’s resilience [4]. We can find many
listed heritage site.
system performance assessment tools in the literature
Keywords: system of systems, meta-network, multiagent that are used on projects similar to construction projects
system, planning a construction project (expressed via, for instance, their completion time and
cost), but most of them are based on a top-down
approach [5]. This approach does not allow us to detect
autonomous micro-behaviours of elements within the
* Corresponding author: Grzegorz Śladowski, Cracow University of system – their interdependent, non-linear and dynamic
Technology, Faculty of Civil Engineering, Department of relationships that change over time – and, as a result,
Management in Civil Engineering, 24 Warszawska Street, the project’s performance [3,6]. Recently, a concept of
31-155 Cracow, Poland, e-mail: grzegorz.sladowski@pk.edu.pl
an integrated approach to bottom-up construction pro-
Bartłomiej Sroka: Cracow University of Technology, Faculty of Civil
Engineering, Department of Management in Civil Engineering,
ject performance assessment has appeared – based on
24 Warszawska Street, 31-155 Cracow, Poland, systems of systems (SoS) [7]. The system’s abstraction at
e-mail: bartlomiej.sroka@pk.edu.pl the basic level and its multilevel aggregation form the
Open Access. © 2021 Grzegorz Śladowski and Bartłomiej Sroka, published by De Gruyter. This work is licensed under the Creative Commons
Attribution 4.0 International License.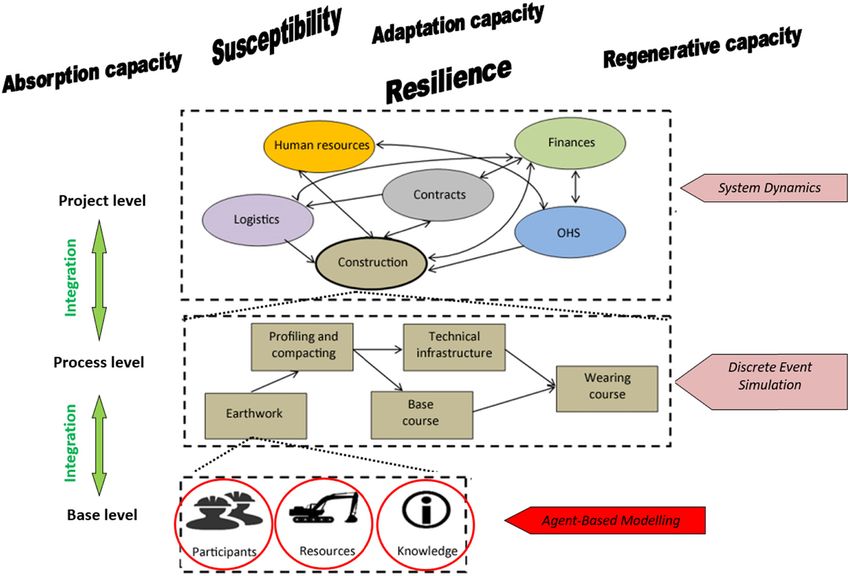
Construction work cost and duration analysis with the use of ABMS 831
framework for the effective assessment of construction impact on its evolution [10]. This top-down approach does
project performance assessment. One of the tools used not allow us to explore the dynamic micro-behaviours of the
to study the micro-behaviours of a system’s elements system’s various elements (e.g. people and other resources)
and their dynamic interactions, which lead to assessing at lower abstraction levels (e.g. at the level of a single con-
its performance, is agent-based modelling and simula- struction work) – behaviours that directly affect the project’s
tion (ABMS). During the construction of a multiagent outcome [11]. In recent years, we have been able to observe
model, one identifies active heterogeneous agents with the development of a new concept of project management
preset attributes. Afterwards, they are placed in a specific named PM 2.0, whose objective is to provide new tools and
environment, defining mutual relations and the rules of methods for effectively assessing the performance of com-
their behaviour. Via simulation, dynamic, repeating and plex projects. As a part of this concept, Zhu and Mostafavi
often competitive agent interactions and their individual (2014) [7] noted the fact that construction projects demon-
behaviours and adaptation to changing environmental strate the properties of SoS and should be conceptualised
conditions define the behaviour and evolution of the and analysed as such. The dynamic of these complex sys-
entire system [8,9]. We can find few examples of ABM tems and the interdependence between them lead to a situa-
used to simulate user micro-behaviours during construc- tion in which changes in one subsystem result in unexpected
tion work in the literature. We reviewed these concepts changes in the remaining subsystems and the feedback
and isolated their key limitations. First, we found that between them causes these projects to evolve over time.
these agent micro-behaviour analyses were confined only We can also find several characteristics of SoS in the litera-
to a single type of construction work. Second, the number ture. Scholars like Maier (1998) [12] or Lewis et al. (2008) [13]
of agents who cooperated and made decisions during this stressed the operational independence of each subsystem,
work was very limited. Third, these analyses did not their decision-making autonomy, spatial distribution, dyna-
account for the effects of agents learning and forgetting mism and their evolutionary character. Pryke et al. [14] also
information, nor did they account for impacts caused by noted the fact that, apart from technical, co-dependent rela-
adverse events (atmospheric conditions, equipment fail- tions within construction projects, social relationships were
ures, archaeological discoveries, etc.) which can also affect likewise significant. These relationships arise from interper-
project efficiency. The objective of our article is to enhance sonal interactions, including the exchange of information,
ABM usage potential via the elimination of these limita- which considerably highlight the dynamic of complex sys-
tions, which can allow for more precise modelling and tems. Emergent properties (e.g. susceptibility to threats, the
capacity to adapt to changing conditions and resilience) are
bottom-up analysis of construction projects as systems,
an important characteristic of SoS. These properties were
which they undoubtedly are.
defined by Johanson (2006) [15] and are the result of the
The first part of the article will describe the approach
dynamic behaviours of subsystems and their mutual inter-
of the SoS and provide an overview of the general assump-
dependence, constituting a trait of the entire system.
tions of ABM micro-simulation. The argument will be
Figure 1 presents the conceptual structure of the SoS
backed by an example of assessing the performance of
concept, which can be used to develop tools and techni-
construction work carried out during the renovation of
ques of assessment of complex construction projects.
the structural layers of road surfaces present on the
The structure of relationships between elements (orga-
grounds of a listed heritage site.
nisations, tasks and resources) of the sample SoS that can be
used to describe a construction project requires selecting
proper analysis methods. This selection depends on the
2 SoS chosen system aggregation level. To analyse an SoS
at the project level, we can use the so-called system
In the traditional approach to assessing construction pro- dynamics method. At the process level, discrete event
jects, their performance analysis is typically reactive and simulation was found to be effective. One of the tools
disintegrated. The top-down character of this analysis used to perform bottom-up assessments of complex con-
ends at the level of relations between construction pro- struction projects is the ABMS approach. ABMS allows
jects at most [5]. In this approach to planning construc- us to analyse micro-behaviours and micro-interactions
tion projects, there is a general belief that a centrally between system elements (e.g. people, information and
controlled performance of the project should be con- other resources) allowing us to understand their dynamic
cordant with its plan and the interactions of entities and, via multilevel aggregation, impacting the properties
and construction resources will not have any significant and performance of the entire project.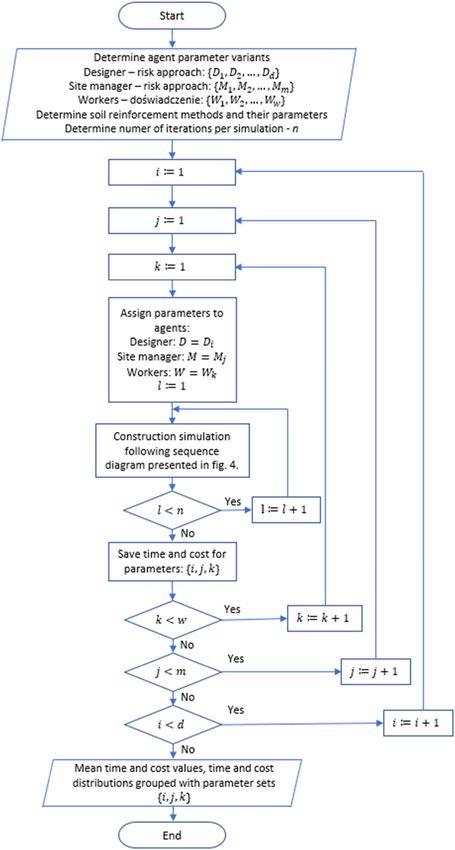
832 Grzegorz Śladowski and Bartłomiej Sroka
Figure 1: Conceptual representation of an SoS used for analysing construction project efficiency. Source: original work based on refs [16,17].
For the purposes of an effective bottom-up perfor- environment that enables their interaction. The primary
mance assessment within an SoS, we must consider two objective of ABMS is to track the interactions of hetero-
types of abstraction of the construction project under geneous agents in their artificial environment and under-
analysis [16,18]: stand the processes that display global patterns [21]. In
• Basic-level abstraction is associated with perceiving the literature, we can find many definitions of agents and
construction projects through the prism of separate their environment, e.g.:
elements like people, information and resources, whose Macal and North (2009) [20] defined the agent as
attributes and interactions with the external and internal an active component capable of independent decisions.
environment affect the dynamic properties and ultimately Epstein and Axtell (1996) [21] defined agents as people
the performance of these projects. within agent-based modules, who possess their own
• Multi-level aggregation determines effectiveness at higher traits and behaviour rules. Meanwhile, Nwana (1996)
levels on performance at lower levels. [22] defined agents within three basic behavioural attri-
bute categories, with each agent possessing at least two
In light of the above, the assessment of the perfor- (Figure 2).
mance of construction projects conceptualised as SoS Autonomy means that the heterogeneous agents pos-
requires the adoption of a bottom-up approach for their sess individual internal states and goals and strive to
analysis. achieve them. Cooperation with other agents towards
achieving specific goals is critical. For agents to be able
to cooperate, they must possess the social capacity for
interaction. Learning is a key trait of every intelligent
3 Theoretical basis for ABMS being and is based on gaining empirical knowledge and
using it to modify one’s behaviour to better adapt to the
The concept of ABMS is a relatively new approach to environment.
assessing the behaviour of complex systems [19]. In ref. The second critical element of ABMS is the environ-
[20], the authors defined ABMS as a set of agents and an ment. Weyns et al. (2007) [23] defined the environment as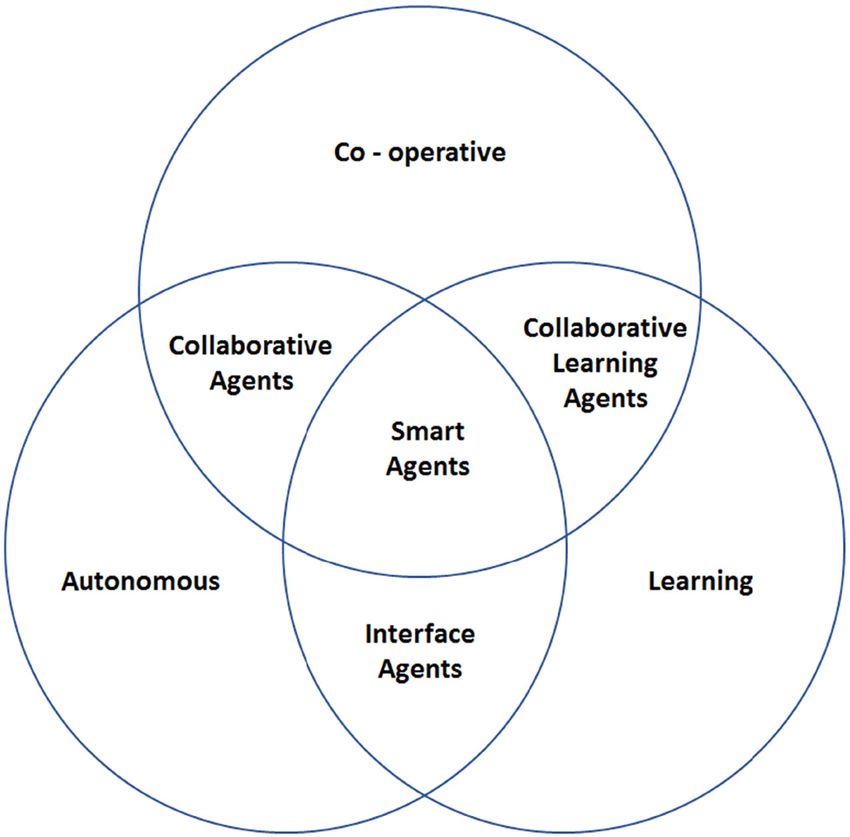
Construction work cost and duration analysis with the use of ABMS 833
in solving problems affecting the achievement of the
intended goal [26].
In the construction sector, multiagent models have
thus far been used in: managing delivery chains [27,28],
analysing procurement procedure strategies [29], analys-
ing construction personnel behaviours [30,31], assessing
construction site safety [32–34] and analysing mechan-
ised excavation work [35,36].
The latest application of a multiagent approach con-
cerned an SoS-based bottom-up analysis used to assess
the performance (duration and cost) of a project which
was applied to a case study of tunnelling utilising the
New Austrian Tunnelling Method [16]. The article explored
the attributes of agents and other system elements, analysed
various project variant and assessed their performance. The
objective of this article is to further develop this multiagent
approach following the SoS concept via introducing a greater
project complexity in terms of analysed construction work,
introducing a greater number of agents that act while coop-
Figure 2: Three fundamental behavioural attribute categories. Each
erating and accounting for the effects of construction-task-
agent must possess at least two. Source: original work based on
ref. [22]. performing agents learning and forgetting, in addition to
including the impact of risk factors (weather conditions,
equipment failures, archaeological studies, etc.) on the
project.
the conditions that surround agents and allow them to
function, providing them with the ability to interact and
use available resources. Bandini et al. (2009) [24] define
the fundamental aspects of the model that are defined by 4 Agent-based approach to analyse
the environment:
• comprehensive modelling of the physical and social pla- the performance of a sample
cement of the system; project
• enabling agents to gather information about their environ-
ment and performing actions based on this information;
• creating conditions for agents to interact with non- 4.1 Agent-based model assumptions and
agent system elements; structure
• Defining and modelling dynamic changes that occur in
non-agent system elements; The example of road surface renovation work under ana-
• Enforcing adherence to the rules defined in the system. lysis is based on an analogy to the project of the restora-
tion of the outer courtyard and its access roads located at
Every heterogeneous agent individually assesses their the Royal Castle on Wawel Hill in Krakow, Poland, which
situation and makes autonomous decisions based on a was carried out in 2012. The renovation work is associated
specific set of rules [25]. However, the capacity of an with replacing the surface of the existing square located
individual agent to act is limited by their knowledge, in an area that is a listed heritage site. The assumed
the availability of resources, computation capacity and square surface is 10,000 m2. The specificity and character
the perspective of the objective. If the analysed system is of the renovation work is as follows: the work begins on
particularly complex in terms of structure and dynamics, the first work plot, with a given surface, where workers,
which is distinct for construction projects, one proven applying appropriate equipment, dismantle the existing
way to address this is to create conditions for the coop- surface via stripping the existing wearing course with the
eration of specific and modular components (agents) that intent to maximise the recovery of stone tiles, followed by
specialise in a given field. The synergetic effect obtained the dismantlement of the base (Figure 3a), the profiling
this way will allow the system to behave effectively and strengthening/stabilisation of the subbase (Figure 3b)834 Grzegorz Śladowski and Bartłomiej Sroka
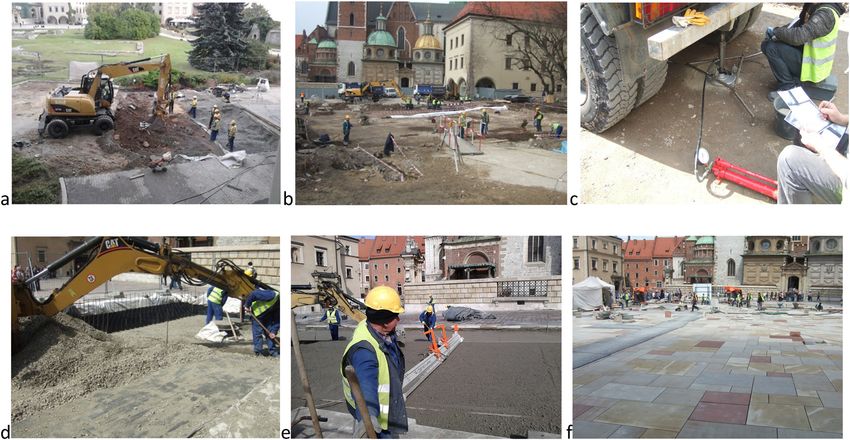
Figure 3: Renovation of the surface of the outer courtyard of Wawel Castle: (a) dismantling of existing surface, (b) soil strengthening and
profiling, (c) soil strength verification, (d) application of various variants of soil strengthening, (e) laying the base course and (f) laying the
stone surface layer. Source: photo Grzegorz Śladowski.
Table 1: Probability of soil strengthening variant’s effectiveness depending on soil type (empirical data – an analogy to the project of the
restoration of the outer courtyard and its access routes at the Royal Castle at Wawel Hill)
Soil type Variant 1 Variant 2 Variant 3
Improved subbase from Reinforcement with geogrid with a Cellular geogrid with a height of
mechanically stabilised tensile strength of 150 kN/m + 2 m × 0.2 m filled with
crushed aggregate 0/31.5 mechanically stabilised crushed mechanically stabilised crushed
aggregate 0/31.5 in two 0.2 m layers aggregate 0/31.5
Good (secondary 0.5 1 1
modulus above 70 MPa)
Average (secondary 0.25 0.75 1
modulus above 35 MPa
but below 70 MPa)
Poor (secondary 0 0.25 1
modulus up to 35 MPa)
*Post-stabilisation soil strength requirements (secondary modulus = 120 MPa) for KR3 per PN-S-02205:1998.
and an assessment of the soil strength (Figure 3c). Initial workers on the first plot apply the selected soil strengthen-
studies performed during the design phase reported that ing method and verify it. When the desired soil strength
the probability of encountering good soil strength was 0.1, parameters are not detected, the site manager makes the
average strength had a probability rate of 0.3 and poor decision to perform repairs. If the repairs do not produce
strength had a probability rate of 0.6, as the area largely expected results, the site manager informs the designer
features soil of anthropogenic origin. Based on the soil of the need to change the soil strengthening method to a
strength studies, the designer selects the strengthening better alternative, which is associated with the additional
method (which varies in terms of cost and performance costs of replacing the previous soil strengthening solutions.
time) (Figure 3d) based on empirical data (Table 1) and a The site manager (depending on how the situation develops
specific approach to risk (Table 2) [16]. Afterwards, the and on their degree of risk aversion), upon finishing theConstruction work cost and duration analysis with the use of ABMS 835
Table 2: Three approaches towards risk were analysed for the The model also accounts for the ability of the workers
designer who performs the selection of the soil strengthening who perform the tasks on successive work plots to learn
variant based on the empirical data depending on soil strength and forget skills. Learning and forgetting is the object of
analysis, original work based on ref. [16]
many types of work in construction. The learning and
forgetting mechanism was applied in the study of the
Soil type Designer choice
construction of underwater caissons [39], applying roof
Risk approach (conservative/normal/risk-taker) insulation [40] or finishing work on a multistorey resi-
Variant 1 Variant 2 Variant 3 dential building [41].
The proposed approach utilised the learning and for-
Poor 0/0/0.1 0/0/0.3 1/1/0.6
Average 0/0/0.4 0.6/1/0.6 0.4/0/0
getting mechanism introduced by Nembhard and Uzumeri
Good 0.6/1/1 0.3/0/0 0.1/0/0 (2000) [42], which can be used to determine worker
effectiveness.
In order to do so, one needs to employ the following
proper soil strengthening task, makes the decision con- formulas:
cerning the area size of the next plot (Table 3). After com-
xR α + p ⎞
pleting soil strengthening tasks for the entire square, yx = k ⎛⎜ α x ⎟,
the workers begin to construct the base course from lean ⎝ xRx + p + r ⎠
concrete (Figure 3e) and then proceed to lay the wear- ∑ix= 1(ti − t0)
ing course from previously recovered stone materials Rx = ,
x (tx − t0)
(Figure 3f). The information about the workload and the
cost of performing each task, including those associated where k is the asymptotic value limit of y, x is the amount
with technological variants of soil strengthening, were esti- of accumulated work done, p is the previous experience
mated as average values that occur under normal construc- in the same unit as x , r is the amount of work required to
tion conditions. achieve a performance value of k , α is the forgetting coef-
2
We used the UML standard to describe agent inter- ficient and Rx is the relation of time that has passed since
relationships and actions. The specificity of construction the first unit t0 to the time that has passed since the last
projects assumes a discrete time (date) when an agent unit produced x .
makes a decision or takes an action. This decision/action The parameters were set so that worker performance
is based on a ruleset that depends on experience col- could vary between 70 and 130%: k = 260, r = 225 and
lected during previous projects, risk approach and the α = 0.3. The value of parameter p depends on the worker
current situation at the construction site. In addition, experience based on which the following was assumed:
agents do not have their own goals and are not equipped p = 260 (70% performance), averagely qualified workers
with the function of assessing their own actions. Despite p = 780 (100% performance) and highly qualified workers
agents being autonomous, they are heavily restricted p = 26,000 (130% performance).
by the specificity of construction. Therefore, we found A performance of 130% meant that the average cost
presenting the model in a UML standard justified (as and duration of a task was lowered by 30%. Thereby,
yx
opposed to using an agent-based standard). yx _ laf = 2 − 200 , klaf = yx _ laf ⋅ k and tlaf = yx _ laf ⋅ t , where
Figures 4 and 5 present two types of diagrams: a class klaf and tlaf denote the time and duration of a task after
diagram and a sequence diagram of the agent-based accounting for the curve of learning and forgetting, while
model as per the OMG UML standard [37,38]. yx _ laf denotes the performance coefficient. Workers learn
Table 3: Three types of risk approach displayed by the site manager depending on the successful strengthening of the soil; the site
manager’s decision can result in: increasing, decreasing or maintaining the previous area of the subsequent work plot
Risk approach Successfully reaching the required soil strength after stabilisation
The first time The second time (after The stabilisation had to be dismantled and a more effective variant had
repairs) to be used
Conservative Increase Increase Decrease
Normal Increase Maintain Decrease
Risk-taker Increase Increase Decrease836 Grzegorz Śladowski and Bartłomiej Sroka
Figure 4: Class diagram of the agent-based model in question.
and forget every task performed according to a given tech- validation, extreme condition testing and the tracking
nology independently. technique, which confirmed its validity [16].
It should also be noted that the project is exposed to
various random adverse effects that can negatively affect
its performance. Based on the specificity of the project, 4.2 Agent-based model analysis
we limited ourselves to accounting for four typical risk
factors in the model. Based on an analogy to the pre- A block diagram of the simulation algorithm featured in our
viously mentioned project at Wawel Castle, we assumed method has been presented in Figure 6. For the method to
that these factors materialised with an estimated prob- function correctly, the following starting data must be available:
ability of 0.5 in the case of archaeological discoveries, • the various risk approaches displayed by the designer
0.3 in the case of the occurrence of adverse atmospheric (expressed in percentages of reinforcement choices
conditions, 0.05 in the case of construction equipment depending on base type),
failure and 0.1 in the case of construction material • the various risk approaches displayed by the site man-
delivery delays. It was also assumed that the materialisa- ager (expressed in the manner of site size choice by the
tion of any of these risk factors under specific project site manager, depending on success or failure in applying
conditions will result in extending its duration by 1 reinforcement at the previous site),
working day each time. In the case of archaeological dis- • various types of crew experience (expressed via learning
coveries, this assumption can be justified if it occurs in curve parameters – described in detail further in the
the form of an intervention (under mandatory conserva- article),
tion guidelines, taking the form of securing any relics • soil reinforcement methods and their parameters, expressed
without further study). as a method effectiveness percentage depending on soil
The presented model was implemented in the Python category.
programming language using the Mesa library, which is
used to model agent-based systems. We can share the The user should also determine n, the number of
program if needed. The model was subjected to internal simulations. For each parameter set (for the designer,Construction work cost and duration analysis with the use of ABMS 837
Figure 5: Sequence diagram of the agent-based model in question.
site manager and workers), n simulations shall be per- amounted to a total of 8,100 simulations. Tables 4–7 pre-
formed. Every simulation follows the sequence diagram sent the results that were obtained. Each table shows the
presented in Figure 5. Simulation time and cost shall be result divided by designer and site manager risk aversions
aggregated for the given agent parameters. The output and worker experience (divided by semicolons). Table 4
shall be the mean construction time and cost for each presents the average cost of completing the project (in thou-
agent parameter set. sands of euros). Table 5 presents the standard deviation of
cost (in thousands of euros). Table 6 presents the average
project completion time and Table 7 presents the standard
4.3 Results deviation for project completion time.
Figures 7 and 8 present selected probability distribu-
Three hundred simulations for each of the 27 different tions and the distribution function for project completion
parameter sets (three types of designer risk aversion, cost and duration assuming the following agent attributes:
three types of site manager risk aversion and three types designer with normal risk aversion, site manager with
of worker experience) were performed for the project, which normal risk aversion and averagely qualified workers.838 Grzegorz Śladowski and Bartłomiej Sroka
Figure 6: Block diagram of the simulation algorithm used to analyse the model.
Figure 9 presents a selected distribution of the with a normal risk approach, divided by the various worker
relationship between the project’s completion time experience ratings.
and cost, assuming the following agent attributes: a The results concerning the learning and forgetting
designer with a normal risk approach, a site manager of skills by workers who perform tasks on subsequentConstruction work cost and duration analysis with the use of ABMS 839
Table 4: Average project completion cost (in thousands of euros) for various worker experience ratings (little; average; high)
Site manager risk approach
Conservative Normal Risk-taker All
Designer risk Conservative (792;691;588) (793;694;587) (789;694;587) (690;691;690)
approach Normal (768;674;572) (770;673;572) (770;676;571) (671;672;672)
Risk-taker (700;613;527) (697;616;526) (700;616;527) (613;613;614)
All (753;660;562) (753;661;561) (753;662;562) (658;659;659)
Table 5: Average standard deviation of project completion costs (in thousands of euros) for various worker experience ratings (little;
average; high)
Site manager risk approach
Conservative Normal Risk-taker All
Designer risk Conservative (22;20;16) (21;19;17) (23;22;16) (85;86;85)
approach Normal (27;23;16) (25;24;15) (26;22;17) (83;84;84)
Risk-taker (28;22;17) (28;25;16) (27;21;15) (74;74;73)
All (47;40;30) (48;40;30) (46;39;30) (87;88;87)
Table 6: Average project completion time (days) for various worker experience ratings (little; average; high)
Site manager risk approach
Conservative Normal Risk-taker All
Designer risk Conservative (364;313;252) (364;312;252) (362;312;252) (310;309;309)
approach Normal (356;306;247) (355;305;246) (355;306;247) (303;302;303)
Risk-taker (329;281;229) (326;281;226) (327;280;227) (280;278;278)
All (350;300;243) (349;299;241) (348;299;242) (297;297;297)
work plots are presented in Figure 10, which also Table 8 presents the percentage share of the average
shows a sample performance coefficient yx _ laf depen- cost of each work within the overall cost of the entire
dency over project time in reference to soil strength- project, while Table 9 presents an analogous share in
ening as per variant 3 by workers with little experience. respect to project completion time.
The lower the value of yx _ laf , the lower the cost and Table 10 presents the average frequency of selecting
completion time of the task. When the value of yx _ laf a given soil strengthening variant by the designer in
decreases, this means that worker performance increases respect to their risk approach, and Table 11 presents the
when they perform the soil strengthening task as per average frequency of selecting plot size depending on the
variant 3. site manager’s risk approach.
Table 7: Average standard deviation for project completion time (days) for various worker experience ratings (little; average; high)
Site manager risk approach
Conservative Normal Risk-taker All
Designer risk Conservative (11;10;9) (11;11;10) (11;11;9) (46;47;46)
approach Normal (13;12;9) (13;12;9) (12;11;11) (45;46;46)
Risk-taker (12;10;9) (13;12;9) (12;11;10) (42;42;42)
All (19;17;13) (20;18;14) (19;17;14) (46;47;46)840 Grzegorz Śladowski and Bartłomiej Sroka
16% 100%
90%
14%
80%
12%
Probability distribuon
70%
10%
60%
8% 50%
40%
6%
30%
4%
20%
2%
10%
0% 0%
Compleon me in days
Figure 7: Probability distribution and distribution function for project completion time.
5 Discussion addition, focusing on a greater number of construction
work types included in a given sequence allows for effec-
Enhancing construction project modelling and analysis tive integration and a transition from multiagent simula-
relative to refs [16,17], as performed through a bottom- tion to a discrete event simulation, which is often used in
up assessment of their effectiveness by accounting for a project analysis at the process level.
greater number of decision-making agents, the effects of The graph (Figure 9) demonstrates that under these
learning and forgetting, as well as the impact of risk fac- assumptions, the project would be completed quickly
tors, allows for a better assessment of a given situation. In and cheaply by experienced workers, analogously, using
16% 100%
90%
14%
80%
12%
Probability distribuon
Distribuon funcon
70%
10%
60%
8% 50%
40%
6%
30%
4%
20%
2%
10%
0% 0%
Compleon costs in thousands of euros
Figure 8: Probability distribution and distribution function for project completion cost.Construction work cost and duration analysis with the use of ABMS 841
lile experience average experience high experience
Project cost in thousands of euros 850
800
750
700
650
600
550
500
200 220 240 260 280 300 320 340 360 380 400
Project compleon me
Figure 9: Cost–time dependency for a designer with a normal risk approach and a site manager with a normal risk approach, divided by
worker experience rating.
workers with little experience would result in the project in respect to soil strengthening variant 3 began after
having the longest completion time and the highest cost. 104 days after the project started, as it was the first
In cases where the soil strengthening variant is changed time when the designer decided to apply this solution
(by the designer’s decision) or there is a pause in the (Figure 10). Based on Tables 8 and 9, it can be observed
work (as the result of adverse risk factors), workers’ effec- that work associated with soil strengthening forms the
tiveness and skills associated with variant 3 deteriorate – greatest share of both project cost and time, which con-
which is the result of the forgetting mechanism. Succes- firms that the detailed analysis of this type of work is
sive project days have been marked on the horizontal critical in assessing project performance. In one case
axis. The effect of learning and forgetting on workers (assuming high worker experience), the percentage share
Figure 10: Performance coefficient value yx _ laf for workers with little experience in respect to soil strengthening variant 3.842 Grzegorz Śladowski and Bartłomiej Sroka
Table 8: Percentage share of the average cost of each stage relative to the average overall project cost for various worker experience ratings
(little; average; high)
Worker Types of work performed during the project
experience
Wearing course Existing subbase Soil Base course Laying a new
removal (%) dismantlement (%) strengthening (%) construction (%) stone surface (%)
Little 7.13 2.92 37.23 20.11 32.60
Average 7.76 3.13 35.55 19.27 34.29
High 8.50 3.40 33.51 17.93 36.66
All 7.73 3.13 35.61 19.21 34.32
Table 9: Percentage share of the average completion time of each stage relative to the average overall project cost for various worker
experience ratings (little; average; high)
Worker Types of work performed during the project
experience
Wearing course Existing subbase Soil Base course Laying a new
removal (%) dismantlement (%) strengthening (%) construction (%) stone surface (%)
Little 8.96 20.61 34.52 8.61 27.30
Average 9.36 21.36 33.39 8.85 27.04
High 9.73 22.22 32.40 9.39 26.25
All 9.30 21.30 33.56 8.90 26.93
in terms of both time and cost was higher and pertained rules of the site manager’s behaviour when selecting plot
to laying the wearing course. Based on Table 10, it can be size, so that the impact of their decision on project cost
observed that a conservative designer is highly inclined and completion time would be greater.
to choose the third soil strengthening variant, which It should be noted that the presented model has its
is the most expensive and the most time-consuming. A limitations. First, the project completion time listed in the
risk-taking designer is more prone to select the first var- model takes on an absolute form (denoted as a working
iant, which is the cheapest, but its performance is not form) and does not account for pauses arising from the
high. However, when analysing the results of average work schedule. The introduction of the schedule into the
project completion time and costs, the risk taken by the model, while accounting for the effect of the learning and
designer paid off in this case. The site manager behaved forgetting mechanism, could significantly magnify the
as expected, i.e. the greater his risk aversion, the more latter, which will be explored in further research. The
often they chose a small-sized plot (Table 11). As risk second limitation is the small number of risk factors
aversion lowered, they were observed to choose larger that we accounted for in the analysis. In future studies,
plots more often. The difference in the frequency of the collection of these factors will be expanded based on
selecting each plot size was not substantial. In the future, project specificity. As we presented a calculation experi-
the authors should investigate possible revisions to the ment based on a hypothetical case of a renovation of a
Table 10: Average frequency of selecting each soil strengthening
Table 11: Average frequency of selecting each working plot size over
variant over the course of the project by designer risk approach
the course of the project by designer risk aversion
Designer risk approach Soil strengthening variants
Site manager risk 200 m2 400 m2 600 m2 plot
Variant 1 Variant 2 Variant 3 approach plot plot
Conservative 0.96 3.38 11.57 Conservative 1.26 2.20 10.66
Normal 1.53 4.52 9.15 Normal 0.31 0.79 11.93
Risk-taker 3.33 4.33 4.29 Risk-taker 0.28 0.48 12.14
All 1.94 4.08 8.33 All 0.62 1.16 11.58Construction work cost and duration analysis with the use of ABMS 843
historical road surface, similar studies on actual con- which would allow for more reliable modelling, under-
struction project cases should be performed in the future, standing and optimisation of agent micro-behaviours
as it could allow for an effective verification of our (smart agents) for the purposes of maximising project
findings. performance.
Conflict of interest: Authors state no conflict of interest.
6 Conclusion
Assuming a system-based approach, construction pro- References
jects can be treated as complex systems composed of
many different interlinked elements like construction [1] Senge PM. The fifth discipline: the art and practice of the
works, people, equipment, materials and knowledge. learning organization. New York: Broadway Business; 2006.
[2] Hertogh M, Westerveld E. Playing with complexity: manage-
The concept of SoS that has recently been introduced
ment and organisation of large infrastructure projects.
into the literature [7] allows for multilevel modelling of
Erasmus University Rotterdam; 2010.
the dependency structure of such projects and the multi- [3] Taylor TRB, Ford DN. Managing tipping point dynamics in
level aggregation of their performance (e.g. in the context complex construction projects. J Constr Eng Manag.
of the time and cost of their completion). The preferred 2008;134(6):421–31. doi: 10.1061/(ASCE)0733-9364(2008)
bottom-up approach to the analysis of the aforemen- 134:6(421).
[4] Rahi K. Project resilience: a conceptual framework. SciKA-
tioned project performance starts with assessing the attri-
association for promotion and dissemination of scientific
butes and micro-behaviours of its individual elements knowledge. International Journal of information Systems and
defined at the so-called basic level of the aforementioned Project Management. Portugal: University of Minho; 2019.
multilevel structure. For the purposes of performing such [5] Williams T. The need for new paradigms for complex projects.
a bottom-up analysis, we focused on ABMS of construc- Int J Proj Manag. 1999;17(5):269–73. doi: 10.1016/S0263-
tion projects, which has rarely been used until now and 7863(98)00047-7.
[6] Love PED, Holt GD, Shen LY, Li H, Irani Z. Using systems
that allows one to account for the micro-behaviours of
dynamics to better understand change and rework in
the aforementioned system elements and their dynamic construction project management systems. Int J Proj
interactions. As a consequence, this carries over to the Manag. 2002;20(6):425–36. doi: 10.1016/S0263-7863(01)
assessment of the performance of the entire project. The 00039-4.
objective of this article was to develop the agent-based [7] Zhu J, Mostafavi A. A system-of-systems framework for per-
formance assessment in complex construction projects. Org
approach in accordance with the concept of SoS [16]. For
Technol Manag Const An Int J. 2014;6(3):1083–93.
this purpose, we accounted for a greater complexity of doi: 10.5592/otmcj.2014.3.2.
the analysed project by: analysing not one, but several [8] Watkins M, Mukherjee A, Onder N, Mattila K. Using agent-
types of work, introducing a greater number of coop- based modeling to study construction labor productivity as an
erating agents within tasks, accounting for the effects of emergent property of individual and crew interactions. J Constr
learning and forgetting on agents who perform individual Eng Manag. 2009;135(7):657–67. doi: 10.1061/(ASCE)
CO.1943-7862.0000022.
construction works and the impact of adverse events
[9] Wu DD, Kefan X, Hua L, Shi Z, Olson DL. Modeling technolo-
(weather conditions, equipment failure, archaeological gical innovation risks of an entrepreneurial team using system
discoveries, etc.) on the project. We based the model dynamics: an agent-based perspective. Technol Forecast Soc
and its analysis on a sample project associated with car- Change. 2010;77(6):857–69.
rying out renovation work in the road construction sector. [10] Walsh K, Sawhney A, Bashford H. Agent-based modeling and
simulation in construction. In: S. Chick, P. Sánchez, D. Ferrin,
One important aspect that needs to be investigated in the
D. J. Morrice, editors. Proceedings of the 2003 Winter
future is the problem of formulating reliable and precise Stimulation Conference. Vol. 4. New Orleans, LA, USA; 2003.
assumptions for the model and input data for its analysis, p. 28–30.
which pertain to, among others, defining risk aversion for [11] Sheffield J, Sankaran S, Haslett T. Systems thinking: taming
each agent and the rules for their possible behaviours, complexity in project management. Horiz. 2012;20(2):126–36.
doi: 10.1108/10748121211235787.
empirical data concerning the qualification and perfor-
[12] Maier MW. Architecting principles for systems-of-systems.
mance of production means or concerning risk factors
Syst Eng. 1998;1:267–84.
and their materialisation probability. When developing [13] Lewis G, Morris E, Place P, Simanta S, Smith D, Wrage L.
ABMS and its application in the construction sector, Engineering systems of systems. IEEE International Systems
one should also note the potential of machine learning, Conference. Montreal, QC, Canada: IEEE; 2008.844 Grzegorz Śladowski and Bartłomiej Sroka
[14] Pryke S, Badi S, Almadhoob H, Soundararaj B, Addyman S. information sharing in construction. J Manag Eng.
Self-organizing networks in complex infrastructure projects. 2008;24(4):245–54.
Proj Manag J. 2018;49(2):18–41; Chinowsky P, Taylor JE, [28] Joseph T. Towards an agent-based construction supply net-
Di Marco M. Project network interdependency alignment: new work modeling and simulation. Autom Constr. 2004;14:353–9.
approach to assessing project effectiveness. J Manag Eng. [29] Asgari S, Awwad R, Kandil A, Odeh I. Impact of considering need
2011;27(3):170–8. for work and risk on performance of construction contractors: an
[15] Johnson CW. What are emergent properties and how do they agent-based approach. Autom Constr. 2016;65:9–20.
affect the engineering of complex systems? Reliab Eng [30] Ahn S, Lee S, Steel RP. Effects of workers’ social learning:
Syst Saf. 2006;91(12):1475–81. doi: 10.1016/ focusing on absence behavior. J Constr Eng Manag.
j.ress.2006.01.008. 2013;139(8):1015–25.
[16] Zhu J, Mostafavi A. Performance assessment in complex [31] Seo J, Lee S, Seo J. Simulation-based assessment of workers’
engineering projects using a system-of-systems framework. muscle fatigue and its impact on construction operations.
IEEE Syst J. 2017;12(1):262–73. J Constr Eng Manag. 2016;142(11):04016063.
[17] Zhu J, Mostafavi A, Ahmad I. System-of-systems modeling of [32] Goh YM, Ali MJA. A hybrid simulation approach for integrating
performance in complex construction projects: a multi-method safety behavior into construction planning: an earthmoving
simulation paradigm. 2014 International Conference on case study. Accid Anal Prev. 2016;93:310–8.
Computing in Civil and Building Engineering. Orlando, Florida, [33] Marzouk M, Ali H. Modeling safety considerations and space
United States: ASCE; June 23–25, 2014. p. 1877–84. limitations in piling operations using agent based simulation.
[18] Zhu J, Mostafavi A, Whyte J. Towards systems integration Expert Syst Appl. 2013;40(12):4848–57.
theory in megaprojects: a system-of-systems framework. LC3 [34] Palaniappan S, Sawhney A, Janssen MA, Walsh KD. Modeling
2017: Proceedings of the Joint Conference on Computing in construction safety as an agent-based emergent phenomenon.
Construction (JC3). Greece: 2017 July. p. 313–20. Proceedings of the 24th International Symposium on Automation
[19] Somarathna KUS. An agent-based approach for modeling and and Robotics in Construction. Kochi, India: ISARC; 2007,
simulation of human resource management as a complex September 19–21. p. 375–82.
system: management strategy evaluation. Simul Model Pract [35] Jabri A, Zayed T. Agent-based modeling and simulation of
Theory. 2020;104:102118. earthmoving operations. Autom Constr. 2017;81:210–23.
[20] Macal CM, North MJ. Agent-based modeling and simulation. [36] Kim K, Kim KJ. Multi-agent-based simulation system for
Proceedings of the 2009 Winter Simulation Conference (WSC). construction operations with congested flows. Autom Constr.
Austin, TX, USA: IEEE; 2009. p. 86–98. 2010;19(7):867–74.
[21] Epstein JM, Axtell R. Growing artificial societies: social science [37] OMG O. Unified modeling language (OMG UML), superstruc-
from the bottom up. Washington, DC: American Psychological ture, version 2.3. Milford, MA, USA: Object Management
Association; 1996. Group; 2010.
[22] Nwana HS. Software agents: an overview. Knowl Eng Rev. [38] OMG O. Unified modeling language (OMG UML), infrastructure,
1996;11(3):205–44. version 2.3. Milford, MA, USA: Object Management Group;
[23] Weyns D, Omicini A, Odell J. Environment as a first class 2010b.
abstraction in multiagent systems. Auton Agent Multi Agent [39] Panas A, Pantouvakis JP. Simulation-based and statistical
Syst. 2007;14(1):5–30. analysis of the learning effect in floating caisson construction
[24] Bandini S, Manzoni S, Vizzari G. Agent based modeling and operations. J Constr Eng Manag. 2014;140(1):04013033.
simulation. In: Meyers R, editor. Encyclopedia of complexity doi: 10.1061/(ASCE)CO.1943-7862.0000782.
and systems science. New York, NY: Springer; 2009. [40] Mályusz L, Pém A. Prediction of the learning curve in roof
p. 184–97. insulation. Autom Constr. 2013;36:191–5. doi: 10.1016/
[25] Bonabeau E. Agent-based modeling: methods and techniques j.autcon.2013.04.004.
for simulating human systems. Proc Nat Acad Sci. [41] Biruk S, Rzepecki L. Scheduling repetitive construction pro-
2002;99(suppl 3):7280–7. cesses using the learning-forgetting theory. IOP Conf Series
[26] Ren Z, Anumba CJ. Multi-agent systems in construction– Mater Sci Eng. 2019;471(11):112039. doi: 10.1088/1757-899X/
state of the art and prospects. Autom Constr. 471/11/112039.
2004;13(3):421–34. [42] Nembhard DA, Uzumeri MV. Experiential learning and forget-
[27] Min JU, Bjornsson HC. Agent-based construction supply ting for manual and cognitive tasks. Int J Ind Ergon.
chain simulator (CS 2) for measuring the value of real-time 2000;25(4):315–26. doi: 10.1016/S0169-8141(99)00021-9.You can also read