Considerations for the 2022 duck season - Current as at 17 December 2021 - Game ...
←
→
Page content transcription
If your browser does not render page correctly, please read the page content below
Considerations for the 2022 duck season
Current as at 17 December 2021
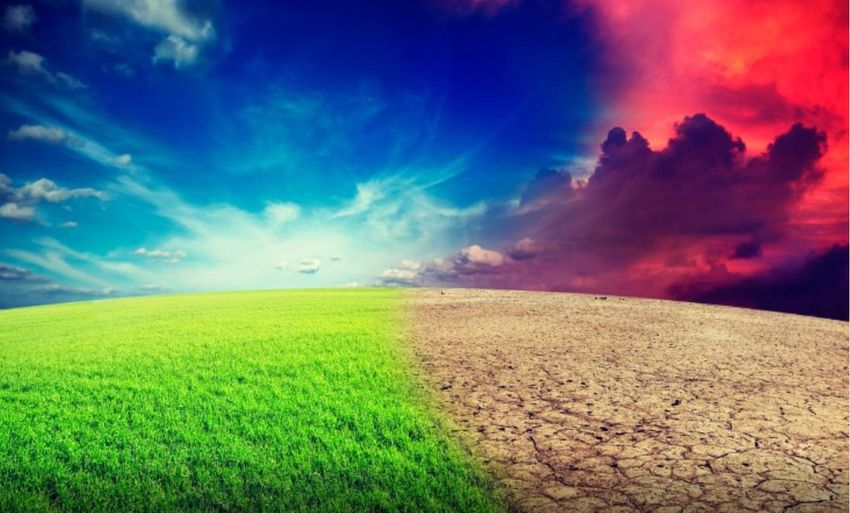
Climate

Past and present climatic conditions dictate
present environmental conditions

Climatic predictions can be used to consider
whether environmental conditions will change
into the future

                                               3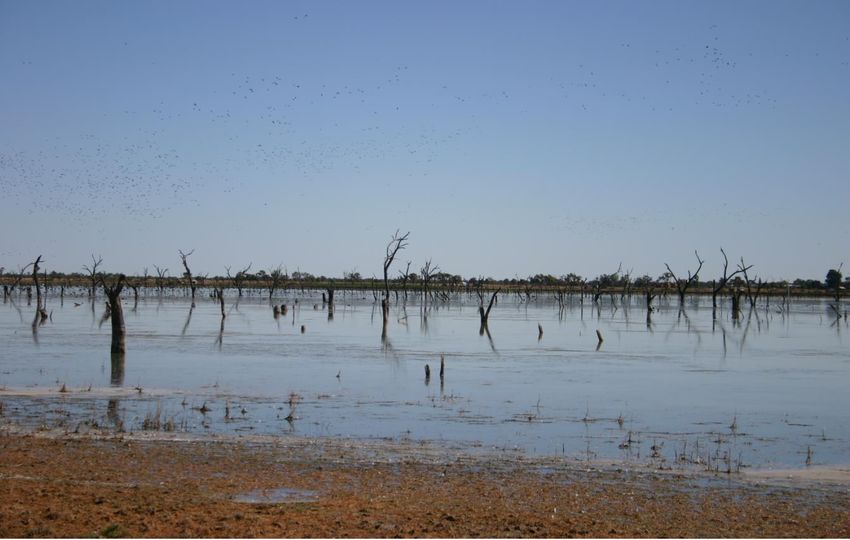
Climatic conditions and waterfowl
• Climatic conditions, such as large scale
  oscillations (e.g. Southern Oscillation Index)
  and local weather (e.g. rainfall and
  temperature) can effect the distribution,
  productivity and size of waterfowl populations.

• In Australia, waterbird abundance is strongly
  related to river flows and rainfall (Kingsford et
  al. 2017).

• Large and extensive rainfall events can
  contribute to population increase as conditions
  are enhanced to support breeding and
  recruitment. Conversely, during dry periods,
  breeding may be modified or greatly reduced
  (see Kingsford and Norman 2002).

• Hunting during periods when there is little         Climate effect on waterbird populations. Source: Jenouvrier 2013
  recruitment (e.g. dry periods) removes
  breeding adults which can negatively affect
  subsequent recruitment and further drive
  declines in hunted species (Kingsford et al.
  2017).
                                                                                                                   3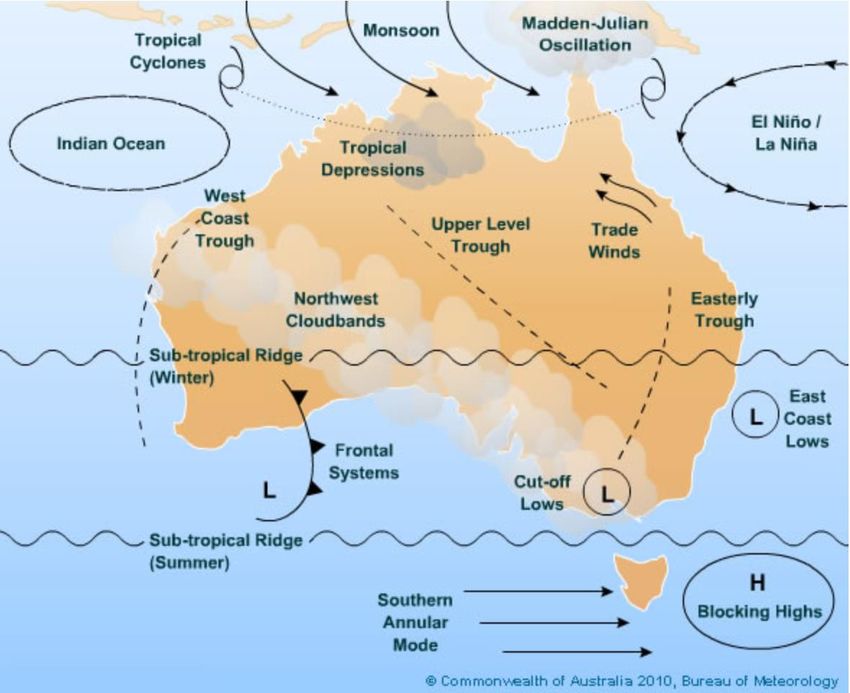
2015                     2016

                                  Annual rainfall
                                  deciles 2015 to
2017                     2018     2021
                                  (Deciles = rainfall received compared to historical
                                  averages)
                                  Source: www.bom.vic.gov.au

2019                     2020   2021

Source: www.bom.gov.au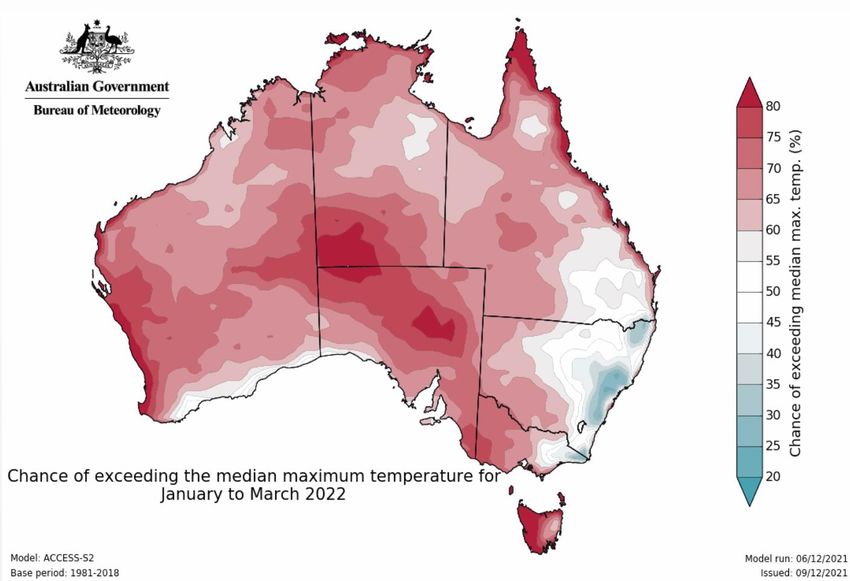
Rainfall through the seasons 2021
     Summer                  Autumn                  Winter                     Spring

• Much of the NSW portion of the Murray Darling Basin (MDB) received above average
  rainfall over the summer period, as well as central and south west Victoria and parts of
  northern QLD. The central and southern coast of QLD received below to very much below
  average falls. Much of the west of Australia received above average rainfall.
• The MDB continued to receive above average rainfall in NSW, southern QLD and eastern
  Victoria in autumn. Average falls were recorded throughout most of the rest of eastern
  Australia except northern and western Victoria and south-eastern SA which received below
  to very much below average rainfall.
• Above average rainfall was received across approximately half of NSW and in parts of
  central QLD, coastal SA and Gippsland and parts of south western Victoria in winter. The
  rest of eastern Australia mostly received average rainfall.
• Most of Australia received above average to very much above average rainfall in spring.
  South eastern SA received below average rainfall.
                                                                                         5
                                                       Source: www.bom.gov.au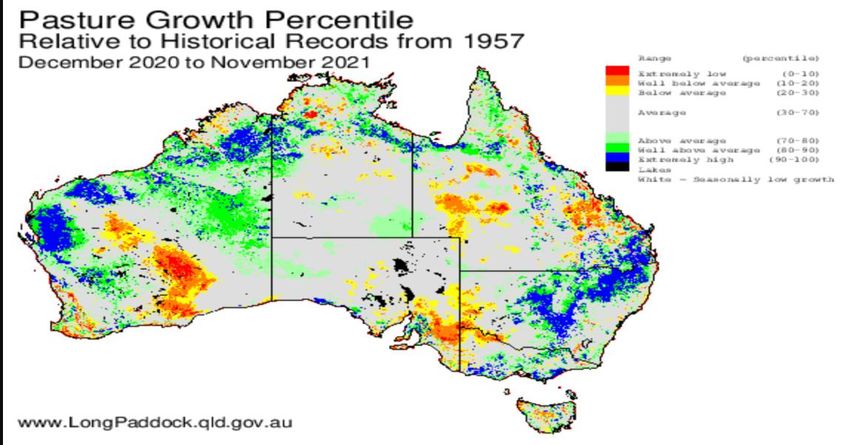
Year-to-date rainfall 2021
•    November was Australia’s, NSW’s,
     SA’s and the MDB’s wettest November
     on record, fuelled by a weakening
     negative Indian Ocean Dipole and La
     Nina.

•    It was Australia’s wettest spring since
     the La Nina of 2010, and the tenth
     wettest since records began in 1900.

•    Serious rainfall deficiencies for the
     period commencing April 2020 have
     been cleared from QLD following very
     much above average rainfall during
     November.

•    Rapid filling of storages continued in the northern MDB during spring, and many storages
     are above full capacity.

•    Hume dam storage is at its highest level in five years.

•    South-east and central QLD storages have started to
     increase.
Source: www.bom.vic.gov.au                                                                6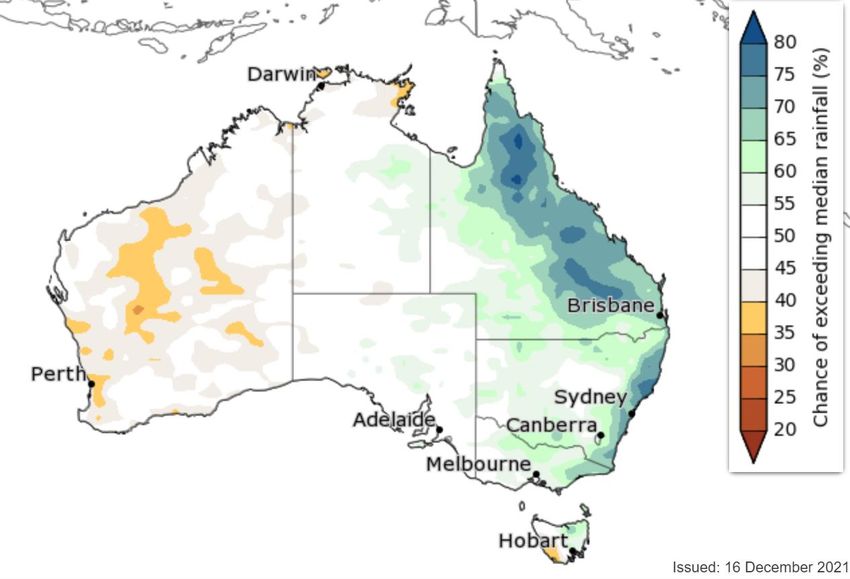
Four-year rainfall
• Multi-year rainfall deficiencies which
  originated during the 2017-2019 drought
  remain over large parts of the country,
  despite some lessening following the record-
  wet November. While there has a been a
  reduction in NSW and of the area of lowest
  on record in eastern QLD, the accumulated
  rainfall anomalies remain very large for
  some areas.
• Over the past two years, seasonal
  conditions have improved over large areas.
  Water storages have increased across much
  of Australia, especially in the Murray-Darling
  Basin
• Many areas experiencing rainfall
  deficiencies for periods longer than 24
  months have typically experienced below
  average rainfall between April and October,
  which is consistent with the long-term trends
  in rainfall reduction over southern Australia
  and along the Great Dividing Range.
• Further periods of above average rainfall are needed to continue drought recovery,
  especially in parts of QLD, South Australia, far west NSW and large parts of Victoria,
  particularly in the north west.
Source: www.bom.vic.gov.au                                                                 7
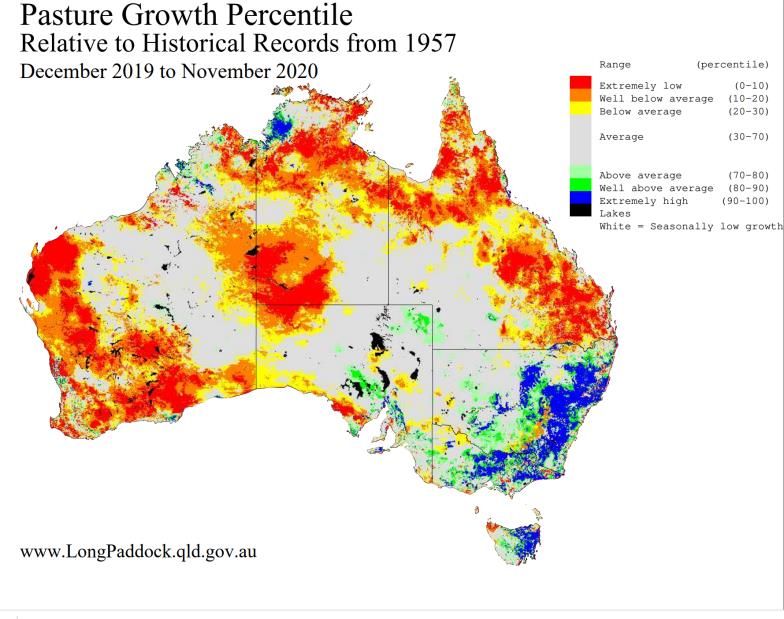
Soil moisture – December 2021

                         2020                                    2021

• Root zone (0-100cm) soil moisture at December improved over much of eastern Australia
  from 2020 to 2021.

• At 9 December 2021, root zone soil moisture was above average across most of Australia,
  including the Murray-Darling Basin, reflecting recent above average spring rainfall.

                                                                                     8
Source: www.bom.gov.au
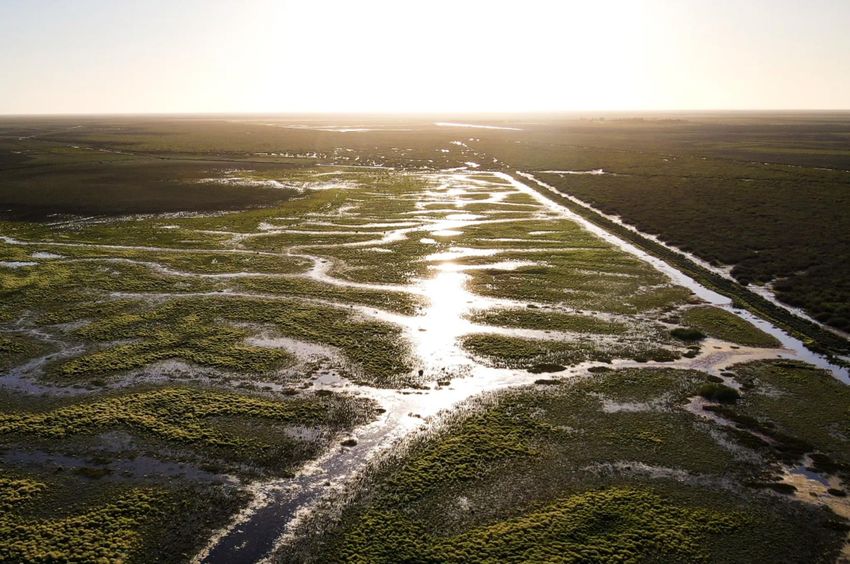
Runoff
  Runoff impacts the availability of
  water in the wetlands and the
  health of riverine systems. It has a
  direct influence in the creation and
  maintenance of waterbird habitat.
  •    Year-to-date runoff for much of
       eastern Australia has been
       above average to very much
       above average.
  •    However, for western Victoria
       and much of eastern South
       Australia, runoff has been below
       average.

Source: www.bom.gov.au                    9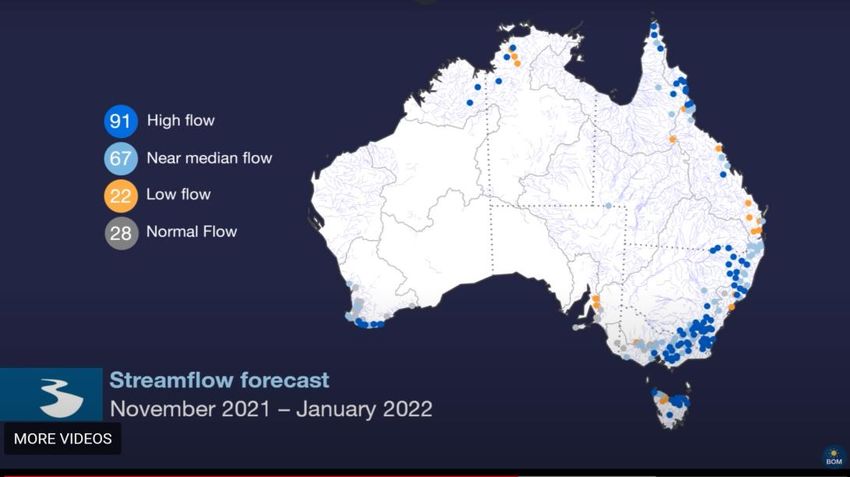
Australian water storage levels
Water storage levels provide an
indicator of the availability of
waterbird habitat and waterflows
through feeder systems.
However, often impoundments
and storages can trap water and
prevent it from entering creeks,
streams and wetlands, thereby
reducing available habitat.
Therefore, this information must
be considered in context,
particularly during dry periods.
Deep storages generally provide
poor habitat for game ducks.
• In 2021, Australia’s water
  storages increased significantly
  by 20.4% from the same time
  last year, from 51.8% to 72.2%.

                                     10
Source: www.bom.gov.au
Victorian water storage levels
• The total (Melbourne and
Regional) Victorian water storage
levels are currently at 85.7%
compared to 66.3% last year.
• Storage levels have increased by
19.4% from this time last year.
11
Source: www.bom.gov.auMurray-Darling Basin water storage levels The Murray–Darling Basin is a critical area for waterfowl production and Australia’s most developed river basin (240 dams storing 29,893 GL). • Storage systems in the MDB are at 91% of capacity, which is 31% higher than at the same time last year (60%). • Storage volumes in the northern MDB have significantly increased to 90.9% from 24.5% in November 2020. • Storage volumes in the southern MDB are at 90.4% up from 69% in November 2020. Source: www.bom.gov.au 12
2020   2021

              Lake Eyre Basin
              •   Rainfall across the Lake Eyre
                  Basin increased from 2020.
              •   Rainfall was higher than
                  average across 97% of the
                  Basin area and very much
                  above average across 67%
                  of the area in November.
              •   Total rainfall was 60mm,
                  216% higher than the long-
                  term mean of 19mm for
                  November.
              •   Streamflows were higher
                  than average for 75% of sites
                  in November.
              •   Most of Lake Eyre is dry.

              Source: www.bom.gov.au      13
Habitat availability
Eastern Australian Waterbird
Survey (EAWS)
The EAWS monitors changes in the abundance and
distribution indices of 50 waterbird species in eastern
Australia. It also tracks changes in waterbird habitat over
time.
The EAWS was designed by CSIRO’s Dr Graeme
Caughley and has been conducted annually in October
since 1983. Waterbirds are counted from the air across
ten aerial survey bands (each 30 km in width), every two
degrees of latitude, crossing eastern Australia to monitor
all wetlands over 1ha in size.

The EAWS provides:
    ▪ an index (not total count) of abundance of
      waterbirds, including game ducks
    ▪ information on the distribution of waterbird and
      game duck populations along survey bands
    ▪ the extent and distribution of habitat along survey
      bands, and
    ▪ information on waterbird breeding.

The information is valuable for examining waterbird trends
on over one-third of continental Australia and over a long
period.
EAWS wetland area index
The wetland area index is a measure of wetland availability across all 10 EAWS transects
(bands). This gives an indication of the extent and distribution of habitat available for
waterbirds.
• The 2021 wetland area index ranked 27th of the 39 surveys.
• There was an increase in the index from last year but it is 61% of the long-term average.
• The majority of the available habitat occurs from southern to central NSW (bands 3 & 4)
and central QLD (band 8).
Long-term wetland area index Distribution of wetland area across the
survey bands
Changes over time in wetland area in the Eastern Australian Distribution of wetland area index in 10 survey bands of the Eastern
Waterbird Survey (1983 - 2021); horizontal line shows long- Australian Waterbird Survey in 2021.
term average.
16Wetland distribution
2020 2021
All surveyed wetlands
with surface water present
are plotted; dry wetlands
not plotted
• The majority of the habitat surveyed occurred in bands 3 & 4 and 8. This is reflected in
the increased wetland area in the Murray-Darling Basin and, in particular, those areas of
the Lachlan and Murrumbidgee Rivers which experienced flooding. Band 8 also recorded
a greater amount of habitat compared with remaining bands.
• 48% of surveyed wetlands (including dry wetlands) held no waterbirds.
17Pasture conditions
Pasture conditions are a coarse indicator of
potential feeding habitat for grazing species,
such as Wood Duck and Mountain Duck, and
nesting habitat for ground-nesting game
ducks.
Current conditions
• Over the last 12 months, pasture growth
across NSW and Victoria has remained at
average or higher.
• Pasture growth in QLD has improved
throughout much of the state, however
some deficiencies remain in the central
west and east.
• South-eastern South Australia, parts of
northern Victoria and far west NSW has
experienced below to well below average
growth.
18Population indices of abundance,
distribution and breeding
19Index of waterbird abundance
(all waterbirds)
Up to 50 waterbirds species are surveyed in October each year and includes all Victorian game
duck species and non-game species such as swans, Freckled Duck, ibis, coots etc.
• The total index of waterbird abundance (95,306) decreased by 41% from 2019 (162,824).
The total waterbird abundance index is the 3 rd lowest in 39 years.
• Only 2 wetlands supported more than 5,000 waterbirds.
Waterbirds were
most abundant in
Bands 2&3, 5&6
and 10.
Dry wetlands and wetlands with
zero waterbirds not plotted
The abundance index is not a total count. It provides information on the trends in waterbird abundance along the survey bands. 20EAWS game duck abundance index
This index provides information on game
ducks only.
• The game duck abundance index
decreased by 58% from last year.
• The 2021 game duck abundance index
was the 3rd lowest recorded in 39 years
of survey and is 25% of the long-term
average.
• The decrease in the index was despite
an increase in available habitat. Habitat
availability and game duck abundance
have a positive relationship, so when
habitat increases, so does duck
abundance but with a lag as it takes
time for the habitat and birds to
respond.
21EAWS game duck abundance
index bands 1 & 2
• Bands 1 and 2 cover parts of Victoria. Band 1 covers parts of southern coastal
Victoria and band 2 covers parts of northern Victoria.
• Game duck abundance in band 1 was similar for 2020 and 2021 but declined
significantly in band 2 in 2021 reflecting the drier conditions in that band.
22EAWS game duck abundance
index over time
EAAWS game duck abundance index 1983 - 2021
1100000
Survey Year
1000000
Index game duck abundance
900000 3 year rolling average of game duck When considering
Index of game duck abundance
abundance management implications,
800000 Mean game duck abundance
the abundance index must
700000 Median game duck abundance be considered in context
with:
600000 ▪ distribution of birds
500000
▪ habitat availability and
distribution
400000 ▪ climatic forecasts
▪ concentrations of birds
300000
200000
100000
0
1983
1984
1985
1986
1987
1988
1989
1990
1991
1992
1993
1994
1995
1996
1997
1998
1999
2000
2001
2002
2003
2004
2005
2006
2007
2008
2009
2010
2011
2012
2013
2014
2015
2016
2017
2018
2019
2020
2021
Survey year
• This graph includes abundance index data (red line) and the rolling (or moving) average
(green line). A rolling average is used to get an overall trend in a data set. In this case, the
rolling average is calculated for three-year subsets.
• The long-term average (mean) and median abundance levels are also included. The median
is the mid-value and is more statistically suitable than the average when outliers are present.
23Relative abundance of game duck
species 1983-2021 (EAWS)
1100000
Relative abundance of game duck species 1983 -2021
1000000 Australian Wood Duck
Pink-eared Duck
Mountain Duck
900000
Hardhead Duck
Grey Teal
800000
Chestnut Teal
Relative abundance
Blue-winged Shoveler
700000
Pacific Black Duck
600000
500000
400000
300000
200000
100000
0
1983
1984
1985
1986
1987
1988
1989
1990
1991
1992
1993
1994
1995
1996
1997
1998
1999
2000
2001
2002
2003
2004
2005
2006
2007
2008
2009
2010
2011
2012
2013
2014
2015
2016
2017
2018
2019
2020
2021
The percentage of game ducks detected in 2021 EAWS were:
Black Duck 11% (12%), Grey Teal 50% (33%), Wood Duck 14% (10%), Pink-eared Duck 13% (27%),
Hardhead 6% (14%), Mountain Duck 5% (3%), Chestnut TealVictorian game duck abundance estimates • Aerial and ground counts were conducted on randomly selected farm dams, sewage ponds, wetlands, creeks, rivers and irrigation channels throughout Victoria in October. • It was estimated that there were 2.94 million game ducks on these habitats. This is compared to 2.42 million game ducks in 2020, a 20% increase. • The total statewide abundance of game ducks was higher than in 2020, mainly due to the inclusion of estimates for rivers/streams and sewage treatment ponds, which were not included in the pilot survey in 2020. • Total surface water (combined dams and wetlands) increased by 13% (14,326 hectares) between 2020 and 2021. • Wood Duck were the most numerous game species (~1,240,500), followed by Grey Teal (~609,300), Australian Shelduck (~503,900) and Pacific Black Duck (~443,700). • These estimates are preliminary and may be subject to revision. Ramsey, D. and Fanson, B. (2021) Preliminary results from the 2021 survey of 25 game ducks in Victoria.
NSW Riverina waterfowl
abundance surveys
• Helicopter, drone and ground counts of
  randomly selected farm dams, treatment
  ponds and wetlands were conducted
  throughout the NSW Riverina to
  determine waterfowl abundance in order
  to set annual crop damage mitigation
  destruction quotas.
• Surveys were conducted in late-April to
  July.
• Game duck* numbers increased from
  the previous year by almost 250% from
  463,0404 to 1,149,395 reflecting the
  improved conditions in this part of the
  MDB.
• Numbers of waterfowl are recovering
  towards 2016 levels following a decline
  in response to the drought years of
  2017-2019.

*Includes Plumed Whistling Duck, which is not a
Victorian game duck species

Source: NSW Department of Primary Industries (2021) 2021-2022 Annual Waterfowl Quota Report to DPI Hunting.   26
EAWS waterbird distribution

                                   Waterbirds were most
                                   abundant in bands 2&3,
                                   5&6 and 10.

•   Waterbirds were again widely dispersed (similar to 2020) and less concentrated, reflecting an
    increase in habitat availability, especially in the Murray-Darling Basin.

•   Surveyed waterbirds were most abundant in bands 2 & 3, 5 & 6 and 10. Data shows these same
    bands also held the most game ducks. The majority of the habitat occurred in bands 3&4 and 8.

•   Only two wetlands supported more than 5,000 waterbirds, representing 13% of total abundance.
    Five wetlands supported more than 5,000 waterbirds in 2020. More than 48% of surveyed
    wetlands supported no waterbirds (which includes wetlands that were dry).
                                                                                                    27
Waterbird breeding (all species combined)
• The EAWS total breeding index (all species combined) increased considerably from the previous
year but was still below the long-term average.
• EAWS breeding species richness (i.e. the number of different species observed breeding) also
increased from last year but was below the long-term average and was the ninth lowest on
record. Ibis made up 83% of the total breeding records.
28Waterbird breeding (all species combined)
• Most breeding occurred in bands 1 and 3.
• Ibis comprised most of the breeding recorded
(83% of the total).
Only wetlands with breeding
recorded are plotted.
29EAWS indices over time
Decadal changes in indices for total abundance, wetland area, number of breeding species
and breeding in the EAWS 1983 - 2021
• For eastern Australia, overall waterbird abundance, breeding index and breeding
species are positively related to habitat availability (wetland area index).
• All major EAWS indices for waterbirds (wetland area index, total abundance index,
number of species breeding and breeding index) continue to show significant
declines over time.
30EAWS game duck abundance,
distribution and habitat - summary
1100000
EAAWS game duck abundance and wetland area indices 1983 - 2021 Index of game duck abundance
Indices of wetland area (Ha) and game duck
1000000
Mean game duck abundance
900000
Median game duck abundance
800000
Wetland area index (Ha)
700000 Median wetland index (Ha)
abundance
600000
500000
400000
300000
200000
100000
0
1983
1984
1985
1986
1987
1988
1989
1990
1991
1992
1993
1994
1995
1996
1997
1998
1999
2000
2001
2002
2003
2004
2005
2006
2007
2008
2009
2010
2011
2012
2013
2014
2015
2016
2017
2018
2019
2020
2021
Survey year
Where the ducks are Where the habitat is
31Climate predictions – future conditions
32Current climate drivers
• Australia's climate can vary greatly
from one year to the next.
• A number of drivers can influence the
Australian climate. Influences will
have varying levels of impact in
different regions at different times of
year.
• Current influences on Australia’s
climate include:
• La Niña
• The Southern Annular Mode
(SAM)
• The Madden–Julian Oscillation
(MJO)
• All of these influences typically result
in above average rainfall for
northern, eastern or central parts of
the country.
Source: www.bom.gov.au
33January – March 2022 predicted rainfall
January – March rainfall prediction can be • January to March rainfall is likely to be
used to indicate the potential impact on above median for eastern QLD, east
coast NSW, eastern Victoria, areas
habitat for the forthcoming season. near the NSW-Victoria border, and
north-east Tasmania (chance of
exceeding median is greater than
60%).
• The rest of Australia has roughly equal
chances of above or below median
rainfall (chance of exceeding the
median is close to 50%).
• There is an increased chance of
unusually high rainfall (in the top 20%
of historical records) for January to
March in eastern Queensland, through
parts of eastern NSW and eastern
Victoria, and in small patches of
western Queensland and western
NSW (1.5 to 2.5 times the usual
chance).
Source: www.bom.gov.au
34January – March 2022
temperature prediction
• January to March maximum
temperatures are likely to be
above median for most of
Australia (>65% chance), except
east of the Great Dividing Range
in NSW and Victoria and the WA
southern coastline with a mixed
or below median outlook.
Source: www.bom.gov.au
35Streamflow predictions
Streamflow has a direct influence on waterbird habitat extent and population abundance.
Rivers and creeks provide feeding, resting and breeding habitat and provide inputs into
wetlands where they have not been diverted.
Current prediction
• For November - January, near median or high stream flows are expected across most
of central and eastern Victoria, and parts of southern and north-eastern NSW. Near
median or high stream flows together with predicted high summer rainfall increases the
risk of flooding across areas of eastern Australia which can provide waterbird habitat of
varying duration depending on the extent of flooding and follow-up rains.
36
Source: www.bom.gov.auVictorian harvest estimates 2021
2021 harvest estimates
 Harvest statistics can provide information on the health and dynamics of game duck
 populations, including distribution, abundance and productivity.

 •    The 2021 duck season was modified, due to ongoing reduced game duck abundance.
      The season length was 20 days, commencing on 26 May and concluding on 14 June,
      and the daily bag limit was five birds. Blue-winged Shoveler could not be hunted.

 •    COVID-19 restrictions impeded the movement of hunters within Victoria. These
      restrictions and the reduced season significantly impacted on participation levels and
      the resultant size of the total seasonal harvest.

 •    There was a maximum of 24,330 Game Licence holders endorsed to hunt duck in 2021.
      It was estimated that 32%, or 7,785, actually hunted, each taking an average seasonal
      harvest of 6.8 birds.

 •    The average number of duck hunting days per active duck hunter was estimated to be
      2.6 days.

Source: Moloney, P.D. and Flesch, J.S. (2021) Estimate of duck and Stubble Quail harvest in Victoria for 2021.

                                                                                                                 38
2021 harvest estimates cont…
• The total estimated seasonal harvest in 2021 was 52,500, the lowest recorded
harvest since the telephone surveys were introduced in 2009 and less than one-
sixth of the average annual duck harvests revealed by previous surveys
(347,000).
• The total estimated number of duck hunting days was 19,700 and was the lowest
recorded, less than one-quarter of the average annual duck hunting days in
previous surveys (90,000).
• The two most commonly harvested species were Pacific Black Duck (37% of the
total harvest) and Australian Wood Duck (27% of the total harvest). The remaining
ducks harvested were Grey Teal (21%), Chestnut Teal (10%), Mountain Duck (3%)
and Pink-eared Duck (1%) and Hardhead (Long-term harvest estimates
Estimates 20091 20102 2011 2012 2013 2014 20153 20164 20175 20186 20197 20208 20219 Avg
2009 -
2021
Licensed 18,348 21,861 23,716 24,533 24,036 26,261 25,837 25,681 26,324 25,799 24,925 23,378 24,330 24,233
hunters
Total # 76,659 85,801 103,450 109,718 91,748 118,800 91,264 100,749 96,508 91,570 81,023 29,501 19,720 84,347
hunter days
Total harvest 222,302 270,574 600,739 508,256 422,294 449,032 286,729 271,576 438,353 396,965 238,666 60,403 52,456 324,488
Average # 4.0 4.0 4.5 4.6 3.7 4.6 3.6 3.9 3.8 3.6 3.3 1.26 2.57 3.65
days hunted
in the season
Seasonal 11.1 12.5 26.0 21.2 17.2 17.3 11.4 10.5 17.4 15.7 9.62 2.58 2.16 13.44
harvest per
licence
holder
Opening 4.5 4.2 9.2 5.3 9.5 5.7 5.8 5.1 7.1 6.3 4.4 N/A N/A 5.6*
weekend bag
per hunter
Average # 2.7 3.1 5.7 4.6 4.6 3.7 3.1 2.6 4.5 6.4 2.9 2.05 2.33 3.71
ducks per day
hunted
*Does not include 2020 and 2021 Harvest estimates are at 95% confidence intervals
Modified season arrangements
1. Two (2) birds per day with an additional three (3) Wood Duck. No Blue-winged Shoveler, Pink-eared Duck or Hardhead duck (49 day season)
2. Five (5) birds per day with an additional three (3) Wood Duck. No more than 1 Blue-winged Shoveler (72 day season)
3. Ten (10) birds per day which included a maximum of two Blue-winged Shoveler on opening day. Five (5) birds per day which includes a maximum of one Blue-winged Shoveler for
remainder of season (80 day season)
4. Eight (8) birds on opening day. Four (4) birds per day for remainder of the season. No Blue-winged Shoveler hunted in 2016 (87 day season)
5. Ten (10) birds per day. No Blue-winged Shoveler hunted in 2017 (87 day season)
6. Ten (10) birds per day. No Blue-winged Shoveler hunted in 2018 (87 day season)
7. Four (4) birds per day on opening weekend. Five (5) birds per day for the remainder of the season. No Blue-winged Shoveler hunted in 2019 (65 day season)
8. Three (3) birds per day. No Blue-winged Shoveler hunted in 2020 (38 day season). COVID-19 restrictions applied to travel, gathering size, no overnight camping
9. Five (5) birds per day. No Blue-winged Shoveler hunted in 2021 (20 day season). COVID-19 restrictions applied to travel and the size of social gatherings
40Harvest per game species
Percentage (rounded) of harvest per duck species for 2021
Blue-winged Shoveler
0%
Hardhead Duck
0%
Chestnut Teal
10%
Pacific Black Duck
37%
Australian Wood Duck
27%
Mountain Duck Grey Teal
3% 22% Pink-eared Duck
1%
Grey Teal, Wood Duck and Black Duck consistently make up the majority of the harvest each year.
The size of the Grey Teal harvest was significantly lower than normal in 2021 and accords with the
reduction in Grey Teal abundance detected during the EAWS. The Black Duck harvest was slightly
higher than normal and Wood Duck slightly lower.
Source: Moloney, P.D. and Flesch, J.S. (2021) Estimate of duck and Stubble Quail harvest in Victoria for 2021. 41Summary Summary
Summary
•   La Nina has influenced Australia’s climate for the last two years, resulting in improvements in rainfall. Water storages,
    wetlands and waterways have benefitted, as has the wildlife that inhabits these environments. New South Wales and parts
    of the Murray Darling Basin in particular have benefitted. Despite these improvements, the EAWS wetland area index is at
    61% of the long-term average.

•   Multi-year rainfall deficiencies experienced during the 2017 – 2019 drought still remain for some parts of eastern Australia.
    Waterbird habitat is patchy with areas including south-east South Australia, northern Victoria, western Queensland and far
    western New South Wales experiencing accumulated rainfall deficiencies.

•   The EAWS index of game duck abundance for eastern Australia has declined and is the third lowest recorded in 39 years, or
    25% of the long-term average. Victoria’s estimated total game duck abundance has increased somewhat from 2020 and total
    abundance has significantly increased in the NSW Riverina, an area that has benefitted from the improved rainfall over the
    last two years. Waterbird breeding has increased in response to the improved conditions but is still below the long-term
    average.

•   Waterbirds, including game ducks, are widely dispersed throughout eastern Australia and in relatively low densities. Only
    two wetlands in the EAWS held more than 5,000 waterbirds. There is some concentration of game ducks in southern and
    central NSW and central Queensland.

•   Waterbird abundance, breeding index, breeding species richness and habitat availability are showing continuing long-term
    declines throughout eastern Australia. Five of the eight game duck species are showing long-term declines.

•   Most of eastern Australia is predicted to receive above average rainfall over the January to March period. As a consequence,
    median or high streamflows are predicted for November – January at most locations which poses an increased risk of
    flooding, which would benefit waterbirds.

                                                                                                                                    43
References
▪ Bureau of Meteorology - www.bom.gov.au
▪ Jenouvrier S. (2013) Impacts of climate change on avian populations. Glob Change Biol, 19: 2036-2057.
doi:10.1111/gcb.12195
▪ Kingsford R. T. and Norman F. I. (2002) Australian waterbirds—products of the continent's ecology, Emu -
Austral Ornithology, 102:1, 47 69, DOI: 10.1071/MU01030
▪ Kingsford RT, Bino G, Porter JL. (2017) Continental impacts of water development on waterbirds,
contrasting two Australian river basins: Global implications for sustainable water use. Glob Change Biol.
2017; 00:1–12. https://doi.org/10.1111/gcb.13743
▪ Moloney, P.D. and Flesch, J.S. (2021) Estimate of duck and Stubble Quail harvest in Victoria for 2021:
results from surveys of Victorian Game Licence holders in 2021. Unpublished Client Report for the Game
Management Authority. Arthur Rylah Institute for Environmental Research, Department of Environment,
Land, Water and Planning, Heidelberg, Victoria.
▪ NSW Department of Primary Industries (2021) 2021-2022 Annual Waterfowl Quota Report to DPI Hunting,
NSW Department of Primary Industries.
▪ Porter J.L., Kingsford R.T., Francis, R., and Brandis K. (2021) Aerial Survey of Wetland Birds in Eastern
Australia - October 2021 Annual Summary Report, University of New South Wales 2021.
▪ Ramsey, D. and Fanson, B. (2021) Preliminary results from 2021 survey of game ducks in Victoria, Arthur
Rylah Institute for Environmental research, Department of Environment, Land, Water and Planning.
▪ The Long Paddock- www.longpaddock.qld.gov.au
44You can also read