Comparative diets of sympatric batoid elasmobranchs in the Gulf of Oman - Inter Research
←
→
Page content transcription
If your browser does not render page correctly, please read the page content below

Vol. 27: 35–41, 2018                        AQUATIC BIOLOGY
                                                                                                   Published May 3
 https://doi.org/10.3354/ab00694                     Aquat Biol

                                                                                                   OPEN
                                                                                                   ACCESS

                Comparative diets of sympatric batoid
                 elasmobranchs in the Gulf of Oman
                      Ali Reza Rastgoo1, Joan Navarro2,*, Tooraj Valinassab3
 1
 Persian Gulf and Oman Sea Ecological Center, Iranian Fisheries Science Research Institute (IFSRI), Agricultural Research,
                           Education and Extension Organization (AREEO), Bandar Abbas, Iran
           2
            Instituto de Ciències del Mar - CSIC, Passeig Marítim de la Barceloneta 37, 08003 Barcelona, Spain
   3
    Iranian Fisheries Science Research Institute (IFSRI), Agricultural Research, Education and Extension Organization,
                                             PO Box: 14155-6116, Tehran, Iran

      ABSTRACT: Documenting the interactions and mechanisms of coexistence among predators is
      important for understanding their ecological roles in food webs. Here, we examined the diet and
      trophic relationships of 6 demersal batoids coexisting in the Gulf of Oman by analyzing stomach
      contents. There were significant differences in diets among the batoid species, suggesting differ-
      ential preferences. Diets of Gymnura poecilura and Torpedo sinuspersici were similar and con-
      sisted mostly of teleost fishes. In contrast, Brevitrygon walga and Rhinobatos punctifer mostly ate
      crustaceans. The diets of Maculabatis randalli and Pastinachus sephen were diverse and included
      crustaceans, teleosts, polychaetes, bivalves and echinoderms. The differences in diet among these
      batoids may be related to morphological differences in feeding structures and to differences in
      behavior, which could explain their diversity and coexistence in the Gulf of Oman.

      KEY WORDS: Elasmobranch · Foraging ecology · Diet · Gulf of Oman

                   INTRODUCTION                                placed (Pianka 2000). Nonetheless, closely related
                                                               species do sometimes live together. Partitioning of
  Knowledge about the diets of marine predators is             food resources has been proposed as one of the main
pivotal to understanding the potential for intra- and          mechanisms explaining the coexistence of closely
inter-specific differences in habitat use (e.g. Papasta-       related elasmobranchs (e.g. Heithaus et al. 2013,
matiou et al. 2006, Barría et al. 2015, Navia et al.           Albo-Puigserver et al. 2015), owing to differences in
2017). Among marine predators, some sharks and                 prey or micro-habitats (e.g. Platell et al. 1998, Papas-
batoids can be important top predators (i.e. meso-             tamatiou et al. 2006).
predators) in marine ecosystems (Cortés 1999, Barría             There has been relatively little research on elasmo-
et al. 2015, Navia et al. 2017). Though there have             branchs of the Gulf of Oman, in the northwestern
been several studies on elasmobranchs in recent                Indian Ocean, despite the diversity of species there
decades (Field et al. 2009, Navia et al. 2017), few            (e.g. Valinassab et al. 2006, Jabado et al. 2017, Rast-
have focused on interactions among sympatric spe-              goo & Navarro 2017). Indeed, 82 species of sharks
cies, an important element for understanding how               and more than 20 species of batoids have been de-
species that appear to be ecologically similar might           scribed for the Gulf of Oman and nearby areas
coexist (e.g. Albo-Puigserver et al. 2015, Barría et al.       (Almojil et al. 2015), though several species appear to
2015, Navia et al. 2017). The principle of competitive         be declining, evidently from degradation and dis-
exclusion predicts that predators that occupy similar          appearance of habitats or the direct impacts of fish-
niches will diverge ecologically or perhaps be dis-            ing (Valinassab et al. 2006, Jabado et al. 2017). An
                                                               © The authors 2018. Open Access under Creative Commons by
*Corresponding author: joan@icm.csic.es                        Attribution Licence. Use, distribution and reproduction are un-
                                                               restricted. Authors and original publication must be credited.
                                                               Publisher: Inter-Research · www.int-res.com
36                                            Aquat Biol 27: 35–41, 2018

understanding of diet of the various species is impor-                     MATERIALS AND METHODS
tant for determining whether differential vitality of
elasmobranchs in the Gulf of Oman might be due to                     Study area and sampling procedure
natural changes in ecosystems or is perhaps owing to
human activities.                                              We conducted the study in Iranian waters of the
  In this study, we analyzed the stomach contents of         Gulf of Oman (Fig. 1), a marginal sea with an area of
6 demersal species of batoid elasmobranchs (Gym-             94 000 km2 that lies between the Arabian Sea and the
nura poecilura, Brevitrygon walga, Maculabatis ran-          Persian Gulf. It is a relatively deep body of water with
dalli, Pastinachus sephen, Rhinobatos punctifer, Tor-        a narrow continental shelf. About 3⁄4 of the Gulf is
pedo sinuspersici) that live in the Gulf of Oman to          deeper than 1000 m (Reynolds 1993). It is highly pro-
characterize their diets, which are poorly known, in         ductive owing to the combined effects of monsoons,
an area of sympatry such as the Gulf of Oman. Our            seasonal upwelling, and cold water intrusion from
goal was to use data on comparative diets to begin to        the Arabian Sea (Reynolds 1993). Although the dem-
understand what might allow these species to coexist         ersal topography is flat and dominated by soft sedi-
and, apparently, thrive.                                     ments, the northern coastline of the Gulf of Oman is

Fig. 1. Study area and sampling locations where (A) Gymnura poecilura, (B) Brevitrygon walga, (C) Maculabatis randalli,
(D) Pastinachus sephen, (E) Rhinobatos punctifer, and (F) Torpedo sinuspersici were collected in the Gulf of Oman and
                                                    Strait of Hormuz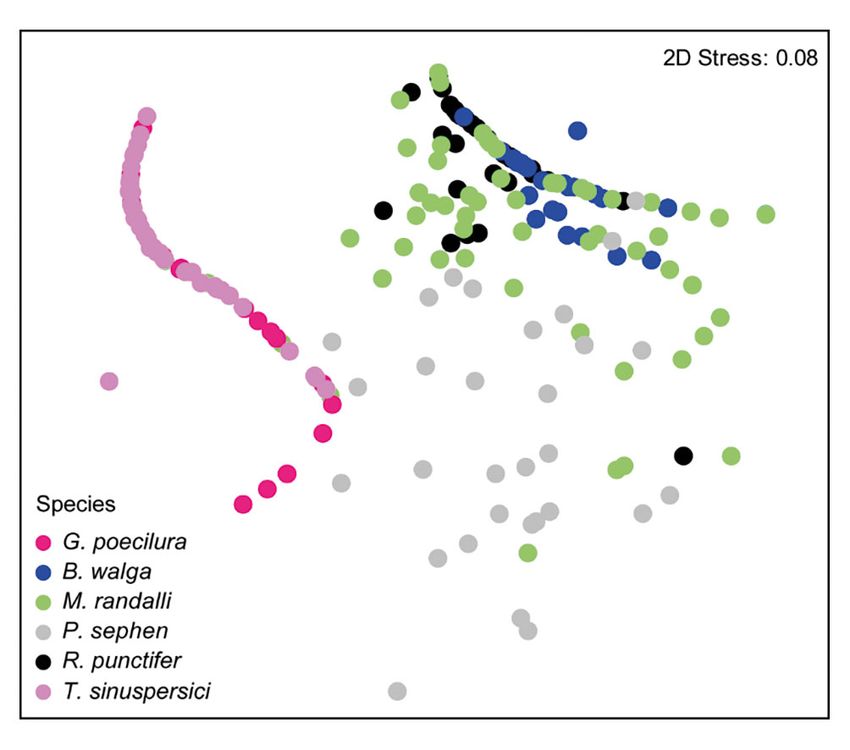
Rastgoo et al.: Sympatric batoid diet comparison                                37

highly irregular with diverse habitats, including              All calculations were based on the number of non-
rocky shores, estuaries, and mangroves.                      empty stomachs. IRI values were expressed as a per-
  We obtained specimens of the 6 species of batoid           centage to allow comparisons between prey groups
elasmobranchs (see Table 1) as bycatch from com-             and species (Cortés 1997):
mercial bottom trawlers and during 2 bottom-trawling
                                                                            %IRIi = 100 × IRIi 冫Σ in=1 IRIi        (2)
cruises (with the R/V ‘Ferdows-1’) from May through
December 2014 (see Table S1 in the Supplement at               We also estimated the diet diversity for each batoid
www.int-res.com/articles/suppl/b027p035_supp.pdf             species using the Shannon-Wiener diversity index
for sampling days by species). The mesh size of the          (H) (Ludwig & Reynolds 1988) as:
cod end net was 80 mm and the headline net mesh
                                                                                H = –Σ in=1 pi ln × pi             (3)
was 72 mm. Batoids were collected from bottom
depths between 10 and 110 m during 256 hauls                 where pi is the proportion of prey group i in the diet.
(Fig. 1). The duration of each haul varied from 60 to           We graphically described the diets for each species
90 min, depending on the sampling station. Speci-            by plotting the prey-specific quantity of the prey
mens were identified onboard the ships, and the sex,         groups against %FO (Amundsen et al. 1996). Prey-
body weight (nearest 10 g), disk width (for Gymnura          specific abundance was estimated as the number of
poecilura, Brevitrygon walga, Maculabatis randalli           prey i divided by the total number of prey in the
and Pastinachus sephen) and the total body length            stomachs that included prey i, expressed as a per-
(for Rhinobatos punctifer and Torpedo sinuspersici)          centage. The vertical axis suggests either specializa-
were recorded.                                               tion or generalization of the predator; points located
                                                             in the upper part of the graph suggest specialization,
                                                             whereas points in the lower part indicate that those
              Stomach content analyses                       prey were eaten less often.
                                                                We categorically estimated the trophic level (TL)
  We weighed the stomachs and then recovered                 that each batoid preyed upon using %W with
the stomach contents of the batoids during dissec-           TrophLab software (Pauly et al. 2000). TrophLab esti-
tions in the laboratory. All prey parts recovered            mates TL considering the diet composition and the
were separated, identified to the lowest possible            trophic level of the different prey present in the diet,
taxon, counted, and weighed to the nearest 0.1 g.            according to %W (Pauly et al. 2000) as:
The number of individuals of each prey type was
                                                                              TLj = 1 + Σ G
                                                                                          i
                                                                                            TLi × DCij             (4)
determined as the least number that these frag-
ments could have originated from, to avoid overes-           where TLi is the fractional trophic level of prey i, DCij
timation of the occurrence of a particular prey              represents the fraction of i in the diet of consumer j
item. We combined data from the stomach contents             and G is the number of prey categories. The trophic
into 7 functional groups (teleosts, crustaceans, poly-       level of each prey category was extracted from the
chaetes, cephalopods, gastropods, bivalves, and              FishBase dataset (Froese & Pauly 2000).
echinoderms) and calculated the vacuity index                  In order to examine effect of sample size in estimat-
for each batoid species as the percentage of empty           ing the diet of the batoid species, we constructed
stomachs (Hyslop 1980).                                      cumulative prey curves (Ferry & Caillet 1996) using
  We used the combined index of relative impor-              the Shannon-Wiener method to evaluate if the num-
tance (IRI; Pinkas et al. 1971) to estimate the relative     ber of sampled stomachs was enough to describe the
importance of each prey group in the diet of each            diversity of the diet of each batoid species. We ran-
batoid species and to allow interspecific comparison         domized the samples 50 times with the computer rou-
as:                                                          tine ‘sample-based rarefaction’ using EstimateS v.9.1
                                                             software (Colwell 2013). We considered sample size
                IRIi = (Ni + Wi) × FOi               (1)
                                                             to be sufficient if the curves visually reached an
where FOi is the frequency of occurrence of a par-           asymptote (Magurran 2004).
ticular functional prey group (i) in relation to the
total number of stomachs, Ni is the contribution by
number of a type of prey group i in relation to the                             Statistical analysis
whole content of the stomach, and Wi is the weight
of a prey group i in relation to the entire contents of        We tested for differences among the 6 batoids in
the stomach.                                                 their stomach contents (based on %W ) with the semi-
38                                                 Aquat Biol 27: 35–41, 2018

parametric permutation multivariate analyses of                   sample sizes were adequate to suggest their trophic
variance (PERMANOVA) tests on the Bray-Curtis                     habits for all species but G. poecilura (Fig. 2).
distance matrix. PERMANOVA allows for the analy-                    We found 7 prey types (teleosts, crustaceans, ce-
sis of complex designs (multiple factors and their                phalopods, bivalves, gastropods, and echinoderms)
interaction) without the constraints of multivariate              among the 6 batoids. A total of 10 lower taxa groups
normality, homoscedasticity, and when there are a                 occurred in the teleost group, 5 in the crustacean
greater number of variables than in traditional                   group, and 2 in the echinoderm group (Tables 1 &
ANOVA tests. The method calculates a pseudo-F                     S2). Based on the %W, diet differed among the
statistic analogous to the traditional F-statistic for            6 batoid species (PERMANOVA tests; pseudo-F =
multifactorial univariate ANOVA models, using per-                45.67, p < 0.0001; Table 1). Although we found
mutation procedures to obtain p-values for each                   marginal overlaps among several species by nMDS
term in the model. When results were significant,                 analysis (Fig. 3), pairwise tests revealed that diet dif-
we conducted pairwise tests. We evaluated similari-               fered among all batoids species (Table 2). Specifi-
ties in diets using the Bray-Curtis similarity coeffi-            cally, we found that the diet of 2 batoids (G. poecilura
cient and then applied non-metric multidimensional                and T. sinuspersici) consisted mostly of teleosts
scaling (nMDS) analysis. All statistical tests were               (Table 1, Figs. 3 & 4), showing low diet diversity and
performed using PRIMER v.6 software (Clarke &                     high TL values (Table 1). In contrast, the diets of B.
Gorley 2006).                                                     walga and R. punctifer contained mostly crustaceans
                                                                  (Table 1, Figs. 3 & 4), also with a low diet diversity
                                                                  (Table 1). The diets of Maculabatis randalli and P.
                         RESULTS                                  sephen were more diverse (Table 1). The diet of P.
                                                                  sephen included bivalves, followed by echinoderms
  We examined 424 stomachs of batoids. About                      and then polychaetes, whereas the diet of M. randalli
68.9% of Gymnura poecilura, 12.5% of Brevitrygon                  included crustaceans, followed by polychaetes and
walga, 16.2% of Maculabatis randalli, 23.9% of Pas-               teleosts (Table 1, Figs. 3 & 4).
tinachus sephen, 13.1% of Rhinobatos punctifer and                  Teleosts appeared to be important prey for G. poe-
53.7% of Torpedo sinuspersici were empty (Table 1                 cilura and T. sinuspersici. In contrast, B. walga and R.
and Table S2 in the Supplement). The cumulative                   punctifer mostly ate crustaceans (Fig. 4), whereas the
prey curves based on diversity of prey indicated that             diets of M. randalli and P. sephen were broader (Fig. 4).

Table 1. General information and diet composition (standardized index of relative importance, IRI) of 6 batoid species from
the Gulf of Oman. N: sample size; V: vacuity index; H: Shannon-Wiener diversity in number. See Table S2 in the Supplement
for more accurate diet description. Disc width is reported for G. poecilura, B. walga, M. randalli, and P. sephen and total body
                                           length for R. punctifer and T. sinuspersici

                         Gymnura          Brevitrygon      Maculabatis          Pastinachus     Rhinobatos         Torpedo
                         poecilura          walga           randalli              sephen         punctifer       sinuspersici

 N                           58               72                80                  39               69              108
 Weight (g)
  mean ± SD            3785.6 ± 2859     401.9 ± 122.4   3071.2 ± 3228.3    3771.5 ± 2332.4    884.4 ± 496.0   1407.1 ± 786.1
 Weight (g)
  min. − max.            310−12370         140−750          110−16170           470−12080        160−1940         340−3820
 Length (cm)
  mean ± SD              68.6 ± 19.7       22.0 ± 2.2       40.6 ± 15.1          45.1 ± 9.8      60.1 ± 11.0      40.4 ± 6.8
 Length (cm)
  min. − max             33.5−107.5        15.2−27.5          18−80               24−71            38−80          27.5−56.1
 V (%)                      68.9              12.5             16.2                23.9             13.1             53.7
 Trophic level               4.5              3.5               3.7                3.2              3.6               4.5
 H                            0               0.28             0.93                1.54             0.25              0.1
 Teleosts                    100               0               7.16                6.94             0.43            99.96
 Crustaceans                  0              98.70            80.67               10.56            99.34               0
 Cephalopods                  0                 0              0.01                  0                0              0.04
 Bivalves                     0                0               1.69               31.55               0                0
 Echinoderms                  0                0               0.02               24.65              0                 0
 Gastropods                   0               0.02             0.02                0.77              0                 0
 Polychaetes                  0               1.28            10.42               25.52             0.23               0
Rastgoo et al.: Sympatric batoid diet comparison 39
capture, we suggest that it can still pro-
vide general baseline information, par-
ticularly for species whose diets are not
well known (Barría et al. 2015). We also
maintain that the data we collected pro-
vide useful information about the main
trophic levels at which all the batoids
except Gymnura poecilura forage (Cortés
1999), and that this information en-
hances our knowledge about the forag-
ing of batoids in the Gulf of Oman.
Our results reveal that there are dif-
ferences among the 6 batoid species
with respect to the habitats that they
feed in. The stomach contents of G. poe-
cilura included mostly teleosts, similar
to other Gymnura spp. (Jacobsen et al.
2009, Yokota et al. 2013, Barría et al.
2015, Yemişken et al. 2018). Teleosts
were also the most common prey in the
diet of Torpedo sinuspersici, consistent
with previous studies conducted on
Fig. 2. Cumulative average (solid line) and standard deviation of Shannon-
Wiener diversity index for samples of studied batoid species in the Gulf of other Torpedo species conducted in
Oman: (A) Gymnura poecilura, (B) Brevitrygon walga, (C) Maculabatis other areas (Bray & Hixon 1978, Barría
randalli, (D) Pastinachus sephen, (E) Rhinobatos punctifer, and (F) Torpedo et al. 2015, Espinoza et al. 2015). On the
sinuspersici other hand, the diet of Rhinobatos punc-
tifer consisted mostly of crustaceans,
DISCUSSION especially shrimp species. Similar results have been
reported in other guitarfish species (Harris et al. 1988,
In this study, we presented new information on the Blanco-Parra et al. 2012, Navarro-González et al.
seasonal diets of 6 demersal batoid species that co- 2012, Espinoza et al. 2013, Lara-Mendoza et al. 2015).
occur in the northern Gulf of Oman. Though the use of Brevitrygon walga, Maculabatis randalli, and Pasti-
stomach contents to describe diets is limited to indica- nachus sephen preyed on epibenthic organisms like
ting what individuals ate within a few days before crustaceans, polychaetes, bivalves, and echinoderms,
Table 2. ANOSIM pairwise tests to compare the diet of
6 batoid species from the Gulf of Oman
Species × Species R p
G. poecilura × B. walga 0.995 0.001
G. poecilura × M. randalli 0.641 0.001
G. poecilura × P. sephen 0.661 0.001
G. poecilura × R. punctifer 0.869 0.001
G. poecilura × T. sinuspersici 0.391 0.001
B. walga × M. randalli 0.083 0.001
B. walga × P. sephen 0.671 0.001
B. walga × R. punctifer 0.192 0.001
B. walga × T. sinuspersici 0.970 0.001
M. randalli × P. sephen 0.400 0.001
M. randalli × R. punctifer 0.084 0.001
M. randalli × T. sinuspersici 0.765 0.001
P. sephen × R. punctifer 0.675 0.001
Fig. 3. Non-metric multidimensional scaling (nMDS) analy- P. sephen × T. sinuspersici 0.884 0.001
sis of the stomach contents of 6 batoids (see Fig. 2 for full R. punctifer × T. sinuspersici 0.927 0.001
species names) sampled in the Gulf of Oman40 Aquat Biol 27: 35–41, 2018
Acknowledgements. We thank the Iran Fish-
eries Science Research Institute (IFSRI) for
supporting this study, the captain and crew of
RV ‘Ferdows-1’ for help with sampling, and
Sarah Young for improving the English
grammar. Finally, we thank the 2 anonymous
reviewers and the responsible editor of this
paper for their excellent suggestions. J.N. was
supported by the Spanish National Program
Ramón y Cajal.
LITERATURE CITED
Albo-Puigserver M, Navarro J, Coll M,
Aguzzi J, Cardona L, Sáez-Liante R (2015)
Feeding ecology and trophic position of
three sympatric demersal chondrichthyans
in the northwestern Mediterranean. Mar
Ecol Prog Ser 524:255−268
Almojil DK, Moore ABM, White WT (2015)
Sharks and rays of the Arabian/Persian
Gulf. MBG (INT), London
Amundsen PA, Gabler HM, Staldvik F (1996)
A new approach to graphical analysis of
feeding strategy from stomach contents
data-modification of the Costello (1990)
method. J Fish Biol 48:607−614
Barría C, Coll M, Navarro J (2015) Unravel-
ling the ecological role and trophic rela-
Fig. 4. Graphical representation of the feeding strategy of Gymnura poecil- tionships of uncommon and threatened
ura, Brevitrygon walga, Maculabatis randalli, Pastinachus sephen, Rhino- elasmobranchs in the western Mediterran-
batos punctifer, and Torpedo sinuspersici based on the method proposed by ean Sea. Mar Ecol Prog Ser 539:225−240
Amundsen et al. (1996). An explanatory diagram for interpretation of feed- Blanco-Parra MP, Galván-Magaña F, Már-
ing strategy and prey importance from the proposed method appears in (A) quez-Farías JF, Niño-Torres CA (2012)
Feeding ecology and trophic level of the
banded guitarfish, Zapteryx exasperata,
as previously reported for other dasyatids (Jacobsen & inferred from stable isotopes and stomach contents
Bennett 2012, O’Shea et al. 2013), suggesting that analysis. Environ Biol Fishes 95:65−77
Bray RN, Hixon MA (1978) Night-shocker: predator behavior
those groups are the most important prey for this
of the Pacific electric ray (Torpedo californica). Science
family. 200:333−334
Our results also showed that the stomachs of G. Clarke KR, Gorley RN (2006) PRIMER v6: user manual/
poecilura and T. sinuspersici were mostly empty tutorial. PRIMER-E, Plymouth
when collected, which suggests that they had not Colwell RK (2013) EstimateS: statistical estimation of species
richness and shared species from samples, version 9.
eaten for one to several days (Vaudo & Heithaus User’s guide and application. http://purl.oclc.org/estimates
2011b). The stomachs of some marine predators, like (accessed 15 January 2018)
elasmobranchs, are often found to be empty or con- Cortés E (1997) A critical review of methods of studying fish
tain highly digested prey remains that are difficult to feeding based on analysis of stomach contents: applica-
tion to elasmobranch fishes. Can J Fish Aquat Sci 54:
identify (e.g. Jacobsen et al. 2009, Yokota et al. 2013).
726−738
In conclusion, we found that the diets of 6 batoid Cortés E (1999) Standardized diet compositions and trophic
elasmobranchs in the Gulf of Oman differed during levels of sharks. ICES J Mar Sci 56:707−717
the sampling period. We cannot yet judge whether Espinoza M, Clarke TM, Villalobos-Rojas F, Wehrtmann IS
(2013) Diet composition and diel feeding behaviour of
those differences were due to differences in the sea-
the banded guitarfish Zapteryx xyster along the pacific
sonal timing of capture or differences in the areas coast of Costa Rica, Central America. J Fish Biol 82:
where they were captured. We recommend more 286−305
intensive systematic sampling and observation of Espinoza M, Munroe SEM, Clarke TM, Fisk AT, Wehrtmann
batoid elasmobranchs in the Gulf of Oman to address IS (2015) Feeding ecology of common demersal elasmo-
branch species in the Pacific coast of Costa Rica inferred
these questions and to help develop adequate con- from stable isotope and stomach content analyses. J Exp
servation and management plans for the commercial Mar Biol Ecol 470:12−25
fisheries that operate there. Ferry L, Caillet G (1996) Sample size and data analysis: AreRastgoo et al.: Sympatric batoid diet comparison 41 we characterizing and comparing diet properly? In: Navia AF, Mejía-Falla PA, López-García J, Giraldo A, Cruz- MacKinlay D, Shearer K (eds) Feeding ecology and Escalona VH (2017) How many trophic roles can elasmo- nutrition in fish: symposium proceedings. International branchs play in a marine tropical network? Mar Freshw congress on the biology of fishes, 14−18 July 1996, San Res 68:1342−1353 Francisco. American Fisheries Society, Bethesda, MD, O’Shea OR, Thums M, van Keulen M, Kempster RM, p 71−80 Meekan MG (2013) Dietary partitioning by five sympatric Field IC, Meekan MG, Buckworth RC, Bradshaw CJ (2009) species of stingray (Dasyatidae) on coral reefs. J Fish Biol Susceptibility of sharks, rays and chimaeras to global 82:1805−1820 extinction. Adv Mar Biol 56:275−363 Papastamatiou YP, Wetherbee BM, Lowe CG, Crow GL Froese R, Pauly D (eds) (2000) FishBase 2000: concepts, (2006) Distribution and diet of four species of car- design and data sources. ICLARM, Los Banos charhinid shark in the Hawaiian Islands: evidence for re- Harris SA, Bennett BA, Branch GM (1988) An assessment of source partitioning and competitive exclusion. Mar Ecol the role of the sand shark Rhinobatos annulatus as a Prog Ser 320:239−251 predator in Langebaan Lagoon. Afr J Mar Sci 7:153−159 Pauly D, Froese R, Sa-a PS, Palomares MLD, Christensen V, Heithaus MR, Vaudo JJ, Kreicker S, Layman CA and others Rius J (2000) TropLab Manual. ICLARM, Manila (2013) Apparent resource partitioning and trophic struc- Pianka ER (2000) Evolutionary ecology. Addison Wesley, ture of large-bodied marine predators in a relatively pris- San Francisco, CA tine seagrass ecosystem. Mar Ecol Prog Ser 481:225−237 Pinkas L, Oliphant MS, Inverson ILK (1971) Food habits of Hyslop EJ (1980) Stomach contents analysis — a review of albacore, bluefin tuna and bonito in California waters. methods and their application. J Fish Biol 17:411−429 Fish Bull 152:1−105 Jabado RW, Kyne PM, Pollom RA, Ebert DA, Simpfendorfer Platell M, Potter I, Clarke K (1998) Resource partitioning by CA, Ralph GM, Dulvy NK (2017) The conservation status four species of elasmobranchs (Batoidea: Urolophidae) of sharks, rays, and chimaeras in the Arabian Sea and in coastal waters of temperate Australia. Mar Biol 131: adjacent waters. Environment Agency, Abu Dhabi and 719−734 IUCN Species Survival Commission Shark Specialist Rastgoo AR, Navarro J (2017) Trophic levels of teleost and Group, Vancouver elasmobranch species in the Persian Gulf and Oman Sea. Jacobsen IP, Bennett MB (2012) Feeding ecology and dietary J Appl Ichthyol 33:403−408 comparisons among three sympatric Neotrygon (Mylio- Reynolds RM (1993) Physical oceanography of the Gulf, batoidei: Dasyatidae) species. J Fish Biol 80:1580−1594 Strait of Hormuz, and the Gulf of Oman: results from the Jacobsen IP, Johnson JW, Bennett MB (2009) Diet and repro- Mitchell Expedition. Mar Pollut Bull 27:35−60 duction in the Australian butterfly ray Gymnura australis Valinassab T, Daryanabard R, Dehghani R, Pierce GJ (2006) from northern and north-eastern Australia. J Fish Biol 75: Abundance of demersal fish resources in the Persian 2475−2489 Gulf and Oman Sea. J Mar Biol Assoc UK 86:1455−1462 Lara-Mendoza RE, Márquez-Farías JF, Román-Reyes JC Vaudo JJ, Heithaus MR (2011b) High-trophic-level con- (2015) Feeding habits of the speckled guitarfish Rhino- sumers: elasmobranchs. In: Wilson JG, Luczkovich JJ batos glaucostigma (Elasmobranchii: Rhinobatidae). J Fish (eds) Treatise on estuarine and coastal science, Vol 6. Biol 87:311−322 Academic Press, London, p 203−225 Ludwig JA, Reynolds JF (1988) Statistical ecology: a primer Yemişken E, Forero M, Megalofonou P, Eryilmaz L, Navarro on methods and computing. John Wiley & Sons, New J (2018) Feeding habits of three batoids in the Levantine York, NY Sea (north-eastern Mediterranean Sea) based on stom- Magurran AE (2004) Measuring biological diversity. Black- ach content and isotopic data. J Mar Biol Assoc UK well Publishing, Oxford 98(Spec Issue 1):89−96 Navarro-González JA, Bohórquez-Herrera J, Navia AF, Yokota L, Goitein R, Gianeti M, Lessa R (2013) Diet and Cruz-Escalona VH (2012) Diet composition of batoids on feeding strategy of smooth butterfly ray Gymnura the continental shelf off Nayarit and Sinaloa, Mexico. micrura in northeastern Brazil. J Appl Ichthyol 29: Cienc Mar 38:347−362 1325−1329 Editorial responsibility: Brent Stewart, Submitted: November 3, 2017; Accepted: March 11, 2018 San Diego, California, USA Proofs received from author(s): April 24, 2018
You can also read