COMPANY PRESENTATION INFRASTRUCTURE DAY - SEPTEMBER 9TH 2020 - Bologna-airport.it

Page created by Kyle Tucker
 
CONTINUE READING
COMPANY PRESENTATION INFRASTRUCTURE DAY - SEPTEMBER 9TH 2020 - Bologna-airport.it
COMPANY PRESENTATION
  INFRASTRUCTURE DAY - SEPTEMBER 9TH 2020
COMPANY PRESENTATION INFRASTRUCTURE DAY - SEPTEMBER 9TH 2020 - Bologna-airport.it
2

    AEROPORTO MARCONI DI BOLOGNA S.p.A.
COMPANY PRESENTATION INFRASTRUCTURE DAY - SEPTEMBER 9TH 2020 - Bologna-airport.it
HIGHLIGHTS
& STRATGEY

     H1 2020
    RESULTS

        2020
KEY UPDATES
               GROUP HIGHLIGHTS
               & STRATEGY

    3

                         AEROPORTO G. MARCONI DI BOLOGNA S.p.A.
COMPANY PRESENTATION INFRASTRUCTURE DAY - SEPTEMBER 9TH 2020 - Bologna-airport.it
BOLOGNA’S AIRPORT MAIN CHARACTERISTICS

                    9.4 MILLION PAX IN 2019 - 79.2% INTERNATIONAL PAX
HIGHLIGHTS
& STRATGEY

     H1 2020
    RESULTS        ITALY'S FORTH AIRPORT FOR GLOBAL CONNECTIVITY
                   ICCSAI - Fact Book 2019
        2020
KEY UPDATES

                   CENTRAL GEOGRAPHICAL LOCATION

                   HIGH STANDARD OF LIVING

                   STRONG ENTREPRENEURIAL SPIRIT

    4
                                                                AEROPORTO G. MARCONI DI BOLOGNA S.p.A.
COMPANY PRESENTATION INFRASTRUCTURE DAY - SEPTEMBER 9TH 2020 - Bologna-airport.it
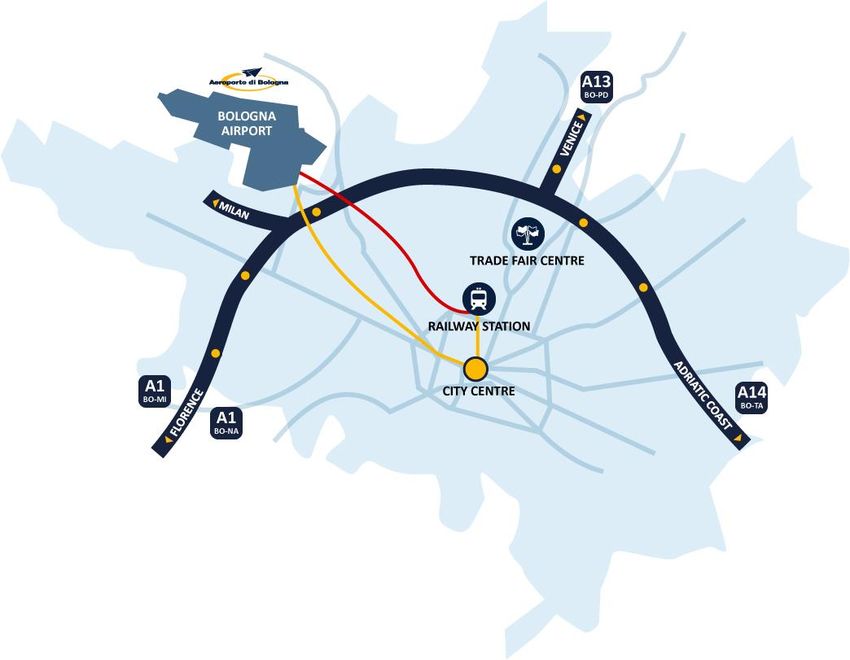
GROWTH OUTPACING ITALIAN AND EU AVERAGE

                              2009 – 2019                      +7.0%
                                CAGR                              (1)

                                                                                              +4.0%                      +4.3%
HIGHLIGHTS                                                                                                                  (2)
                                                                                                (1)
& STRATGEY

     H1 2020
    RESULTS                                                     AdB                           Italy                       EU

        2020
KEY UPDATES

                               15.3%
               13.3%
                                                                                                                                  11.5%
                                                                                                                                                                         10.6%

                                     7.0% 6.8%                                                                                               6.7%
                                                      6.4%                                       6.2%                                               6.4%          5.9%
                                                                                                       4.5%     4.7% 4.5%             4.6%
                                                                                 4.0%                                                                      3.8%              4.0%

                                                                1.2%

                                                                        (1.3%)
                    (2.3%)                                                           (1.9%)

                  2009            2010             2011            2012            2013               2014        2015              2016       2017          2018          2019

                                                                                        BLQ           Italian Average
    5
               1 Assaeroporti – including charter, general aviation and interlining: years 2009-2019
               2 EU figures refer to western European Airports. Data, ACI Europe - Airport Traffic Reports                                    AEROPORTO G. MARCONI DI BOLOGNA S.p.A.
COMPANY PRESENTATION INFRASTRUCTURE DAY - SEPTEMBER 9TH 2020 - Bologna-airport.it
EBITDA AND NET PROFIT TREND 2014-2019

               € 55.000.000,0                                                                                                              € 5,0
                                                                                                                              4.7
                                                                                                        4.5
                                                                                                                                           € 4,5
                                                                                        4.1                                44.1
HIGHLIGHTS     € 45.000.000,0
& STRATGEY                                                                                                                                 € 4,0
                                                                  3.6
                                                                                                      38.0
     H1 2020                                       3.4
                                                                                                                                           € 3,5
    RESULTS
               € 35.000.000,0
                                  3.2                                              33.9

                                                                                                                                           € 3,0
        2020                                                   27.9
KEY UPDATES
               € 25.000.000,0                   23.7                                                                                       € 2,5
                                21.1                                                                                              20.9
                                                                                                             17.9                          € 2,0
                                                                                          16.2
               € 15.000.000,0
                                                                      11.4                                                                 € 1,5

                                       7.0             7.1
                                                                                                                                           € 1,0
                € 5.000.000,0

                                                                                                                                           € 0,5

                                 2014             2015          2016                2017                2018                 2019
               -€ 5.000.000,0                                                                                                              € 0,0

                                       EBITDA conso adj (€M)          Net Profit (€M)            EBITDA conso adj/Pax (€)

    6
                                                                                                                    AEROPORTO G. MARCONI DI BOLOGNA S.p.A.
COMPANY PRESENTATION INFRASTRUCTURE DAY - SEPTEMBER 9TH 2020 - Bologna-airport.it
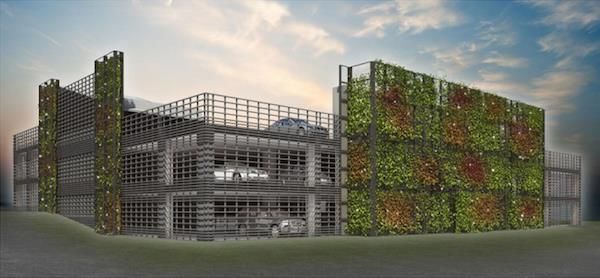
NETWORK: WELL BALANCED MIX OF NETWORK,
               REGIONAL AND LOW COST CARRIERS

               WORLD AND REGIONAL, BUSINESS AND LEISURE DESTINATIONS AT HAND

                     NETWORK CARRIERS           LOW COST AND REGIONAL CARRIERS

HIGHLIGHTS
& STRATGEY

     H1 2020
    RESULTS

        2020
KEY UPDATES

    7

                                                                  AEROPORTO G. MARCONI DI BOLOGNA S.p.A.
COMPANY PRESENTATION INFRASTRUCTURE DAY - SEPTEMBER 9TH 2020 - Bologna-airport.it
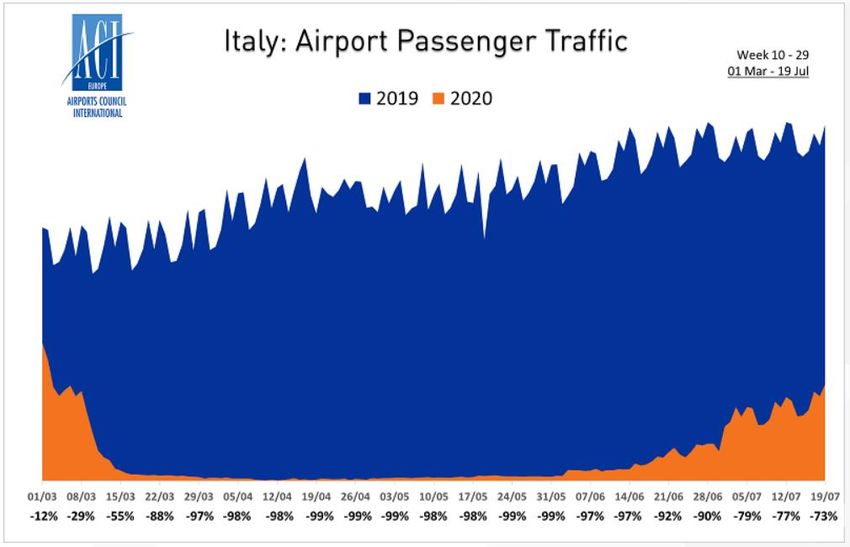
CATCHMENT AREA: BOLOGNA AIRPORT DEMAND ATTRACTS
                  PASSENGERS FROM 20 ITALIAN PROVINCES

                             HIGH SPEED

HIGHLIGHTS
& STRATGEY
               20           RAIL NETWORKS

               ITALIAN        BOLOGNA-FLORENCE
     H1 2020   PROVINCES               35 minutes
    RESULTS
                                     68 trains/day

        2020
KEY UPDATES                     BOLOGNA-VERONA

               10.9                    49 minutes
                                      7 trains/day

               MILLION             BOLOGNA-MILAN
               RESIDENTS                60 minutes
                                      40 trains/day

                                BOLOGNA-VENICE

               18%                  1 h 25 minutes
                                     24 trains/day
               OF TOTAL
               ITALIAN            BOLOGNA-ROME
               POPULATION            1 h 54 minutes
                                      65 trains/day

    8
                                                      AEROPORTO G. MARCONI DI BOLOGNA S.p.A.
COMPANY PRESENTATION INFRASTRUCTURE DAY - SEPTEMBER 9TH 2020 - Bologna-airport.it
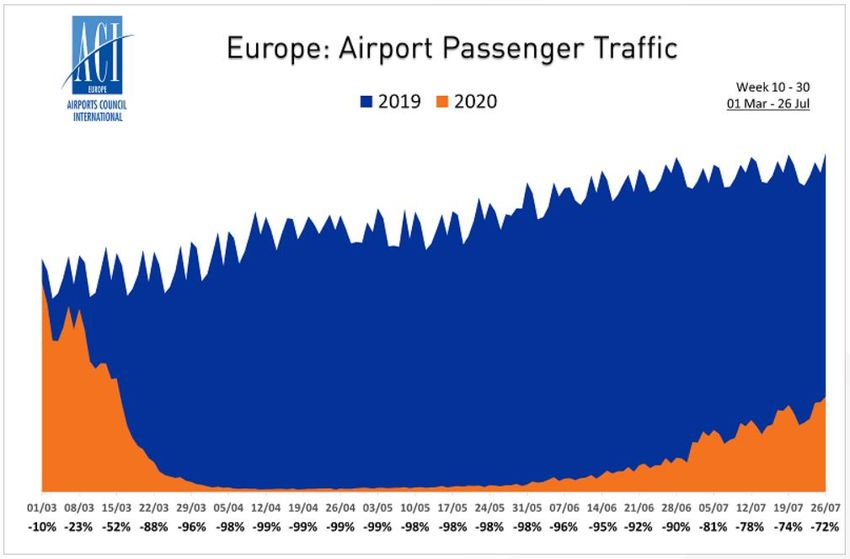
CATCHMENT AREA: HIGHER GDP AND WELL-KNOWN BRANDS

                                                   MAIN EUROPEAN FAIR CENTRES:
                        BOLOGNA HAS
                         HIGHER GDP                                        2nd HANNOVER
                       THAN ITALIAN AND                                    500,000 sqm

                          EUROPEAN
HIGHLIGHTS
& STRATGEY               COMPARABLE                                          3rd FRANKFURT
                            CITIES                                           475,000 sqm
     H1 2020
    RESULTS

                                                                                   1st MILAN
        2020
                                                                                   753,000 sqm
KEY UPDATES

                                                  6th MADRID            4th BOLOGNA
                                                  102,600 sqm           375,000 sqm

                            COMPANIES OPERATING IN KEY SECTORS

    9

                                                                 AEROPORTO G. MARCONI DI BOLOGNA S.p.A.
COMPANY PRESENTATION INFRASTRUCTURE DAY - SEPTEMBER 9TH 2020 - Bologna-airport.it
CATCHMENT AREA: BOLOGNA AIRPORT COMPETITIVE
                       POSITIONING IN 2019

                               Catchment area traffic increased by 4.5% (+1.6 ml passengers) vs 2018

                               Growth driven by both domestic (+1.0%) and international traffic (+5.5%)

HIGHLIGHTS
                               BLQ market share in the catchment area*: 25.4%
& STRATGEY

     H1 2020
    RESULTS
                                          BOLOGNA CATCHMENT AREA:
        2020                    VAR. % PASSENGERS FY 2019 vs FY 2018**
KEY UPDATES                                                                                                                                    TREVISO

                                                                                                                                      VERONA    VENICE
                   Rimini                                                                            28,3%
                                                                                                                            PARMA
                Bologna                                              10,6%
                                                                                                                                    BOLOGNA
                 Ancona                                          8,2%
                Florence                                    5,7%                                                                    FLORENCE        RIMINI

                 Verona                                    5,2%                                                                PISA
                                                                                                                                                         ANCONA
                  Venice                                3,4%
                     Pisa              -1,4%
                 Treviso             -1,6%
                  Parma        -5,1%

    10                                                                                                                      AEROPORTO G. MARCONI DI BOLOGNA S.p.A.
               * BLQ passengers/Catchment area airports passengers. BLQ catchment includes airports within
                  200 Km ca. maximum distance: Ancona, Florence, Rimini, Parma, Pisa, Treviso, Venice and Verona airports
               ** Assaeroporti data
OUR STRATEGIC AMBITION AND LONG TERM APPROACH

                                                               TO ENHANCE CONNECTIVITY AND CARE
                TO BE THE IDEAL GATEWAY FOR ITALY
                                                              FOR A UNIQUE PASSENGER EXPERIENCE

HIGHLIGHTS
& STRATGEY

     H1 2020
    RESULTS

        2020
KEY UPDATES

               The route development opportunities together        Bologna Airport to be recognized by
               with the ground transport network expansion     passengers as an ideal gateway thanks to
                could make Bologna Airport an ideal air to     its rich destination network, the ease of
               ground gateway not only for outgoing but        access from the wider region and the high
                   also for incoming passengers and               quality of its facilities and services
                               accessibility
    11

                                                                                  AEROPORTO G. MARCONI DI BOLOGNA S.p.A.
CLEAR AND WELL-DEFINED STRATEGY

                                               MAXIMISE FINANCIAL PERFORMANCE

HIGHLIGHTS
& STRATGEY      PERFORMING AND SUSTAINABLE CORPORATION
     H1 2020
    RESULTS

        2020
KEY UPDATES

                    CONNECT                           DEVELOP                   EXPERIENCE                                   CARE
                                                1.   Remove capacity
                                                     constraints               1.   Innovative and customer
               1.   Expand destination                                                                             1.   People and organization
                                                2.   Optimise existing              oriented airport
                    network and frequency                                                                               development
                                                     infrastructures           2.   Pleasant and stress free
               2.   Increase long haul route                                                                       2.   Engaged airport
                                                3.   Expand passenger               passenger processes
               3.   Expand catchment area                                                                               community
                                                     terminal                  3.   Best in class commercial
               4.   Improve accessibility       4.   Develop competitive car        offer
                                                     parking                   4.   Strong corporate image
                                                5.   Maximise commercial
                                                     opportunities

    12
                                                                                                               AEROPORTO G. MARCONI DI BOLOGNA S.p.A.
FIRST STEPS TOWARDS FUTURE DEVELOPMENT:
                      STRENGHTENING ACCESSIBILITY
                                                          Monorail connection
                                                          to Central Railway Station
                                                          Expected to Start in 2020
                                                          Running time: 7 minutes

HIGHLIGHTS
& STRATGEY

     H1 2020
    RESULTS

        2020
KEY UPDATES

                                     Bus connection
               City Centre - Central Railway Station
                                  Every 15 minutes
    13
                      Running time: 15/20 minutes
                                                          AEROPORTO G. MARCONI DI BOLOGNA S.p.A.
FIRST STEPS TOWARDS FUTURE DEVELOPMENT:
                TERMINAL EXPANSION PROJECT

HIGHLIGHTS
& STRATGEY

     H1 2020
    RESULTS

        2020
KEY UPDATES

                                          Departure area expansion on the 1st
                                          floor (+24,000 sqm) to:
               EXPANSION
                                                improve passengers flow

                                                increase commercial area and offer

                                                enhance customer experience

                                             Update: formal verification of terminal
                                          expansion final design completed in January
                                            2020. Final design waiting for ENAC’s
                                                           approval.

    14
                                                              AEROPORTO G. MARCONI DI BOLOGNA S.p.A.
FIRST STEPS TOWARDS FUTURE DEVELOPMENT: NEW
               MULTILEVEL PARKING

HIGHLIGHTS
& STRATGEY

     H1 2020
    RESULTS

        2020
KEY UPDATES

               New multilevel parking construction to increase on site parking spaces
                                    and meet passenger growth

                             Update: final design approved by ENAC

    15

                                                                       AEROPORTO G. MARCONI DI BOLOGNA S.p.A.
PROFITABILITY TREND

                                  Consolidated revenues (€/ml)                                          ADJ EBITDA* and ADJ EBITDA margin* (€/ml, %)

                                                                                  16.4                                                                             41%
                                                                                           50,00                                           39%
                                                       15.7                                                                                                                               40%
                                                                                                             37%
                             6.7                                                           40,00
                                                                                                                                                                                          35%
                                                              Rev. ex constr.
                                                               CAGR 8.4%                   30,00
HIGHLIGHTS                                                                                                                                                          44.1                  30%
                                                       98.4                      108.6     20,00                                           38.0
& STRATGEY                  92.4                                                                             33.9
                                                                                           10,00                                                                                          25%
     H1 2020
    RESULTS                                                                                  ,00                                                                                          20%
                          FY 2017                  FY 2018                      FY 2019                     FY 2017                       FY 2018                  FY 2019
                                   Revenue ex constr          Construction rev                                        ADJ EBITDA                              ADJ EBITDA %
        2020
KEY UPDATES

                                    Consolidated net income (€/ml)                                                Net Financial Position and Capex

                                                                                                                                         € 24.0 ml
                                                                                20.9               25
                                                                                                                                                                  € 19.4 ml
                                                                                                                                                                                    25,0

                                                                                                                                             4.5
                                                    17.9                                           20                                                               2.0             20,0
                           16.2                                                                             € 15.5 ml
                                                                                                   15           3.1                                                                 15,0
                                                                                                                                                                   10.5
                                                                                                   10
                                                                                                                                             8.0                                    10,0
                                                                                                                  10.1
                                                                                                   5                                                                                5,0
                                                                                                                  12.4                      19.5                   17.4
                                                                                                   0                                                                                0,0
                                                                                                                 FY 2017                   FY 2018                FY 2019
                         FY 2017                 FY 2018                    FY 2019                      Capex             Airport Infrastructure Provision       Net financial position

                                            Healthy growth, improving margins and solid capital
    16                                                           structure
               * Net of construction services margin (IFRIC 12) and one-off energy costs                                                       AEROPORTO G. MARCONI DI BOLOGNA S.p.A.
MAIN INVESTMENTS IN INFRASTRUCTURE MAINTENANCE
               AND DEVELOPMENT
                                                                                       TERMINAL EXPANSION AND
                                                                                      NEW MULTILEVEL CAR PARKING

                          INVESTMENTS IN INFRASTRUCTURE
                           MAINTENANCE AND DEVELOPMENT
HIGHLIGHTS
& STRATGEY

     H1 2020                         € 24.0 ml                                 25,0
    RESULTS

                                      4.5 ml                                            FORMAL VERIFICATION OF THE
        2020                                                      € 19.4 ml           TERMINAL EXPANSION FINAL DESIGN
                                                                               20,0
KEY UPDATES                                                                              COMPLETED IN JANUARY 2020.
                                                                     2.0 ml
               € 15.5 ml                                                         MULTILEVEL CAR PARKING FINAL DESIGN
                                                                               15,0       APPROVED BY ENAC
                3.1 ml

                                                                               10,0
                                      19.5 ml
                                                                    17.4 ml                  CARGO BUILDING
                12.4 ml
                                                                               5,0

                                                                               0,0
                FY 2017               FY 2018                        FY 2019

                  Capex                  Airport Infrastructure Provision

                                                                                             WORK IN PROGRESS
    17
                                                                                                 AEROPORTO G. MARCONI DI BOLOGNA S.p.A.
SOLID FINANCIAL AND CAPITAL STRUCTURE

                              2017 - 2019 CONSOLIDATED ASSET & FINANCIAL SITUATION (‘000 €)

                                                  Liquidity                             NFP
                                                                                                            10.501
                                                                   29.253    10.050

HIGHLIGHTS                                                                              7.995
& STRATGEY
                             16.209                   15.762
     H1 2020
    RESULTS

        2020
KEY UPDATES

                            FY 2017                  FY 2018       FY 2019   FY 2017   FY 2018             FY 2019

                                              Gross Debt (*)                           Equity
                             26.776                                                                        178.175

                                                      21.216
                                                                   19.253

                                                                                       173.710
                                                                             172.322

                            FY 2017                  FY 2018       FY 2019   FY 2017   FY 2018             FY 2019

    18
                                                                                                 AEROPORTO G. MARCONI DI BOLOGNA S.p.A.
               (*) Current and non current financial liabilities
MONITORING OF QUALITY SERVICES AND
                     PASSENGER EXPERIENCE
                             SERVICE QUALITY                            CUSTOMER SATISFACTION INDEX

HIGHLIGHTS
& STRATGEY                                                                          98.5%              98.3%
     H1 2020
    RESULTS                                                               97.0%

        2020
KEY UPDATES                                                              FY 2017   FY 2018            FY 2019

                                                                          AIRPORT SERVICE QUALITY
               Customer Satisfaction Index:
                   ENAC (Italian Civil Aviation Authority) indicators
                   (Carta dei Servizi)
                   comparison with Italian regional airports
                   focus on airport services performance                                                3.82
               Airport Service Quality:                                   3.79
                   ACI World Airport Council International                          3.77
                   panel includes more than 250 airports worldwide
                   focus on airport passenger experience
                                                                         FY 2017   FY 2018            FY 2019
    19                                                                                  AEROPORTO G. MARCONI DI BOLOGNA S.p.A.
…THEN CAME THE STORM

20

                            AEROPORTO MARCONI DI BOLOGNA S.p.A.
HIGHLIGHTS
 & STRATGEY

    H1 2020
   RESULTS

        2020
KEY UPDATES
               H1 2020
               RESULTS

    21
                         AEROPORTO G. MARCONI DI BOLOGNA S.p.A.
TRAFFIC TREND IN EUROPE AND IN ITALY IN H1 2020
                                                                                                                                     Despite a slightly positive trend in the first 2
                                                                                                                                     months of the year (January +2.2% and February
                                                                                                                                     +0.9%), European traffic dropped by 21%
                                                                                                                                     during the first quarter of 2020.

                                                                                                                                     The     restrictive   measures     imposed    by
                                                                                                                                     governments on circulation, on economic and
                                                                                                                                     social activities, as well as the almost total
 HIGHLIGHTS                                                                                                                          elimination of flights operated by the airlines,
 & STRATGEY                                                                                                                          have brought European traffic almost to zero in
                                                                                                                                     the period between the end of March and the
    H1 2020
   RESULTS
                                                                                                                                     beginning of June. Only during the last month of
                                                                                                                                     the semester a partial but gradual elimination of
                                                                                                                                     the above mentioned measures has allowed a
        2020
KEY UPDATES
                                                                                                                                     slow and progressive recovery of traffic.

                                                                                                                                     According to ACI Europe, the development of
                                                                                                                                     the Covid-19 pandemic resulted in a loss of
                                                                                                                                     223 million passengers in European continent
                                                                                                                                     in June alone (-93% vs 2019).

                                                                                                                                     During the second half of June, when the
                                                                                                                                     possibility of crossing borders was restored, the
                                                                                                                                     traffic in Italy slowly started to recover.
                                                                                                                                     Nonetheless, around 70% of the traffic
                                                                                                                                     recorded during the first half of 2019 was lost,
                                                                                                                                     i.e. over 62.5 million passengers.

                                                                                                                                     The figure is almost in line with the other
                                                                                                                                     southern European states (Spain and France),
                                                                                                                                     while it is better than the countries of
                                                                                                                                     Northern Europe (Germany, UK, Benelux and
                                                                                                                                     Scandinavian states) where the reduction in
                                                                                                                                     traffic is greater than 75-80%.
               Source: ACI Europe. The sample considered represents 84% of European traffic as a whole.
    22         The number of confirmed cases of people infected with COVID-19 relates to data reported by John Hopkins University.                      AEROPORTO G. MARCONI DI BOLOGNA S.p.A.
TRAFFIC TREND OF MAIN ITALIAN AIRPORTS IN H1 2020

                                                Top 10 Italian Airports per number of passengers in H1 2020

                                 6.3M Pax   4.1M Pax   2.1M Pax   1.4M Pax   1.4M Pax   1.4M Pax     1.4M Pax                  1.0M Pax     1.0M Pax
                 7.000.000                                                                                         1.3M Pax                               -64%

                                                                                                                                                          -65%
                 6.000.000
 HIGHLIGHTS                                                                                                                                               -66%
                                                                                                                                (65,3%)
 & STRATGEY                                 (67,6%)    (67,6%)    (67,7%)                                                                                 -67%
                 5.000.000

                                                                                                                                                          -68%
    H1 2020                                                                                                                                  (69,2%)
   RESULTS       4.000.000       (69,5%)                                                                                                                  -69%
                                                                             (70,2%)
                                                                                                                                                          -70%
                 3.000.000
        2020
                                                                                                                   (70,7%)                                -71%
KEY UPDATES                                                                              (72,1%)
                 2.000.000                                                                                                                                -72%

                                                                                                                                                          -73%
                 1.000.000                                                                           (74,0%)
                                                                                                                                                          -74%

                           0                                                                                                                              -75%
                               Rome FCO Milan MXP      Bergamo    Bologna    Catania     Naples       Venice       Milan LIN   Rome CIA      Palermo

                                                            Domestic Pax     International Pax     Var 2020-2019

                 In H1 2020 Italian traffic decreased by more than two thirds (-69.9%) compared to the same period of 2019,
                 reporting a loss of more than 62 million passengers, entirely attributable to the period between March and June.
                 Passengers of the top 10 airports made up almost 80% of total H1 2020 traffic, also as a consequence of the closure of
                 many airports during the peak of the health emergency.
                 Bologna was the fourth Italian airport in terms of traffic during the period, accounting for about 5.3% of total
                 passengers, after Rome FCO (23.2% of total passengers), Milan MXP (15.1%) and Bergamo (7.8%).

    23         Source: Assaeroporti.                                                                                      AEROPORTO G. MARCONI DI BOLOGNA S.p.A.
BLQ TRAFFIC PERFORMANCE DURING H1 2020

                 After a good start during the first two months of the year, between March and May traffic numbers were close to
                 zero due to the lockdown and the restrictive measures imposed to face the sanitary emergency.
                 Passengers returned to fly at the beginning of June within the EU and the Schengen area, further accelerating
                 after the full reopening of Italian borders on 15th June.
                 The volume of passengers has therefore progressively increased during the last month of the semester, albeit
                 with numbers still very limited compared to the airport standards.

 HIGHLIGHTS
 & STRATGEY                                                                                                           -67.7%
                                                                                                                    vs H1 2019
    H1 2020
   RESULTS
                                                                    -28.9%                                                               -99.8%                       -99.7%                 -95.9%
                                                                  vs Q1 2019                                                           vs April 2019                 vs May 2019           vs June 2019
        2020
KEY UPDATES
               35.000

               30.000

               25.000                                                                  (*)

               20.000

               15.000

               10.000                                                     Issue of the first
                                                                         decree containing
                5.000                                                   restrictive measures

                    0

                                                                                                      Pax 2019 (**)                          Pax 2020 (**)

                (*) Leap year in 2020.
                (**) Figures include interlining passengers and exclude general aviation traffic.
    24                                                                                                                                                                  AEROPORTO G. MARCONI DI BOLOGNA S.p.A.
                NOTE: Please note that the day following the issue of the Prime Minister’s Decree on 23rd February 2020 is considered as the beginning of COVID-19
                health emergency in Italy.
H1 2020 KEY FIGURES

 HIGHLIGHTS
 & STRATGEY

    H1 2020
   RESULTS

        2020
KEY UPDATES

                 PASSENGERS            REVENUES              EBITDA             NET PROFIT
                1,435,301 PAX          €33.5 mln           (€0.7 mln)           (€4.7 mln)
                -67.7% vs H1 2019   -43.1% vs H1 2019   -103.3% vs H1 2019   -150.2% vs H1 2019

    25

                                                                              AEROPORTO G. MARCONI DI BOLOGNA S.p.A.
H1 2020 KEY HIGHLIGHTS

                       In H1 2020 passengers decreased by 67.7% and movements dropped by
                       59.4% compared to the same period of 2019.

                       Both legacy traffic and low cost traffic suffered from the health emergency
 HIGHLIGHTS            effects, respectively decreasing by 69.9% and by 66.0%.
 & STRATGEY

    H1 2020
   RESULTS             Aeronautical revenues fell by 62.2% due to the traffic decrease, the reduction of
                       charges from January 1st, 2020 and the discounts granted to handlers for the use of
        2020           operating spaces and check-in counters.
KEY UPDATES

                       Non Aeronautical revenues were down by 55.3% due to the reduction in traffic,
                       directly impacting some business areas (i.e. parking lots and MBL), and the
                       discounts applied to customers on sub-concession contracts to support airport
                       customers given the emergency phase.

                       Starting from March the company has been implementing a comprehensive
                       efficiency plan to contain costs and mitigate the negative impact of the drop in
                       traffic on profitability. In particular, specific actions have been put in place to contain
                       personnel costs, i.e. the disposal of overdue holidays, the freezing of overtime and,
                       with effect from 21st March, the recourse to the extraordinary redundancy fund
                       for all its employees.

                       Investments in infrastructure maintenance and development amounted to
    26                 €12.3M.

                                                                                        AEROPORTO G. MARCONI DI BOLOGNA S.p.A.
H1 2020 TOTAL REVENUES

                                                                                                 VAR % H1
                             EURO THOUSANDS                            H1 2020    H1 2019
                                                                                                   20/19
                             Aeronautical Revenues                     11.437      30.229          (62,2%)
                             Non Aeronautical Revenues                  9.421      21.075          (55,3%)
                             Revenues for Construction Services*       12.418      7.091            75,1%
 HIGHLIGHTS
 & STRATGEY                  Other Revenues                              225        504            (55,4%)
    H1 2020                  Revenues                                  33.501      58.899          (43,1%)
   RESULTS
                             Revenues adj                              21.083      51.808          (59,3%)
        2020
KEY UPDATES

                            AERONAUTICAL REVENUES: the sharp reduction is mainly linked
                            to the traffic volumes decrease due to the Covid-19 health
                            emergency.

                                                                           NON AERONAUTICAL REVENUES:
                                              the traffic contraction directly affected parking revenues, MBL
                                         revenues and the variable component of sub-concession contracts.
                                                                 Also, discounts were applied to customers on
                                                         fixed fees to support them during the emergency period.

    27                                                                                      AEROPORTO G. MARCONI DI BOLOGNA S.p.A.
               * IFRIC 12
OPERATING COSTS: COMPREHENSIVE EFFICIENCY PLAN
                          IMPLEMENTED TO CONTAIN COSTS

                                                            OPERATING COSTS BREAKDOWN (‘000 €)

                              Total costs
                                38,409                                                               OPERATING COSTS -11.0%
                                                                       Total costs
 HIGHLIGHTS                                                              34,184                      NET OF CONSTRUCTION COSTS -29.4%
 & STRATGEY
                                 6,753

    H1 2020                                                                                          Personnel costs         down by 29.2% thanks to:
                        Net of constr. costs                              11,826
   RESULTS
                                31,656
                                                                                                             A.    decrease in headcount employed in airport
        2020                                                                                                       operations (less temporary staff in security and
KEY UPDATES                      6,631                           Net of constr. costs                              terminal activities);
                                                                         22,358                              B.    Extraordinary Redundancy Fund launched on
                                                                                                                   March 21, 2020;
                                10,075                                     4,094
                                                                                                             C.    cost reduction initiatives to mitigate the effects of
                                                                                                                   the drop in traffic.
                                                                           7,681
                                                                                                     Services costs        (-23.8%) decrease due to:

                                14,950                                                                       A.    Lower utility costs;
                                                                          10,583
                                                                                                             B.    Lower costs directly related to traffic figures (e.g.
                                                                                                                   business lounge, PRM);

                                1H 2019                                   1H 2020                            C.    Renegotiation of some major service contracts.

                         Personnel              Services Costs (1)                Other (3)
                                                                                                     Construction costs              (+75.1%) due to higher investments
                         Other (3)               Construction costs (2)
                                                                                                     related to concession rights.

               1   Services: includes outsourced services, maintenance, utilities costs and G&A
               2   IFRIC 12                                                                                                             AEROPORTO G. MARCONI DI BOLOGNA S.p.A.
    28         3   Other: includes consumables and goods, rental fees and other operating expenses
AVIATION AND NON-AVIATION BUSINESS

                            REVENUES SEGMENT SHARE                                AVIATION & NON-AVIATION EBITDA
                                    H1 2020                                              H1 2020/2019 (‘000€)
                                                                                                12.196

                                                                                       8.294

 HIGHLIGHTS                                       49%                                                                              3.378
 & STRATGEY
                               51%
    H1 2020
   RESULTS

        2020
                                                                                                                        -4.060
KEY UPDATES
                                                                                           1H 2019                           1H 2020

                                                   AVIATION             NON AVIATION

                  BUSINESS UNIT AVIATION          H1        H1        VAR %     BUSINESS UNIT                        H1        H1        VAR %
                  (‘000 €)                       2020      2019      H1 20/19   NON-AVIATION (‘000 €)               2020      2019      H1 20/19

                  Passengers                    8,476     28,446     (70.2%)
                                                                                Retail and Advertising              3,098     7,333     (57.8%)
                  Airlines                      5,938     12,429     (52.2%)
                                                                                Parking                             2,800     7,970     (64.9%)
                  Airport operators              814       1,648     (50.6%)
                                                                                Real estate                         1,107     1,215      (8.9%)
                  Traffic incentives            (3,862)   (12,471)   (69.0%)
                  Constructions revenues*                                       Passenger services                  1,221     3,002     (59.3%)
                                                4,422      5,965     (25.9%)
                  Other aviation revenues        653        675       (3.3%)    Constructions revenues*             7,995     1,126      610.0%
                  Fees reduction for doubtful                                   Other non aviation revenues          906      1,562     (42.0%)
                                                 (67)       (1)        n.m.
                  receivables**
                  Total Revenues AVIATION       16,374    36,691     (55.4%)    Total Revenues NON-AVIATION        17,127    22,208     (22.9%)

                  EBITDA AVIATION               (4,060)    8,294     (149.0%)   EBITDA NON-AVIATION                 3,378    12,196     (72.3%)

    29         * IFRIC 12
               ** IFRS 15                                                                                     AEROPORTO G. MARCONI DI BOLOGNA S.p.A.
EBITDA

                                                                          H1 2020 GROUP EBITDA (‘000 €)
                         20,490

 HIGHLIGHTS                              (18,792)
 & STRATGEY

    H1 2020                                                                                                                                   2,537
   RESULTS                                                                                                                  2,394
                                                                                                                                                                                (683)
        2020                                              (11,654)                                                                                            (5,073)
KEY UPDATES                                                                  5,327
                                                                                              (279)         4,367

                      EBITDA 1H 2019    Aeronautical   Non Aeronautical    Construction   Other Revenues   Personnel   Services costs (2) Other costs (3)   Constructions   EBITDA 1H 2020
                                         Revenues         Revenues         Revenues (1)                                                                       Costs (1)

                                         Revenues -25.4 ml €                                                                 Opex -4.2 ml €
                           Net of construction services revenues -30.7 mln €                                   Net of construction services costs -9.3 ml €

                                                                EBITDA H1 2020 -103.3% VS H1 2019 (-21.2 ML €)

                                           EBITDA NET OF CONSTRUCTION COSTS -106.3% VS H1 2019 (-21.4 ML €)

               1 IFRIC 12
    30         2 Services: includes outsourced services, maintenance, utilities costs and G&A.                                                     AEROPORTO G. MARCONI DI BOLOGNA S.p.A.
               3 Other: includes consumables and goods, rental fees and other operating expenses.
CONSOLIDATED PROFIT & LOSS

                  EURO THOUSANDS                         H1 2020    H1 2019
                                                                                VAR        VAR %     1 REVENUES
                                                                               H1 20/19   H1 20/19     ▼(-43.1%) traffic decrease, charges
                  Revenues                           1   33,501     58,899     (25,398)   (43.1%)       update, discounts granted to aviation
                                                                                                        and non-aviation customers
                  Operating Costs                        (34,184)   (38,409)    4,225     (11.0%)
                  EBITDA                             2    (683)     20,490     (21,173)   (103.3%)   2 EBITDA
                                                                                                        ▼ (-103.3%) operating leverage
 HIGHLIGHTS       EBITDA Adjusted*                       (1,275)    20,152     (21,427)   (106.3%)
                                                                                                        highly affected by the sharp
 & STRATGEY
                  Concession Rights Amortization         (3,317)    (3,024)     (293)      9.7%         contraction in revenues, only partially
    H1 2020
                                                                                                        compensated by results of the
                  Amortization & Depreciation            (1,970)    (1,999)      29        (1.5%)       comprehensive cost optimization plan
   RESULTS
                  Amortization and Depreciation      3   (5,287)    (5,023)     (264)      5.3%         implemented at the beginning of the
        2020
                                                                                                        emergency
                  Provision for Doubtful Accounts         (257)      (350)       93       (26.6%)
KEY UPDATES
                  Airport Infrastructure Provision        (363)     (1,191)      828      (69.5%)    3 AMORTIZATION,
                                                                                                        DEPRECIATION AND
                  Other Accruals                           (20)      (208)       188      (90.4%)       PROVISIONS
                  Provisions                         3    (640)     (1,749)     1,109     (63.4%)       ▼ -12.5% (▲ +5.3% amortization and
                                                                                                        depreciation and ▼ -63.4%
                  Total Costs                            (40,111)   (45,181)    5,070     (11.2%)       provisions)
                  EBIT                                   (6,610)    13,718     (20,328)   (148.2%)
                  Financial Income                         116        79         37        46.8%
                                                                                                     4 FINANCIAL INCOME AND
                                                     4
                                                                                                        EXPENSES
                  Financial Expenses                      (303)      (598)       295      (49.3%)       ▼ lower financial interests
                  EBT                                    (6,797)    13,199     (19,996)   (151.5%)
                                                                                                     5 TAXES
                  Taxes                              5    2,066     (3,778)     5,844     (154.7%)      due to a negative taxable base, taxes
                                                                                                        turned positive
                  Net Profit (loss)                  6   (4,731)     9,421     (14,152)   (150.2%)
                  Minority Interest                         0          0          0        0.0%      6 NET PROFIT
                                                                                                        ▼ -14.2M € vs H1 2019
                  Group Net Profit                       (4,731)     9,421     (14,152)   (150.2%)

    31                                                                                                         AEROPORTO G. MARCONI DI BOLOGNA S.p.A.
               * Net of construction works
NET FINANCIAL POSITION

                                                         H1 2020 NET FINANCIAL POSITION (‘000 €)

               10,501                                                                                                                       30 Jun       31 Dec
                                                                                                    EURO THOUSANDS                                                   Change
                                                                                                                                             2020         2019
 HIGHLIGHTS
 & STRATGEY                                                                                         Liquidity                                   16,091     29,253     (13,162)
    H1 2020                                                                                         Current financial receivables                  772         501        271
   RESULTS
                               (13,162)                                                             Current bank debt                          (5,035)        (28)     (5,007)
        2020
KEY UPDATES                                                                                         Current portion of non-current debt        (3,062)     (3,059)         (3)
                                                                                     (5,822)
                                                                                                    Other current financial debt               (1,967)     (3,086)       1,119
                                              271         (3,891)
                                                                                                    Current financial debt                    (10,064)     (6,173)     (3,891)

                                                                                                    Net current financial position               6,799     23,581     (16,782)
                                                                          459
                                                                                                    Non current financial debt                (12,621)    (13,080)        459

               Net financial    Liquidity      Current     Current      Non-current Net financial   Net Financial Position                     (5,822)     10,501     (16,323)
                 position                     financial financial debt financial debt  position
               31/12/2019                   receivables                               30/06/2020    Financial instruments with a
                                                                                                                                                 1,020       1,349       (329)
                                                                                                    maturity of over 12 months

                                                            H1 2020 Net Financial Position of € -5.8 mln
                               Not including financial instruments with a maturity of over 12 months as per IFRS 7
    32                                                                                                                                    AEROPORTO G. MARCONI DI BOLOGNA S.p.A.
HIGHLIGHTS
 & STRATGEY

     H1 2020
    RESULTS

        2020
KEY UPDATES    2020
               KEY UPDATES

    33
                       AEROPORTO G. MARCONI DI BOLOGNA S.p.A.
FY 2020 UPDATE (1)

               Traffic trend
               Since the restart of flights from and to the EU and Schengen areas starting from June, AdB’s traffic volumes have been
               recovering, albeit slowly.
               Already in July the decrease in traffic dropped to -75.2% on the same month of 2019, compared to losses recorded each
               month between April and June always higher than 95%.
 HIGHLIGHTS
 & STRATGEY
               In August, the traffic gap compared to 2019 was further reduced to around -65.9%, recording more than 300,000 passengers.
               However, the international component of traffic remains very weak (-75.2% between July and August compared to 2019).
     H1 2020
    RESULTS
               On the other side, the domestic traffic reported a much more modest decrease of -27.5% compared to the same period of 2019:
               the most popular destinations in August were Catania, Olbia, Palermo, Cagliari and Rome.
        2020   Also, the traffic to Sardinia reported a significant growth: thanks to the start of Volotea's flights, passengers to and from the
KEY UPDATES
               Costa Smeralda Airport increased by 48% on the same month of 2019, while Cagliari (with Ryanair) also registered a +6%.
               In the first eight months of 2020 Marconi recorded 1,974,082 passengers (-68.5%), with 19,815 movements (-59.4%) and
               20,678 tons of cargo transported (-18.4%).

    34

                                                                                                                   AEROPORTO G. MARCONI DI BOLOGNA S.p.A.
FY 2020 UPDATE (2)

               Runway maintenance works planned for September 2020
               In September traffic will also be affected by the closure of the airport for 10 days (from 11th to 21st
               September) necessary to carry out a series of maintenance works on the runaway.

 HIGHLIGHTS
 & STRATGEY
               Loans to support liquidity
               With the aim of addressing the increased financial requirements related to the working capital needs
     H1 2020
    RESULTS    triggered by the Covid-19 emergency, in July the Parent Company finalized two loans for a total of €58.9
               million (€25 million with Unicredit and €33.9 million with Intesa Sanpaolo), both backed by guarantees issued
        2020   by SACE, as part of the Guarantee Italy program, and with a duration of 72 months.
KEY UPDATES

               Extended duration of the concession
               In consideration of the decrease in traffic at Italian airports deriving from the Covid-19 emergency and in order
               to contain the consequent negative economic effects, the duration of the concessions for the management
               and development of the airport activity within the country has been extended by two years.

               ACI Airport Health Accreditation
               At the end of August, Bologna Airport - as the first airport in Italy and among the first in the world - obtained
               the Airport Health Accreditation from ACI World, the international program that evaluates measures and
               procedures introduced by airports to face the spread of the Covid-19 pandemic.
               Bologna airport was assessed on different aspects including cleaning, communications to passengers,
    35         physical distances, personnel protection and the facilities available to passengers.
                                                                                                    AEROPORTO G. MARCONI DI BOLOGNA S.p.A.
FY 2020 UPDATE (3)

               Operating and financial performance and business outlook

               The high level of uncertainty related to the duration of the health emergency and its future developments
               makes it difficult to make reliable estimations regarding both the Company’s traffic trend and
 HIGHLIGHTS
 & STRATGEY    economic and financial situation for the coming months.
     H1 2020
    RESULTS
               The performance of the non-aviation business in H2 2020 will continue to be negatively affected by the
               emergency situation, both for the redefinition of contracts with the suspension of the minimum guaranteed
        2020   component and for the partial recovery of traffic volumes on which the variable component of contracts is
KEY UPDATES
               based.

               Despite the mitigation actions implemented and taking into account the difficulties in estimating the impacts on
               the economic-financial results of an event whose duration is unknown, it is estimated that the impact of the
               pandemic will be highly negative in the current year and the recovery of 2019 volumes is difficult to reach
               in the short term. Furthermore, the traffic recovery does not generate a proportional recovery of profitability,
               both in unitary terms and in absolute value, due to the high incidence of fixed costs and the higher operating
               costs to guarantee the anti Covid-19 protocols.

    36

                                                                                                   AEROPORTO G. MARCONI DI BOLOGNA S.p.A.
AIR TRAFFIC EVOLUTION SCENARIOS – IATA1

 HIGHLIGHTS
 & STRATGEY

     H1 2020
    RESULTS

        2020
KEY UPDATES

                IATA revised down its traffic trend outlook over the next five-year period, forecasting (i) a decline
                in RPKs by a little more than 60% in 2020 compared to 2019 and (ii) a return to pre-COVID
                levels not occurring until 2024.

                Many uncertainties remain around the outlook and in the latest update various possible future
                scenarios have been investigated.
    37

               1 Report “COVID-19 June data and revised air travel outlook” published on 28th July 2020   AEROPORTO G. MARCONI DI BOLOGNA S.p.A.
AIR TRAFFIC EVOLUTION SCENARIOS - ACI EUROPE1

                   ACI EUROPE updated the traffic scenarios as follows:

                                       Estimated Impact on 2020                          Base Case             Pessimistic Case
                                       Full Year lost Passenger vs B.A.U. (*) -1.57 B pax                          -1.75 B pax
 HIGHLIGHTS
 & STRATGEY                                                                                  -64%                        -71%
     H1 2020

                   According to the revised traffic forecast:
    RESULTS

        2020       (i) a full recovery in passenger traffic to 2019 levels is now expected for 2024, rather than
KEY UPDATES
                   2023 as per the previous forecast (May 2020).
                   (ii) European airports’ passengers are now set to decrease by 64% compared to 2019.
                                                                         2020 Traffic Scenarios
                                                                     (compared to same month of 2019)

                       0,00%
                     -20,00%
                     -40,00%
                     -60,00%
                     -80,00%
                    -100,00%
                                 Jan       Feb       Mar       Apr       May       Jun       Jul        Aug        Sep       Oct       Nov        Dec
                                                                Base Case         Pessimistic Case        Actual
    38
                1 Report “COVID-19 & AIRPORTS Passenger traffic & revenue impact” published on 6th July 2020
               (*) B.A.U., i.e. ‘Business As Usual’, situation that foresees a 2.3% passenger traffic growth              AEROPORTO G. MARCONI DI BOLOGNA S.p.A.
DISCLAIMER

     This document has been prepared by Aeroporto G. Marconi di Bologna S.p.A. (AdB) solely for use at the presentation to potential
     institutional investors it is not to be reproduced or circulated and is not to be used in the United States, Canada, Australia or Japan.

     The information contained in this document has not been independently verified. No representation or warranty expressed or implied
     is made as to, and no reliance should be placed on, the fairness, accuracy, completeness or correctness of the information or
     opinions contained herein. None of AdB or any of their representatives shall have any liability whatsoever (in negligence or
     otherwise) for any loss arising from any use of this document or its contents or otherwise arising in connection with this document.

     This document does not constitute an offer or invitation to purchase or subscribe for any shares and neither any part of it shall form
     the basis of or be relied upon in connection with any contract or commitment whatsoever. This document is being supplied to you
     solely for your information and may not be reproduced, redistributed or passed on, directly or indirectly, to any other person or
     published, in whole or in part, for any purpose.

     Neither this document nor any part or copy of it may be taken or transmitted into the United States or distributed, directly or indirectly,
     in the United States, or to any “U.S. Person” as that term is defined in Regulation S under the U.S. Securities Act of 1933, as
     amended (the “Securities Act”). Neither this document nor any part or copy of it may be taken or transmitted into or distributed
     directly or indirectly in Australia (other than to persons in Australia to whom an offer of securities may be made without a disclosure
     document in accordance with Chapter 6D of the Corporations Act 2001 (Cth.), or taken or transmitted into Canada or Japan, or
     distributed directly or indirectly in Canada or distributed or redistributed in Japan or to any resident thereof. Any failure to comply with
     this restriction may constitute a violation of U.S., Australian, Canadian or Japanese securities laws, as applicable. The distribution of
     this document in other jurisdictions may also be restricted by law, and persons into whose possession this document comes should
     inform themselves about, and observe, any such restrictions. In this case no reliance will be placed on AdB.

     The statements contained in this document that are not historical facts are "forward-looking" statements (as such term is defined in
     the United States Private Securities Litigation Reform Act of 1995), which can be identified by the use of forward-looking terminology
     such as "believes", "expects", "may", "will", "should" or "anticipates" or the negative thereof or other variations thereon or comparable
     terminology, or by discussions of strategy that involve risks and uncertainties.

     These forward-looking statements, such as the statements regarding AdB‘ s ability to develop and expand its business, the effects of
     regulation, changes in overall economic conditions, capital spending and financial resources and other statements contained in this
     document regarding matters that are not historical facts involve predictions. No assurance can be given that the anticipated results
     will be achieved. Actual events or results may differ materially as a result of risks and uncertainties facing AdB and its subsidiaries.
     Such risks and uncertainties include, but are not limited to, increased competition and regulatory, legislative and judicial
     developments that could cause actual results to vary materially from future results indicated, expressed or implied in such forward-
     looking statements.
39
     By viewing the material in this document, you agree to the foregoing.
                                                                                                              AEROPORTO G. MARCONI DI BOLOGNA S.p.A.
THANK YOU FOR YOUR ATTENTION!

            For additional information:

            investor.relations@bologna-airport.it

            Tel: +39 051/6479680

            Infrastructure Day, September 9th 2020

40
                                              AEROPORTO G. MARCONI DI BOLOGNA S.p.A.
You can also read