Colonization of Warsaw by the red fox Vulpes vulpes in the years 1976-2019 - Nature
←
→
Page content transcription
If your browser does not render page correctly, please read the page content below
www.nature.com/scientificreports
OPEN Colonization of Warsaw by the red
fox Vulpes vulpes in the years
1976–2019
Mateusz Jackowiak1,2*, Jakub Gryz3, Karolina Jasińska2, Michał Brach4, Leszek Bolibok5,
Piotr Kowal2 & Dagny Krauze‑Gryz2*
The red fox is one of the most adaptable carnivores inhabiting cities. The aim of our study was to
describe the process of Warsaw colonization by the red fox. We focused on: (1) the fox distribution in
Warsaw on the basis of presence-absence data (2005–2012) over a grid of 1 × 1 km2, (2) the process
of settlement in 29 green areas (study periods 1976–1978, 2004–2012, and 2016–2019) in relation to
habitat type, and (3) temporal and spatial patterns of the red fox incidents (1998–2015) reported by
Warsaw citizens. We found out that: (1) the red fox penetrated the whole city (i.e. its presence was
confirmed in all squares of the grid), (2) 21% of the green areas were colonized in 1976–1978 but 93%
in 2016–2019. Forests and riparian habitats were occupied more frequently than parks and cemeteries
in 1976–1978 with no difference in the further years; (3) the probability of the fox incidents increased
over years, was higher in June-October, on working days, and around noon, and with the share of
discontinuous urban fabric in the buffers around incident locations. Nevertheless, the incidents only
partially reflect population abundance trends and activity patterns of the species, so should be treated
cautiously.
For decades, the use of urban areas by wildlife and urban species population numbers have increased1–6, which
is a result of wildlife adaptation to specific urban conditions (like high human density, large areas of impervious
surfaces and built-up areas)7–10. One of species inhabiting urban areas is the red fox (Vulpes vulpes)11. Thanks
to its plasticity the red fox utilizes a wide range of habitats—from near-natural to built-up a reas12–15, and uses a
variety of food in different h abitats16–19. As a result, urban populations of the red fox may reach extremely high
densities1,13,20–23. This in turn may lead to emerging and rapidly spreading epizooties (e.g. sarcoptic mange),
limiting the number of f oxes24,25. The occurrence of the red fox in urban areas, may result in predation on pets
and digging burrows16,26–29, which is annoying and frequently reported by city inhabitants30,31.
The first red foxes in urban areas were recorded in the 1930s in the suburbs of London12,32. Yet, historical
analyses showed that foxes used urban habitats in the mid-nineteenth c entury33 or even e arlier34. The time of
colonization of urban areas by red fox varies by countries: Denmark—the 1 960s33, Australia—the 1 970s35, Swit-
zerland—the 1980s36. Nowadays, red fox populations have been recorded from more than one hundred cities
around the world, mostly in Great Britain and other European c ountries37, but new cities have been c olonized28
and some urban populations have continued to increase in numbers31. The red fox populations expanding in
urban areas are probably related to anti-rabies vaccinations implemented in many c ountries36,38, but not all.
Although the red fox is common in many cities, breeding in typically urban populations have not been recorded
from everywhere34.
The red fox is mainly n octurnal31,39. Moreover, patterns of daylight encounters of the red fox are variable21
cf.40, and the probability of fox sighting are influenced by human activity and their space use in a c ity31. Therefore,
the increase of the red fox sightings does not necessarily reflect increase in the population abundance, but can be
related to the rising number of the red fox-human conflicts (traffic collisions or intervention of relevant services,
1
Central Laboratory for Environmental Analysis ‑ CentLab, Institute of Environmental Protection
- National Research Institute, Krucza 5/11D, 00‑548 Warsaw, Poland. 2Department of Forest Zoology and Wildlife
Management, Institute of Forest Sciences, Warsaw University of Life Sciences WULS-SGGW, Nowoursynowska
159, 02‑776 Warsaw, Poland. 3Department of Forest Ecology, Forest Research Institute, Braci Leśnej 3, Sękocin
Stary, 05‑090 Raszyn, Poland. 4Department of Geomatics and Land Management, Institute of Forest Sciences,
Warsaw University of Life Sciences WULS-SGGW, Nowoursynowska 159, 02‑776 Warsaw, Poland. 5Department
of Forest Silviculture, Institute of Forest Sciences, Warsaw University of Life Sciences WULS-SGGW,
Nowoursynowska 159, 02‑776 Warsaw, Poland. *email: mateusz.jackowiak@ios.gov.pl; dagny_krauze_gryz@
sggw.edu.pl
Scientific Reports | (2021) 11:13931 | https://doi.org/10.1038/s41598-021-92844-2 1
Vol.:(0123456789)
www.nature.com/scientificreports/
e.g. trapping, interventional culling)28,41. Taking all this into account, direct observations can be used to estimate
abundance of urban populations of red foxes20,42, yet estimation bias needs to be acknowledged43. On the other
hand, registry of incidents involving foxes (e.g. traffic collisions), was found to be quite a reliable indicator of
population rise, changes in species d istribution5,21,41 and a possible density e stimator44.
Preliminary studies on red fox population in Warsaw, conducted in the 1970s, showed a very low popula-
tion density and just incidental (and associated to forest areas in peripheral city zones) records of breeding
[Goszczyński J., unpublished]. It is likely that the population has grown since then and has spread throughout
the city area. Therefore, the aim of our study was to describe the process of Warsaw colonization by the red fox
on the basis of current and historical field work and red fox incident reports. The study included three parts.
First, we checked what proportion of the city was colonized by the red fox on the basis of presence–absence
data over a grid of squares. We assumed that red foxes would be present mostly in outer city districts, forests
and continuous fields and meadows, but also within the Vistula river riparian forests, as this would serve as an
ecological corridor. Next, we analysed the progress in the settlement of selected urban green areas by red fox
for which historical and present field work data were available. We related the process of colonization to habitat
types of those areas. Additionally, we analysed how the number of red fox incidents changed over a twenty year
period as this would, at least to some extent, reflect population abundance increase. We also checked what were
the temporal and spatial factors shaping the pattern of red fox incidents and related this to both carnivore biol-
ogy and ecology but also human activity within the city. This would help to evaluate usefulness of such data to
document population increase of the red fox in urban conditions.
Methods
Study area. The research was conducted in Warsaw (52° 13′ 47″ N 21° 00′ 42″ E), the capital city of Poland,
the largest (517 km2) and the most populous (1,778,000 inhabitants, 3437 inhabitants/km2) city of the c ountry45.
The city is situated at an altitude of around 113 m above sea level with an annual rainfall of about 500 mm and
an average annual temperature of 7.7 °C46.
The Vistula River flows through Warsaw, dividing the city into two parts (Fig. 1). The left bank of the river
is characterized by a high degree of anthropogenic transformation, while along the right bank natural riparian
forests, included in the Natura 2000 network47–49 and constituting an important ecological corridor, have been
preserved.
Warsaw is divided into 18 districts and characterized by high proportion of green areas (as much as 63%
according to Luniak et al.50). These are: numerous parks, squares, residential and roadside vegetation, cemeter-
ies, botanical and zoological gardens, allotment gardens, home gardens, old city fortifications, open areas and
agricultural land (pastures, meadows, orchards). Moreover, natural greenery like riparian forest along the Vistula
and smaller watercourses, nature reserves and forests are important green areas. Most of parks and squares are
located in the city centre (Fig. 1). Forests account for about 15% of the city area and are located mainly in the
outskirts, and in the eastern and south-eastern part of the city (Fig. 1). It may be assumed that the connectivity
between green areas on each side of the river is relatively maintained, and that the system of protected areas in
Warsaw provides a safeguard to populations of most, especially small mammal species51.
Research methods. The study included three stages: (1) assessment of the fox distribution in Warsaw, (2)
describing the process of settlement in the selected green areas and (3) temporal and spatial patterns of incidents
with red foxes.
Data collection. Assessment of the red fox distribution in Warsaw. To assess the occurrence of the red fox
in Warsaw, the city area was divided into grid of 593 squares (Fig. 2) with the resolution 1 × 1 km, 152 squares
were located at the borders of Warsaw (with part being outside the city not included in the study). Each square
was checked for the presence of the red fox. First, all previously collected direct sightings of red fox and known
fox dens dating back to 2005 were assigned to a square. Next, all remaining squares were searched between 2011
and 2012 for signs of fox presence. Most of the data was collected during winter 2011–2012, when long-lasting
snow cover allowed for efficient (snow tracking) survey. Additionally, occupied and non-occupied burrows,
presence of adults or juveniles, or killed animals (mostly victims of collisions), and, in some cases, tracks on the
mud/sand or scats were recorded. When some of the above was found, the square was marked as ‘fox present’
and no further checks were done in this particular square. When no signs were found, we repeated the survey or
searched the square more thoroughly.
Process of the settlement of the red fox in the selected green areas. To estimate the progress in the settlement of
selected green spaces in the city, 29 various green areas (4 to 139 ha) located in different distance from the city
centre were selected. They were attributed to four different habitat types: cemeteries (n = 6), forests (n = 5), parks
(n = 11) and riparian habitats in the Vistula river valley (n = 7). The green areas were easily identified as separate
units, and they remained relatively stable in terms of boundaries and land use since the first compared period:
the 1970s. The research was done in three periods: (1) 1976–1978 (Goszczyński J., unpbl. data), (2) 2004–2012
and (3) 2016–2019. In the first period, in all selected areas snow-tracking on transect routes (i.e. line transects)
was done to confirm the species presence. In the next two periods, presence of fox was confirmed either on the
basis of snow tracking on the transect routes or on the basis of presence of dens or breeding records within the
green area. The total lengths of the line transects were: 113.9 km (on average 3.9 km in one study area, min = 0.15,
max = 23.5 km), 61.0 km (2.8 km, min = 0.5, max = 9.1 m), 93.4 km (5.5 km, min = 0.8, max = 21.2 km) in the
three periods, respectively.
Scientific Reports | (2021) 11:13931 | https://doi.org/10.1038/s41598-021-92844-2 2
Vol:.(1234567890)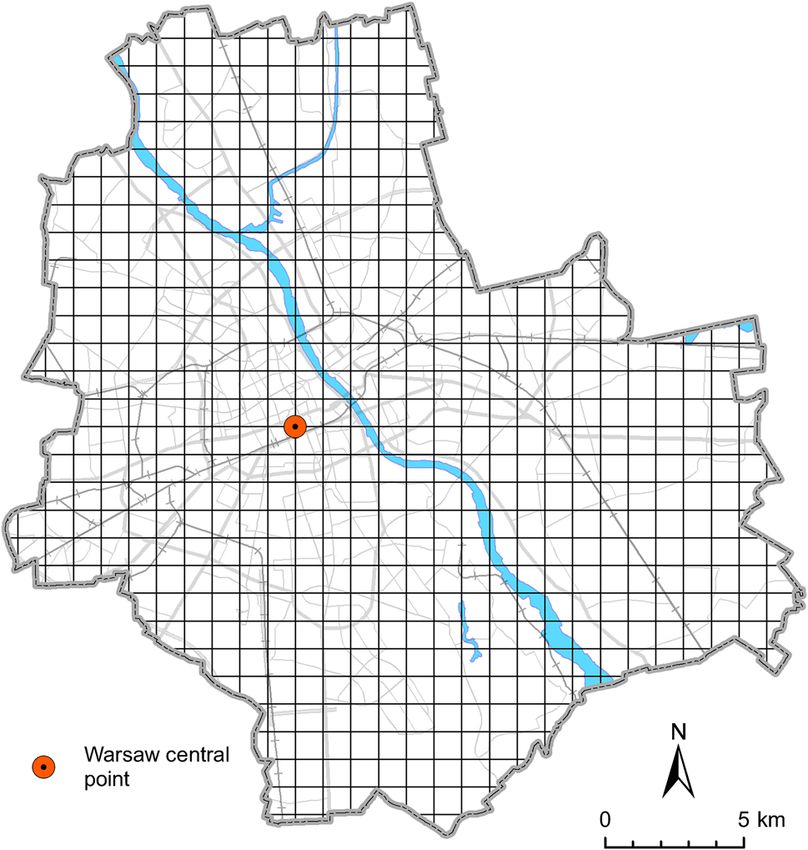
www.nature.com/scientificreports/
Figure 1. Distribution of green areas and other habitats in Warsaw. The Palace of Culture and Science, assumed
as the most central point of the city is marked.
Spatial and temporal patterns of incidents involving the red fox. As the third source of data, we used reports
on red fox presence in the city (1998–2015), recorded by the Municipal Forests—Warsaw. The data included
any kind of incident involving red fox: sightings (reported by city inhabitants), trapping attempts, culling or
euthanasia, traffic collisions involving the species, observation of burrows or litters, individuals found dead or
delivered to the rehabilitation centre governed by the Municipal Forests—Warsaw. For each incident, time and
date, approximate or exact location (see Supplementary Fig. S1) and condition of the animal (alive, wounded,
dead) were recorded.
Statistical and spatial analysis. Process of the settlement of the red fox in the selected green areas. The χ2
test for goodness of fit was used to test the null hypothesis that the observed counts of objects (green areas) of
each habitat type, colonised by foxes followed the expected counts, which were proportional to the total number
of objects belonging to a given habitat category. In the case the null hypothesis had been falsified the post-hoc
analysis was performed to determine which counts differed from their theoretical proportions. The confidence
intervals for multinomial proportions were calculated using method proposed by Sision and G laz52 with the
53
function MultinomCI from package DescTools .
Spatial and temporal patterns of incidents involving the red fox. To analyse temporal patterns of incidents with
foxes two statistical models were built. The first one described annual and year to year variation (1998–2015)
in the number of incidents with the red fox. The second one described the hourly variation in the number of
incidents. We checked the assumption that incorporation of nonlinear effects to the model improved its perfor-
mance by comparison of two models both fitted with gam function from library mgcv. The first had only linear
terms and the second had nonlinear smoothers. To compare explanatory power of both models we used the
anova function. The methods described above, confirmed with the significance level at least 0.05, that models
containing non-linear terms performed better in the case of both models. We tested for concurvity (which is
counterpart for collinearity for gam models) in the first gam model (containing more than one independent
variable) with function concurvity() from library mgcv. We also checked for collinearity in each logistic regres-
sion model for spatial data with the use of function check_collinearity from library performance.
To build the first temporal model each recorded incident with fox was coded for ‘day of year’ (ordinal day as
number ranging from 1 to 366) and ‘time of week’ (variable week with only two levels weekday and weekend).
Based on these attributes the number of collisions per day was calculated for each day in the analysed period
(6574 estimates). To account for a possible trend in the number of fox incidents in the analysed period the addi-
tional variable ‘time of data collection’ was introduced. This was based on a unique number representing a cal-
endar day in R software environment. The variable was scaled by 1000 to values in a range from 10,227 to 16,800
representing all days in the analysed period. The general additive model (GAM) with a Poisson error distribution
and log link was used to determine how the number of incidents changed over time during 1998–2015. These
kind of models use splines, that allow for determination of nonlinear fit between dependent and independent
variables in a more elastic manner then parametric nonlinear functions usually implemented in generalized
Scientific Reports | (2021) 11:13931 | https://doi.org/10.1038/s41598-021-92844-2 3
Vol.:(0123456789)www.nature.com/scientificreports/
Figure 2. The grid of squares searched for presence signs to assess red fox distribution in Warsaw in 2005–
2012. The Palace of Culture and Science, assumed as the most central point of the city is marked.
models. The ‘number of incidents per day’ was used as a response variable. The ‘day of year’ and described above
variables: ‘time of data collection’ and ‘time of week’ were used as explanatory variables. In the GAM model an
explanatory variable ‘day of year’ was fitted with cyclic penalized cubic regression splines whose ends match
(i.e., number of incidents in day 1 and day 366 was assumed to be the same; W ood54). The variable ‘time of data
collection’ was fitted in a model with ordinary regression splines. For both mentioned variables the upper limit
for the effective degrees of freedom of the spline was set at 10 to control the complexity of the fit. The variable
‘time of week’ was used as fixed categorical variable.
The second temporal model was built to estimate the daily variability of incidents with foxes. The dependent
variable was calculated as a number of incidents per minute of a day, e.g. all cases of fox incidents which happened
between 0:00 and 0:01 in the whole period of study (between 1998 and 2015) were pooled and assigned to the
first minute of a day. This gave variable containing 1440 min estimates. The only independent variable used in
this model was the ‘minute of day’ ranging from 1 to 1440. As in previous model the explanatory variable was
fitted with cyclic penalized cubic regression splines whose ends match and the effective degrees of freedom of
the spline was set at 10. Both GAM models were parametrized using the mgcv p ackage55.
Among all incidents with red foxes, only those for which the exact location was known (i.e. the street num-
ber or other details that allowed to locate the place with at least 50 m accuracy were given) were taken for spa-
tial analysis. In order to analyse habitat characteristics for red fox incidents locations, the following data were
involved: Urban Atlas (UA) published in 2018 and derived by EU Copernicus Land Monitoring Service56, which
presented the biophysical characteristic of Earth, the polygon data for the Vistula river and the central point of
Warsaw. The UA layer was generalized into seven classes of landcover (continuous urban fabric, discontinuous
urban fabric, industrial areas, parks, agricultural areas, forests, wetlands; see Supplementary Table S1). Around
all fox incident locations the circle polygons with the radius 100, 250, 500 and 1500 m were generated by buffer
function. Next UA layers were intersected with each buffer independently and the UA classes percentages for
each radius were calculated. The planar distances between fox incident location and aforementioned point lay-
ers were done by the ArcGIS near function. The same procedure was repeated for the 1000 randomly generated
points within the border of Warsaw. To analyse spatial characteristics of incidents four logistic regression models
were built. The dependent variable was a binary vector of length 1263, taking values equal 1 for all 263 incidents
with foxes for which precise geographic location was available and 0 for additional 1000 locations, randomly
distributed within the border of Warsaw. The distance to the city centre (i.e. the most central point of the city,
Fig. 1), the distance to the Vistula River (an ecological corridor within the city) and the percentage share of
seven habitats that were subject to different level of anthropopression (Supplementary Table S1) in the buffer
zones (100, 250, 500, 1500 m) were taken as independent variables in each model. In each spatial model the
characteristic of surrounding habitats were calculated based on different radius 100, 250, 500, 1500 m. Variables
that were not important statistically were removed from fitted models. The comparison of model performance
based on R 2 could be used to judge which environmental variables and in a given spatial scale were the most
important to predict incidents with foxes.
All statistical calculations were performed in R 57. All spatial analyses were performed in ArcGIS package
version 10.8.158.
Scientific Reports | (2021) 11:13931 | https://doi.org/10.1038/s41598-021-92844-2 4
Vol:.(1234567890)www.nature.com/scientificreports/
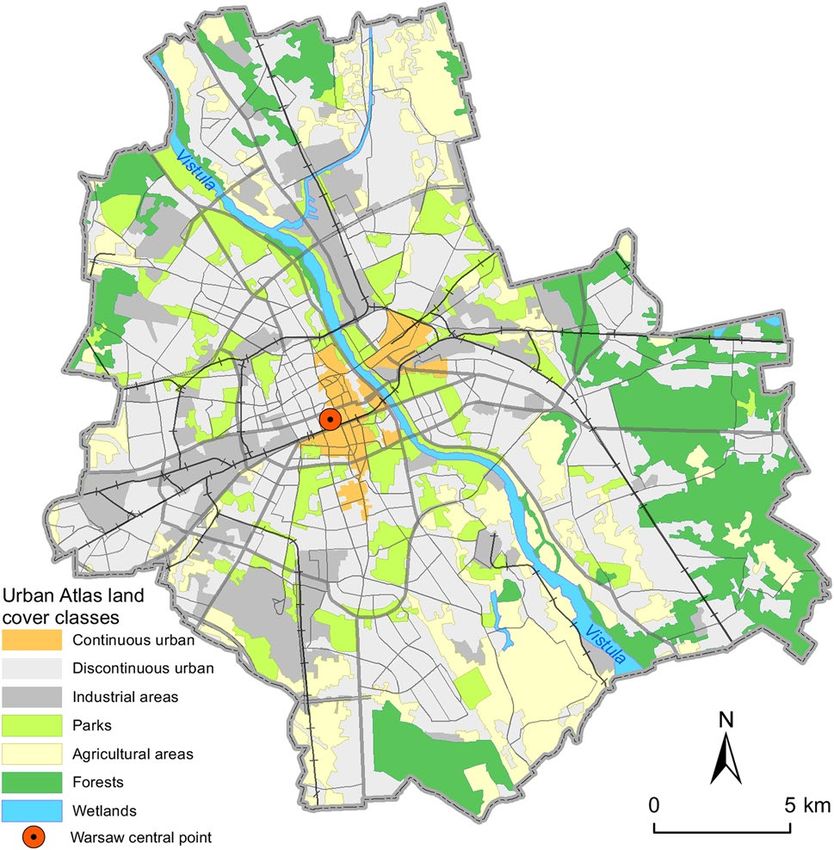
Figure 3. Presence of the red fox as confirmed by snow tracking in 29 randomly selected green areas in Warsaw
in the three study periods (data for 1976–1978 after Goszczyński J., unpbl.).
Results
Assessment of the red fox distribution in Warsaw. Signs of red fox presence were found in the whole
city, i.e. the fox presence was confirmed in each of 593 1 × 1 km2 of the grid checked between 2005 and 2012.
Process of the settlement of the red fox in the selected green areas. In 1976 to 1978, only six
(21%) of 29 selected green areas were colonized by foxes. This increased to 18 (62%) in 2004–2012 and 27 (93%)
in 2016–2019 (Fig. 3). Areas covered by forests and riparian habitats (Supplementary Table S2) were occupied in
the first study period (1976–1978) more frequently (test for goodness of fit, p = 0.031). For the other two periods
no significant differences in the selection of habitats were found (p = 0.638 and p = 0.971, respectively) (Fig. 4).
Temporal pattern of incidents involving the red fox. In the years 1998–2015, 608 incidents involving
foxes were reported; 52% of them concerned alive individuals (mostly fox sightings or trapping attempts), in 5%
injured foxes were reported. In 47% of cases foxes were found dead (mostly due to traffic collisions). The number
of reported incidents per year increased gradually from just a few cases in 1998 and 1999 to over 80 in 2015. The
number of city districts where incidents were reported also increased gradually from four and two in 1998 and
1999, respectively to 16 (out of total 18) in 2015. The highest number of reported incidents per day was three.
All three time scale predictors (time of week, day of year, time of data collection) included in the GAM
significantly influenced the probability of reporting a fox incident (Table 1). The higher probability was from
June to October, and most of the reports (58.6%, N = 314) in this period concerned fox sightings or trapping
attempts. In the remaining months, this probability was lower, and the majority of incidents involved dead
animals (54.3%, N = 289). Overall, the probability of reporting the red fox incidents in Warsaw increased over
study course (Fig. 5), and was significantly affected (p = 0.022) by time of week, being higher on working days
than weekends (Fig. 5).
Time of day (p < 0.001) also influenced the probability of a red fox incident. The incidents were reported
most often between 8 a.m. and 8 p.m. with a clear peak around noon. The biggest chance of incident report was
between 10.00 a.m. to 02.00 p.m., and lowest between 08.00 p.m. to 07.00 a.m. (Fig. 6).
Spatial patterns of incidents involving the red fox. We recorded a general negative relationship with
the proportion of forests, agricultural areas, wetlands and with an increasing distance to the Vistula River for
the buffers with radius 100, 250 and 500 m (Table 2, Fig. 7). Within 1500 m radius buffer there was a negative
relationship with an increasing distance to the Vistula River and the city centre, and a positive with the share of
discontinuous urban fabric (Table 2, Fig. 8). No collinearity was found between the variables.
Discussion
The red fox is one of the mammal species that successfully colonized many cities around the world37. Its presence
was confirmed in Warsaw more than a few decades ago. Nevertheless, at those times the red fox was assumed
to inhabit mainly fairly natural habitats (i.e. forests) and remote city areas. The aim of our study was to describe
the process of Warsaw colonization by the red fox in recent decades. A concept of the process of city coloniza-
tion assumes division into three phases: (1) arrival, (2) adjustment and (3) spread4. In this paper we focused on
the spread of the species in the city. The red fox arrival in Warsaw is hard to estimate, yet first data on the red
fox in Warsaw dates back to 1 890s59. Low population density and few sightings in the 1970s [Goszczyński J.,
unpublished] may suggest that proper spread of the red fox in Warsaw started no sooner than in the last decades.
As we showed on the basis of presence-absence data through the grid of squares, red foxes had already started
to penetrate the whole area of Warsaw. In the past decades (i.e. in the 1970s), it inhabited mostly green spaces
of more natural character (i.e. forests), while in the XXI century parks and cemeteries were occupied as often.
The red fox colonizes urban areas because of its extraordinary adaptability to settle in new habitats. Animals
may be also pushed into the city as a result of overpopulation in non-urban areas36. Previous molecular stud-
ies on colonization of urban habitats by the red fox showed that the process starts usually from a few locations
near the city borders and spreads gradually into its central parts60,61. The red fox movements through the city
Scientific Reports | (2021) 11:13931 | https://doi.org/10.1038/s41598-021-92844-2 5
Vol.:(0123456789)www.nature.com/scientificreports/
a
b
c
Figure 4. Proportion of green areas occupied by the red fox as confirmed by snow tracking, attributed to
four habitat types in Warsaw, in subsequent study periods: (a) 1976–1978 (Goszczyński J., unpbl. data), (b)
2004–2012 and (c) 2016–2019. A full circle indicates actual proportion and an empty circle indicates expected
proportion of colonized areas attributed to a certain habitat type, bars depict lower and upper bound of the
confidence interval.
can be affected by human-made infrastructures62, like railways63, roads62,64,65. Densely built-up areas are usually
avoided by foxes14,62, while specific migration corridors like roadside or railway vegetation62,66 will facilitate the
process. Indeed, in Warsaw the red fox inhabited at first the largest green areas located mainly in the outer city
districts or located in the Vistula riparian forests, a natural ecological corridor for mammals48. At the next stage,
a number of green spaces occupied by the red fox increased. City habitats are generally readily accessible by foxes
(see Douglas and S adler67), therefore after several decades of the colonization process in Warsaw, only a small
percentage of green areas under study was not used by foxes. They were highly isolated, small urban parks, often
visited by people, with limited availability of potential den sites. They were also located close to or in the strict
city centre, areas usually avoided by f oxes13,68,69.
The other part of our research was based on data derived from the Municipal Forests in Warsaw, the admin-
istration unit dealing with and collecting data on incidents with wildlife in Warsaw. This included mostly any
incidental observational data by city inhabitants or cases of traffic collisions. Such data was already used by other
researchers to study encounters between carnivores and humans or urban population trends15,21,28,31,70 and here
we wanted to evaluate its usefulness in future studies. We showed that the probability of reporting on incident
involving red foxes was dependent on different temporal variables. First, most of the incidents were noticed
Scientific Reports | (2021) 11:13931 | https://doi.org/10.1038/s41598-021-92844-2 6
Vol:.(1234567890)www.nature.com/scientificreports/
Predictors Estimate SE z or χ2 p
Model 1 (R 2
Nagelkerke = 15.9%)
Intercept − 2.69 0.06 − 44.10 < 0.001
Time of week − 0.22 0.09 − 2.30 0.022
Day of year edf = 2.21 – 18.39 < 0.001
Time of data collection edf = 1.45 – 275.80 < 0.001
Model 2 (R2Nagelkerke = 10.9%)
Intercept − 1.31 0.12 − 11.21 < 0.001
Time of day edf = 3.34 – 39.71 < 0.001
Table 1. Results of generalized additive models explaining probability of the red fox incidents in Warsaw.
‘Model 1’ analyzing the effect of time of week (weekdays vs. weekends), day of year (1–366) and time of data
collection (a day in the period 1998–2015), on the probability of an incident with the red fox in Warsaw
and the second one, ‘model 2’ analyzing the impact of time of day (hour) on the probability of fox incident.
Estimated number of degrees of freedom, standard error, z or χ2 statistics, p value and explanatory power of
each model (R2Nagelkerke) are given.
during a peak of a day (between 10.00 am and 02.00 pm), which is atypical fox activity (regardless of habitat type)
compared with most other s tudies18,28,31,39,71–73. However, it was shown that the daily activity of urban populations
of the red fox differed. In Great Britain, in a typical urban population, foxes were observed mostly during the
day40, while in Melbourne (Australia), red fox sightings at this time were very rare. This was explained by the ini-
tial stage of population development21. Therefore, we assume that the probability of reporting incidents with the
red fox in our case was dependent on human rather than red fox activity. The number of incidents involving red
foxes increased beginning from 07.00 a.m. and clearly declined after 08.00 p.m., what corresponds with highest
number of people staying o utdoor74. In Finland, Kauhala et al.31 came to the same conclusion with even clearer
peaks of observations at a few specific hours during the day. Next, we showed that the number of reported red fox
incidents on weekdays was higher when compared to weekends. This also may be attributed to higher weekday
outdoor activity of city inhabitants and higher traffic volume, thus increased probability of the red fox sighting
or vehicle collision. Finally, we showed that the peak of the red fox incidents was reported in summer and early
autumn (June–October) while being lower in the remaining months (November–April). Similar distribution of
observations during the year was in Turku in Finland31, but different in Estonian cities28. Again, we may assume
that in our case, this can be explained by both circannual activity of the red fox but also human outdoor activity.
February to April is the birth time of foxes, with spatial activity (especially of vixens) limited mainly to the area
of breeding d ens39,75–77, which is in line with recorded low number of red fox incidents at that time. However,
December to February is the mating season of red foxes when increased activity of males is observed77, so a higher
number of incidents could be expected. Here, low number of the red fox incidents was probably the result of low
human activity (as connected to unfavourable winter weather conditions) rather than fox activity. Similarly, the
peak of incidents between June and October can be related to high red fox activity (especially increasing range
of juveniles78) but also higher human outdoor activity in summer and early autumn months.
This relation between the number of the red fox incidents and human outdoor activity is also visible when
spatial patterns are analysed. The number of the red fox incidents decreased with the share of forests, meadows,
wetlands (which are natural red fox habitats79) but increased with the share of sparsely built-up areas. It was
also higher close to the city centre and to the Vistula River. Foxes inhabiting residential gardens and low-density
housing areas were observed in other cities14,80,81, yet in Warsaw dens of red foxes are hardly ever recorded in
such surrounding, they are mostly located in forests (Jackowiak M., unpbl.). At the same time, in the city centre
and in areas with low-density housing the outdoor activity and presence of people is h igh82, which may favour
more frequent fox observations. The Vistula River in turn, goes through the whole of Warsaw (including its city
centre), serving as an ecological corridor but also a popular recreational area, so wildlife-human encounters here
are likely. Similar results were obtained in Turku31 and in V ienna71.
The eagerness to report the fact of observing a wild animal, depends on observer’s m otivation26, and in our
study may be explained by people concerned about the presence of carnivorous mammals (in this case the red
fox) in cities. As revealed in a questionnaire study in Germany, the majority of inhabitants were not afraid of foxes
and were generally pleased with fox presence, yet had their concerns about potential zoonotic diseases30. The red
fox is one of the most important vectors of zoonoses and their presence in cities may affect the spread of epidemic
risks31,83–85. In Poland and in Warsaw, rabies, as the most dangerous fox-transmitted disease, is still present in
fox population86 but also frequent cases of mange occur (Jackowiak M., unpbl.). Due to this red fox encounters
arise usually anxiety in city inhabitants who, in such situations, may willingly seek help from wildlife services.
Although, human activity influences the number of the red fox o bservations43,71, fox sightings were used
to estimate population abundance and how it changed (e.g.20,36,42,87). In our study, the probability of a red fox
incident rose over time, which points to a population increase. Yet, it should be kept in mind that during our
study, access to the Internet (thus information on urban wildlife), and mobile phones increased rapidly, which
possibly also boosted the number of the red fox incidents reported.
In our study we showed the process of red fox settlement in Warsaw, the capital city of Poland. At first, the
red fox colonised mainly green areas of more natural character and placed further from the city centre, gradually
Scientific Reports | (2021) 11:13931 | https://doi.org/10.1038/s41598-021-92844-2 7
Vol.:(0123456789)www.nature.com/scientificreports/
a
b
Figure 5. Probability of the red fox incident (a) during a year and (b) in the whole research period with
comparison between weekdays and weekends as based on the reports on fox incidents in the city area (1998–
2015), delivered by the Municipal Forests—Warsaw.
Figure 6. Modelled number of the red fox incidents per minute during the day as based on the reports on the
red fox incidents in the city area (1998–2015), delivered by the Municipal Forests—Warsaw.
Scientific Reports | (2021) 11:13931 | https://doi.org/10.1038/s41598-021-92844-2 8
Vol:.(1234567890)www.nature.com/scientificreports/
Predictors Estimate SE Z p
100 m radius (R2Tjur = 0.069; AUC = 0.684)
Intercept − 0.38845 0.12804 − 3.03368 0.002
Distance to the Vistula river − 0.00016 0.00003 − 5.69064 < 0.001
Share of forests − 0.00005 0.00001 − 4.58908 < 0.001
Share of agricultural areas − 0.00004 0.00001 − 4.00039 < 0.001
Share of wetlands − 0.00007 0.00003 − 2.62905 0.009
250 m radius (R2Tjur = 0.065; AUC = 0.678)
Intercept − 0.34782 0.13128 − 2.64937 0.008
Distance to the Vistula River − 0.00017 0.00003 − 5.80572 < 0.001
Share of forests − 0.00001 0.00000 − 4.42650 < 0.001
Share of agricultural areas − 0.00001 0.00000 − 3.55513 < 0.001
Share of wetlands − 0.00001 0.00001 − 2.79133 0.005
500 m radius (R2Tjur = 0.060; AUC = 0.672)
Intercept − 0.29848 0.13850 − 2.15513 0.031
Distance to the Vistula river − 0.00017 0.00003 − 5.74674 < 0.001
Share of forests − 0.00000 0.00000 − 4.19826 < 0.001
Share of agricultural areas − 0.00000 0.00000 − 3.32188 0.001
SHARE of wetlands − 0.00000 0.00000 − 2.71936 0.007
1500 m radius (R2Tjur = 0.045; AUC = 0.648)
Intercept − 0.69091 0.25402 − 2.71995 0.007
Distance to the Vistula river − 0.00015 0.00003 − 5.16528 < 0.001
Distance to the city centre − 0.00005 0.00002 − 2.63165 0.008
Share of discontinuous urban fabric 0.00000 0.00000 2.56185 0.010
Table 2. Influence of habitat characteristics on the probability if the red fox incident in Warsaw. Results of
the logistic regression models for 100, 250, 500 and 1500 buffer radius around location of red fox incident in
Warsaw in 1998–2015 has been presented. The explanatory ability of models ( R2Tjur and AUC) is given.
expanding throughout the city. The red fox requires three factors that are crucial for urban population exist-
ence—access to daytime resting sites, convenient breeding sites and food a vailability88. Wide distribution of the
red fox in Warsaw proves that these conditions are fulfilled and the abundance of the red fox population will
probably further increase. For decades, red fox was heavily hunted (and poached) as pest (preying on small game
and domestic animals, mostly poultry) but also for its valuable f ur79 so red foxes avoided people (e.g. they had
their dens almost exclusively in forests89). This has changed in the last (approximately) twenty years, i.e. red fox
abundance increased thanks to anti-rabies v accinations90. This increase in population abundance and, assum-
ingly, lowering fear of human will lead to higher tolerance of red foxes to closer contacts with people. With the
red fox settlements in more human-transformed habitats within city boundaries, red fox-human encounters
(and possibly also conflicts) will also increase. This will affect epidemiological risks. Thus, the urban red fox
monitoring remains essential for the risk assessment and proper population management. Nevertheless, as we
shown in this study, incidental red fox sightings by city inhabitants should be treated with caution. Being highly
influenced by patterns of human outdoor activity and people attitudes towards wildlife (driven also by health
concerns) they only partially reflect real population abundance trends as well as temporal and spatial activity
patterns of this medium-sized carnivore.
Scientific Reports | (2021) 11:13931 | https://doi.org/10.1038/s41598-021-92844-2 9
Vol.:(0123456789)www.nature.com/scientificreports/
Figure 7. Expected probability of the red fox incidents as based on the reports (1998–2015), delivered by the
Municipal Forests—Warsaw, in relation to distance to (a) the Vistula river (an ecological corridor), (b) share of
forest, (c) share of agricultural areas, and (d) share of wetlands within 100 m radius around location of red fox
incident. Explanatory variables that were significant in the logistic regression model (see Table 2) are shown.
Figure 8. Probability of the red fox incident as based on the reports (1998–2015), delivered by the Municipal
Forests—Warsaw, in relation to distance to (a) the Vistula river, (b) the city centre and (c) share of discontinuous
urban fabric within 1500 m radius around location of red fox incident. Explanatory variables that were
significant in the logistic regression model (see Table 2) are shown.
Scientific Reports | (2021) 11:13931 | https://doi.org/10.1038/s41598-021-92844-2 10
Vol:.(1234567890)www.nature.com/scientificreports/
Received: 2 April 2021; Accepted: 10 June 2021
References
1. Baker, P. J., Newman, T. & Harris, S. Bristol’s foxes—40 years of change. Br. Wildl. 12, 411–417 (2001).
2. Vuorisalo, T. et al. Urban development from an avian perspective: Causes of hooded crow (Corvus corone cornix) urbanization in
two Finnish cities. Landsc. Urban Plan. 62, 69–87 (2003).
3. Baker, P. J. & Harris, S. Urban mammals: What does the future hold? An analysis of the factors affecting patterns of use of residential
gardens in Great Britain. Mammal Rev. 37, 297–315 (2007).
4. Evans, K. L., Hatchwell, B. J., Parnell, M. & Gaston, K. J. A conceptual framework for the colonization of urban areas: The blackbird
Turdus merula as a case study. Biol. Rev. 85, 643–667 (2010).
5. Geiger, M., Taucher, A. L., Gloor, S., Hegglin, D. & Bontadina, F. In the footsteps of city foxes: Evidence for a rise of urban badger
populations in Switzerland. Hystrix It. J. Mamm. 29, 236–238 (2018).
6. Lesiński, G., Gryz, J., Krauze-Gryz, D. & Stolarz, P. Population increase and synurbization of the yellow-necked mouse Apodemus
flavicollis in some wooded areas of Warsaw agglomeration, Poland, in the years 1983–2018. Urban Ecosyst. 24, 481–489 (2021).
7. Andrzejewski, R., Babińska-Werka, J., Gliwicz, J. & Goszczyński, J. Synurbization processes in population of Apodemus agrarius.
I. Characteristics of populations in an urbanization gradient. Acta Theriol. 23, 341–358 (1978).
8. Doncaster, C. P. & MacDonald, D. W. Drifting territoriality in the red fox Vulpes vulpes. J. Anim. Ecol. 60, 423–439 (1991).
9. Baker, P. J., Ansell, R. J., Dodds, P. A. A., Webber, C. E. & Harris, S. Factors affecting the distribution of small mammals in urban
areas. Mammal Rev. 33, 95–100 (2003).
10. Baker, P. J., Dowding, C. V., Molony, S. E., White, P. C. L. & Harris, S. Activity patterns of urban red foxes (Vulpes vulpes) reduce
the risk of traffic-induced mortality. Behav. Ecol. 35, 716–724 (2007).
11. Bateman, P. W. & Fleming, P. A. Big city life: Carnivores in urban environments. J. Zool. 287, 1–23 (2012).
12. Harris, S. Distribution, habitat utilisation and age structure of a suburban fox (Vulpes vulpes) population. Mammal Rev. 7, 25–39
(1977).
13. Harris, S. & Rayner, J. M. V. Urban fox (Vulpes vulpes) population estimates and habitat requirements in several British cities. J.
Anim. Ecol. 55, 575–591 (1986).
14. Adkins, C. A. & Stott, P. Home ranges, movements and habitat associations of red foxes Vulpes vulpes in suburban Toronto, Ontario,
Canada. J. Zool. 244, 335–346 (1998).
15. Duduś, L., Zalewski, A., Kozioł, O., Jakubiec, Z. & Król, N. Habitat selection by two predators in an urban area: The stone marten
and red fox in Wrocław (SW Poland). Mamm. Biol. 79, 71–76 (2014).
16. Harris, S. The food of suburban foxes (Vulpes vulpes) with special reference to London. Mammal Rev. 11, 151–168 (1981).
17. Doncaster, C. P., Dickman, C. R. & MacDonald, D. W. Feeding ecology of red foxes (Vulpes vulpes) in the city of Oxford, England.
J. Mammal. 71, 188–194 (1990).
18. Saunders, G., White, P. C. L., Harris, S. & Rayner, J. M. V. Urban foxes (Vulpes vulpes)—Food acquisition, time and energy budget-
ing of a generalized predator. Symp. Zool. Soc. Lond. 65, 215–234 (1993).
19. Contesse, P., Hegglin, D., Gloor, S., Bontadina, F. & Deplazes, P. The diet of urban foxes (Vulpes vulpes) in the city of Zurich,
Switzerland. Mamm. Biol. 69, 81–95 (2004).
20. Harris, S. An estimation of the number of foxes (Vulpes vulpes) in the city of Bristol and some possible factors affecting their
distribution. J. Appl. Ecol. 18, 455–465 (1981).
21. Marks, C. A. & Bloomfield, T. E. Distribution and density estimates for urban foxes (Vulpes vulpes) in Melbourne: Implications
for rabies control. Wildl. Res. 26, 763–775 (1999).
22. Gloor, S. The rise of urban foxes (Vulpes vulpes) in Switzerland and ecological and parasitological aspects of a population in the
recently colonised city of Zurich. Dissertation thesis (University of Zurich, 2002).
23. Gosselink, T. E., van Deelen, T. R., Warner, B. E. & Joselyn, M. G. Temporal habitat partitioning and spatial use of coyotes and red
foxes in east-central Illinois. J. Wildl. Manag. 55, 433–441 (2003).
24. Gosselink, T. E., van Deelen, T. R., Warner, R. E. & Mankin, P. C. Survival and cause-specific mortality of red foxes in agricultural
and urban areas of Illinois. J. Wildl. Manag. 7, 1862–1873 (2007).
25. Soulsbury, C. D. et al. The impact of sarcoptic mange Sarcoptes scabiei on the British fox Vulpes vulpes population. Mammal Rev.
37, 278–296 (2007).
26. Macdonald, D. Running with the Fox (Unwin Hyman, 1987).
27. Lewis, J. C., Sallee, K. L. & Golightly, Jr R. T. Introduced red fox in California. http://morro-bay.com/educational/research-repor
ts/red-fox--california-introduced-research-93_10.pdf (1993).
28. Plumer, L., Davison, J. & Saarma, U. Rapid urbanization of red foxes in Estonia: Distribution, behaviour, attacks on domestic
animals and health-risks related to zoonotic diseases. PLoS ONE 9, e115124. https://d oi.o
rg/1 0.1 371/j ourna l.p
one.0 11512 4 (2014).
29. Sogliani, D. & Mori, E. ‘The Fox and the Cat’: Sometimes they do not agree. Mamm. Biol. 95, 150–154 (2019).
30. König, A. Fears, attitudes and opinions of suburban residents with regards to their urban foxes. Eur. J. Wildl. Res. 54, 101–109
(2008).
31. Kauhala, K., Talvitie, K. & Vuorisalo, T. Encounters between medium-sized carnivores and humans in the city of Turku, SW
Finland, with special reference to the red fox. Mammal Res. 61, 25–33 (2016).
32. Teagle, W. G. The fox in the London suburbs. Lond. Nat. 46, 44–68 (1967).
33. Pagh, S. The history of urban foxes in Aarhus and Copenhagen, Denmark. Lutra 51, 51–55 (2008).
34. Vuorisalo, T., Talvitie, K., Kauhala, K., Blauerc, A. & Lahtinene, R. Urban red foxes (Vulpes vulpes L.) in Finland: A historical
perspective. Landsc. Urban Plan. 124, 109–117 (2014).
35. Seebeck, J. H. Mammals in the Melbourne metropolitan area. Vic. Nat. 94, 165–171 (1977).
36. Gloor, S., Bontadina, F., Hegglin, D., Deplazes, P. & Breitenmoser, U. The rise of urban fox populations in Switzerland. Mamm.
Biol. 66, 155–164 (2001).
37. Soulsbury, C. D., Baker, P. J., Iossa, G. & Harris, S. Red foxes (Vulpes vulpes). In Urban Carnivores Ecology, Conflict, and Conserva-
tion (eds Gehrt, S. D. et al.) 63–75 (The Johns Hopkins University Press, 2010).
38. Chautan, M., Pontier, D. & Artois, M. The role of rabies in recent demographic changes in red fox populations in Europe. Mam-
malia 46, 391–410 (2000).
39. Doncaster, C. P. & MacDonald, D. W. Activity patterns and interactions of red fox (Vulpes vulpes) in Oxford city. J. Zool. 241, 73–87
(1997).
40. Harris, S. Surveying the urban fox. Biologist 35, 259–264 (1985).
41. Uraguchi, K., Yamamura, K. & Saitoh, T. Estimating number of families for an urban fox population by using two public data sets.
Popul. Ecol. 51, 1–7 (2009).
42. Scott, D. M. et al. A citizen science based survey method for estimating the density of urban carnivores. PLoS ONE 13, e0197445.
https://doi.org/10.1371/journal.pone.0197445 (2018).
43. Sadlier, L. M. J., Webbon, C. C., Baker, P. J. & Harris, S. Methods of monitoring red foxes Vulpes vulpes and badgers Meles meles:
Are field signs the answer?. Mammal Rev. 34, 75–98 (2004).
Scientific Reports | (2021) 11:13931 | https://doi.org/10.1038/s41598-021-92844-2 11
Vol.:(0123456789)www.nature.com/scientificreports/
44. Baker, P. J., Harris, S., Robertson, C. P. J., Saunders, G. & White, P. C. L. Is it possible to monitor mammal population changes
from counts of road traffic casualties? An analysis using Bristol’s red foxes Vulpes vulpes as an example. Mammal Rev. 34, 115–130
(2004).
45. Statistics Poland. Statistical Yearbook of Warsaw (Zakład Wydawnictw Statystycznych, 2019).
46. Climate-data.org. https://pl.climate-data.org/europa/polska/masovian-voivodeship/warszawa-4560/ (2020).
47. Goszczyński, J. & Romanowski, J. The mammals of the between-floodbanks area of the Middle Vistula Valley. In The Between
Floodbanks Area of the Vistula as an Unique Natural System (Pilica-Narew section) (eds Matuszkiewicz, J. M. & Roo-Zielińska, E.)
107–117 (Polish Academy of Sciences, 2000).
48. Romanowski, J. Vistula River valley as the ecological corridor for mammals. Pol. J. Ecol. 55, 805–819 (2007).
49. Romanowski, J., Kowalczyk, K. & Rau, K. Population viability modelling and potential threats to the beaver in the Vistula River
valley, Poland. Ann. Zool. Fenn. 45, 323–328 (2008).
50. Luniak, M., Kozłowski, P. & Nowicki, W. Magpie Pica pica in Warsaw—abundance, distribution and changes in its population.
Acta Ornithol. 32, 77–86 (1997).
51. Gryz, J., Lesiński, G., Krauze-Gryz, D. & Stolarz, P. Woodland reserves within an urban agglomeration as important refuges for
small mammals. Folia For. Pol. Ser. A For. 59, 3–13 (2017).
52. Sison, C. P. & Glaz, J. Simultaneous confidence intervals and sample size determination for multinomial proportions. J. Am. Stat.
Assoc. 90, 366–369 (1995).
53. Signorell, A. et al. DescTools: Tools for descriptive statistics. R package version 0.99. 26. The Comprehensive R Archive Network
(2018).
54. Wood, S. N. Generalized Additive Models: An Introduction with R (Chapman and Hall/CRC, 2006).
55. Wood, S. N. Fast stable restricted maximum likelihood and marginal likelihood estimation of semiparametric generalized linear
models: Estimation of semiparametric generalized linear models. J. R. Stat. Soc. Ser. B Stat. Methodol. 73, 3–36 (2011).
56. Copernicus ,. Mapping Guide for an European Urban Atlas (European Union, 2018).
57. R Core Team. R: A Language and Environment for Statistical Computing (R Foundation for Statistical Computing, 2019).
58. ESRI. ArcGIS Desktop: Release 10 (Enviromental Systems Research Institute, 2011).
59. Wałecki, A. Fauna zwierząt ssących Warszawy i jej stosunek do fauny całego kraju in Pamiętnik Fizjograficzny Vol. 1, 268–291 (E.
Dziewulski i Br. Znatowicz, 1881).
60. Wandeler, P., Funk, S. M., Largiader, C. R., Gloor, S. & Breitenmoster, U. The city-fox phenomenon: Genetic consequences of a
recent colonization of urban habitat. Mol. Ecol. 12, 647–656 (2003).
61. DeCandia, A. L. et al. Urban colonization through multiple genetic lenses: The city-fox phenomenon revisited. Ecol. Evol. 9,
2046–2060 (2019).
62. Kimmig, S. E. et al. Beyond the landscape: Resistance modelling infers physical and behavioural gene flow barriers to a mobile
carnivore across a metropolitan area. Mol. Ecol. 29, 466–484 (2020).
63. Kato, Y. et al. Population genetic structure of the urban fox in Sapporo, northern Japan. J. Zool. 301, 118–124 (2017).
64. Baker, P. J., Dowding, C. V., Molony, S. E., White, P. C. L. & Harris, S. Activity patterns of urban red foxes (Vulpes vulpes) reduce
the risk of traffic-induced mortality. Behav. Ecol. 18, 716–724 (2007).
65. Gehrt, S. D. The urban ecosystem. In Urban Carnivores Ecology, Conflict, and Conservation (eds Gehrt, S. D. et al.) 3–11 (The Johns
Hopkins University Press, 2010).
66. Kolb, H. H. Factors affecting the movements of dog foxes in Edinburgh. J. Appl. Ecol. 21, 161–173 (1984).
67. Douglas, I. & Sadler, J. P. Urban wildlife corridors. Conduits for movement or linear habitats? In The Routledge Handbook of Urban
Ecology (eds Douglas, I. et al.) 274–288 (Routledge, 2011).
68. Tsukada, H., Morishima, Y., Nonaka, N., Oku, Y. & Kamiya, M. Preliminary study of the role of red foxes in Echinococcus multi-
locularis transmission in the urban area of Sapporo, Japan. Parasitology 120, 423–428 (2000).
69. Robinson, N. A. & Marks, C. A. Genetic structure and dispersal of red foxes (Vulpes vulpes) in urban Melbourne. Aust. J. Zool. 49,
589–601 (2001).
70. Walter, T., Zink, R., Laaha, G., Zaller, J. G. & Heigl, F. Fox sightings in a city are related to certain land use classes and sociodemo-
graphics: Results from a citizen science project. BMC Ecol. 18, 50. https://doi.org/10.1186/s12898-018-0207-7 (2018).
71. Cavallini, P. & Lovari, S. Home range, habitat selection and activity of the red fox in a Mediterranean coastal ecotone. Acta Theriol.
39, 279–287 (1994).
72. Frey, S. N. & Conover, M. R. Habitat use by meso-predators in a corridor environment. J. Wildl. Manag. 70, 1111–1118 (2006).
73. Díaz-Ruíz, F., Caro, J., Delibes-Mateos, M., Arroyo, B. & Ferreras, P. Drivers of red fox (Vulpes vulpes) daily activity: Prey avail-
ability, human disturbance or habitat structure?. J. Zool. 298, 128–138 (2016).
74. Gaffron, P. Urban transport, environmental justice and human daily activity patterns. Transp. Policy 20, 114–127 (2012).
75. Eguchi, K. & Nakazano, T. Activity studies of Japanese red foxes, Vulpes vulpes japonica Gray. Jpn. J. Ecol. 30, 9–17 (1980).
76. Travaini, A., Aldama, J. J., Laffitte, R. & Delibes, M. Home range and activity patterns of red fox Vulpes vulpes breeding females.
Acta Theriol. 38, 427–434 (1993).
77. Cavallini, P. Ranging behaviour of red foxes during the mating and breeding seasons. Ethol. Ecol. Evol. 8, 57–65 (1996).
78. Robertson, C. P. J., Baker, P. J. & Harris, S. Ranging behaviour of juvenile red foxes and its implications for management. Acta
Theriol. 45, 525–535 (2000).
79. Goszczyński, J. Lis. Monografia przyrodniczo-łowiecka (OIKOS Oficyna Wydawnicza, 1995).
80. Tolhurst, B. A., Baker, R. J., Cagnacci, F. & Scott, D. M. Spatial aspects of gardens drive ranging in urban foxes (Vulpes vulpes): The
resource dispersion hypothesis revisited. Animals 10, 1167. https://doi.org/10.3390/ani10071167 (2020).
81. Hofer, S. et al. High prevalence of Echinococcus multilocularis in urban red foxes (Vulpes vulpes) and voles (Arvicola terrestris) in
the city of Zurich, Switzerland. Parasitology 120, 135–142 (2000).
82. Jiang, S., Ferreira, Jr J. & Gonzalez, M. C. Discovering urban spatial–temporal structure from human activity patterns. In Proceed-
ings of the ACM SIGKDD International Workshop on Urban Computing (UrbComp ’12) (ACM New York, 2012).
83. Newman, T. J. et al. Changes in red fox habitat preference and rest site fidelity following a disease-induced population decline.
Acta Theriol. 48, 79–91 (2003).
84. Fischer, C., Reperant, L., Weber, J. M., Ochs, H. & Deplazes, P. Relation in the presence of various parasites in the red fox (Vulpes
vulpes) in Geneva. Swiss Med. Wkly. 133, 61 (2003).
85. Deplazes, S., Hegglin, D., Gloor, S. & Romig, T. Wilderness in the city: The urbanization of Echinococcus multilocularis. Trends
Parasitol. 20, 77–84 (2004).
86. Official Website of Republic of Poland. https://www.gov.pl/web/uw-mazowiecki/obszar-zagrozony-wscieklizna-na-terenie-wojew
odztwa-mazowieckiego (2021).
87. Wilkinson, D. & Smith, G. C. A preliminary survey for changes in urban fox (Vulpes vulpes) densities in England and Wales, and
implications for rabies control. Mammal Rev. 31, 107–110 (2001).
88. Baker, P. J., Funk, S. M., Harris, S. & White, P. C. L. Flexible spatial organization of urban foxes, Vulpes vulpes, before and during
an outbreak of sarcoptic mange. Anim. Behav. 59, 127–146 (2000).
89. Goszczyński, J. The effect of structural differentation of ecological landscape on the predator–prey interaction. Treatises Monogr.
46, 1–80 (1985).
Scientific Reports | (2021) 11:13931 | https://doi.org/10.1038/s41598-021-92844-2 12
Vol:.(1234567890)www.nature.com/scientificreports/
90. Goszczyński, J., Misiorowska, M. & Juszko, S. Changes in the density and spatial distribution of red fox dens and cub numbers in
central Poland following rabies vaccination. Acta Theriol. 53, 121–127 (2008).
Acknowledgements
The authors would like to thank the employees of the Municipal Forests—Warsaw for the data provided on the
red fox incidents in the city and any reports of foxes in urban forests. We also would like to thank professor
Joanna Babińska-Werka, who helped to gather the data from the Municipal Forest—Warsaw, and Marta Jobda
for help with fieldwork. We dedicate this paper to late professor Jacek Goszczyński, the pioneer of the red fox
research in Warsaw and central Poland, who initiated this research.
Author contributions
J.G., K.J. and D.K.G. designed the study; M.J., J.G., K.J., P.K. and D.K.G. collected the data; M.J., K.J., M.B., L.B.
and D.K.G. analysed the data; M.J. and D.K.G. led the writing of the manuscript. All authors read and approved
the final manuscript.
Competing interests
The authors declare no competing interests.
Additional information
Supplementary Information The online version contains supplementary material available at https://doi.org/
10.1038/s41598-021-92844-2.
Correspondence and requests for materials should be addressed to M.J. or D.K.-G.
Reprints and permissions information is available at www.nature.com/reprints.
Publisher’s note Springer Nature remains neutral with regard to jurisdictional claims in published maps and
institutional affiliations.
Open Access This article is licensed under a Creative Commons Attribution 4.0 International
License, which permits use, sharing, adaptation, distribution and reproduction in any medium or
format, as long as you give appropriate credit to the original author(s) and the source, provide a link to the
Creative Commons licence, and indicate if changes were made. The images or other third party material in this
article are included in the article’s Creative Commons licence, unless indicated otherwise in a credit line to the
material. If material is not included in the article’s Creative Commons licence and your intended use is not
permitted by statutory regulation or exceeds the permitted use, you will need to obtain permission directly from
the copyright holder. To view a copy of this licence, visit http://creativecommons.org/licenses/by/4.0/.
© The Author(s) 2021
Scientific Reports | (2021) 11:13931 | https://doi.org/10.1038/s41598-021-92844-2 13
Vol.:(0123456789)You can also read