College and Career Readiness - Blueprint for Maryland's Future: Roadmap to Implementation
←
→
Page content transcription
If your browser does not render page correctly, please read the page content below

The Blueprint for Maryland’s Future: College and Career Readiness                                    August 2022

Blueprint for Maryland’s Future:

College and
Career Readiness

   Roadmap to Implementation

   August 2022                   | Version 2

                                                                     Maryland State Department of Education   |   4
The Blueprint for Maryland’s Future: College and Career Readiness                                    August 2022

     MARYLAND STATE DEPARTMENT OF EDUCATION

Mohammed Choudhury
State Superintendent of Schools

Deann Collins, Ed.D.
Deputy Superintendent

Larry Hogan
Governor

     MARYLAND STATE BOARD OF EDUCATION

 Clarence C. Crawford
 President, Maryland State Board of Education

 Charles R. Dashiell, Jr., Esq. (Vice President)

 Shawn D. Bartley, Esq.

 Gail Bates

 Chuen-Chin Bianca Chang

 Susan J. Getty, Ed.D.

 Vermelle Greene, Ph.D.

 Jean C. Halle

 Dr. Joan Mele-McCarthy

 Rachel L. McCusker

 Lori Morrow

 Brigadier General Warner I. Sumpter (Ret.)

 Holly C. Wilcox, Ph.D.

 Merin Thomas (Student Member)

                                                                    Maryland State Department of Education   |   5
The Blueprint for Maryland’s Future: College and Career Readiness                                                                                                                                   August 2022

Table of Contents

Executive Summary ......................................................................................................................................................................................... 7

Background ......................................................................................................................................................................................................... 8

Section 1: CCR Standard .............................................................................................................................................................................13

Section 2: Curriculum Alignment and Changes ..................................................................................................................................23

Section 3: Assessments ................................................................................................................................................................................43

Section 4: Post-CCR Pathways .................................................................................................................................................................46

Section 5: Student Support Pathway ......................................................................................................................................................65

Section 6: Early Warning Indicators ........................................................................................................................................................73

Section 7: Finance and CCR ........................................................................................................................................................................78

Section 8: Coordination and Engagement ............................................................................................................................................81

Document History
The first version of this report was published in February 2022.

Version 2 of this report, this current version was published in August 2022. The sections with new or updated
information, data, and discussion are listed below:

Apprenticeships ..............................................................................................................................................................................................52

CCR Implementation Timeline .................................................................................................................................................................... 7

Early Warning Indicators.............................................................................................................................................................................76

Empirical Research Study ............................................................................................................................................................................15

End of Course Assessments .......................................................................................................................................................................43

Finance ...............................................................................................................................................................................................................78

Graduation Rate Data ...................................................................................................................................................................................15

High-Quality Instructional Materials .....................................................................................................................................................23

Industry Credentials .....................................................................................................................................................................................46

Interim Standard .............................................................................................................................................................................................13

Multiple Measures Placement Systems .................................................................................................................................................17

                                                                                                                                             Maryland State Department of Education                             |    6
The Blueprint for Maryland’s Future: College and Career Readiness                                                August 2022

Executive Summary
The Blueprint for Maryland’s Future was passed by the 2021 Maryland General Assembly session and now
serves as the Maryland State Department of Education’s driving force for making significant and lasting
changes in its transformation to a world-class instructional system to improve the overall quality of
education in Maryland. It presents an extraordinary opportunity and a pledge that all of Maryland’s over
910,000 students will receive an excellent and equitable education, especially those who have been
historically underserved. To fully implement The Blueprint, the Maryland State Department of Education is
determined to engage diverse stakeholders, researchers, and subject-matter experts to ensure all new
policies and innovative approaches are in alignment with each of the five key policy areas.

The Blueprint for Maryland’s Future Policy Areas:

                 Policy Area 1                        •Early Childhood Education

                 Policy Area 2                        •High-Quality and Diverse Teachers and Leaders

                 Policy Area 3                        •College and Career Readiness

                 Policy Area 4                        •More Resources for Student Success

                 Policy Area 5                        •Governance and Acccountability

This report presents an update on the preparation for implementing Policy Area 3: College and Career Readiness,
which reimagines what today’s students must know and be able to do by the end of the 10th grade. The Blueprint
establishes the standard that will signify a student is college and career ready. Once a student is designated as
meeting or exceeding the CCR standard, they choose which of three equally challenging Post-CCR pathways they
want to pursue. For students who need additional support to meet the CCR standard, they will receive
customized individualized supports.

Through the input of key stakeholders, MSDE has identified guiding principles for the implementation of a new
CCR system, grounding in:

       •    Moving beyond using standardized test scores as the only measure of CCR

       •    Equitable access to Post-CCR Pathways

       •    Post-CCR Pathways that enable students to explore elective enrichment and academic opportunities
In late 2021 and early 2022, MSDE reviewed the time necessary for LEAs to design and successfully implement
any new or updated courses and programs, and MSDE found that the implementation dates specified in HB 1372
(2021) would need to be altered to ensure successful implementation and alignment between Post-CCR and
Support Pathways. MSDE worked with the Accountability and Implementation Board and the General Assembly
to ensure that the upcoming process allows for the best opportunities for students. In the Spring of 2022, the
General Assembly passed HB 1450 (2022)1, which created alignment between the Post-CCR pathways and the
Support pathways, with both pathways now beginning in the 2023-2024 school year.

1
    https://mgaleg.maryland.gov/mgawebsite/Legislation/Details/hb1450

                                                                                Maryland State Department of Education   |   7
The Blueprint for Maryland’s Future: College and Career Readiness                                                           August 2022

Background
By The Numbers: A Look At State Academic Data
Student achievement, graduation rate, and postsecondary enrollment data for Maryland students,
especially for underserved student populations, signal the need to rethink how we prepare our students to
succeed in and through college and in their careers. Standardized assessments, including the Maryland
Comprehensive Assessment Program (MCAP) and the Partnership for Assessment of Readiness for College
and Career (PARCC) measure student learning and communicate whether students meet or exceed grade
level expectations for the Maryland College and Career Ready Standards for English language arts and
mathematics.2 Since 2015, the scores achieved in these standardized assessments, graduation rates, and
postsecondary college enrollment have been used to assess students’ progression towards postsecondary
success and areas of improvement.

STUDENT ACHIEVEMENT DATA: STATE STANDARDIZED TESTS

From 2015-2019, annual PARCC scores assessed student learning and served as standardized data sources for
school systems and schools to identify and to provide interventions or enrichment to students based on grade
level content. 3

In 2019 less than half of students in grades 3-8 English Language Arts scored proficient and just over 50 percent
met the College and Career Ready Standard by grade 10. Figure 1 shows the percentage of students who scored
“proficient,” defined as scoring a level 4 or 5, out of 5 performance levels, on the English Language Arts/Literacy
PARCC exams.

Figure 1: English Language Arts Proficiency Rates by Grade Level, PARCC 2019

                   100%
                                            56.3%                          43.8%
                    90%

                    80%

                    70%

                    60%

                    50%                                                    56.2%                       Not Proficient

                    40%                                                                                Proficient
                                            43.7%
                    30%

                    20%

                    10%

                      0%
                                           ELA 3-8                         ELA 10

Note: ELA 10 proficiency rates only include first time test takers.

2 Maryland College and Career Ready Resources https://marylandpublicschools.org/programs/Pages/MD-CCRS/index.aspx

3 Additional data and information not
                                    included in this discussion is available on MSDE’s website. For a complete understanding of Maryland
students’ performance on standardized assessments, please see: https://marylandpublicschools.org/stateboard/Documents/08272019/TabD-
MCAP.pdf

                                                                                         Maryland State Department of Education    |   8
The Blueprint for Maryland’s Future: College and Career Readiness                                                            August 2022

Less than 40% of students at all grade levels met the standard for proficiency in math in 2019. Figure 2 shows the
percentage of students who scored proficient, defined as performance level 4 or higher (out of 5 levels), on the
PARCC Mathematics exams.

Figure 2: Mathematics Proficiency Rates by Grade Level, PARCC 2019

                   100%
                                            67.0%                           61.6%
                     90%

                     80%

                     70%

                     60%

                     50%                                                                                Not Proficient

                     40%                                                                                Proficient
                                                                            38.4%
                     30%
                                            33.0%
                     20%

                     10%

                      0%
                                          Math 3-8                         Algebra I

Note: Algebra I proficiency rates only include first time test takers.

Beginning in the 2020-2021 school year, Maryland implemented the MCAP assessment program. Students were
first assessed in the fall of 2021 (rather than at the close of the prior school year). This Early Fall 2021 data
showed an even further decline in student proficiency in English and math. While Maryland’s overall results
reflect similar trends seen nationally, MCAP proficiency rates of 35% in English Language Arts and 15% in
mathematics for grades 3-8 are alarming.4 English results show almost a nine-percentage point decline from
2019, while mathematics results indicate an 18-percentage point decline, or less than half of the 2019 rate.

State assessment data also shows large disparities in performance between student groups. For example, in 2019,
72.5% of Asian students scored “proficient” on PARCC tests in English in grades 3-8, compared to 58.8% of White
students, 29.5% of Hispanic/Latino students, and 28.3% of Black/African American students. The differences in
the proficiency between the groups with the highest and lowest rates has largely remained constant from 2015
and persist despite any overall gains in achievement throughout the state over the same period of time.
Disaggregated data by race/ethnicity for PARCC results is illustrated by Figure 3.

4 Press Release, December 8, 2021. Maryland Early Fall Assessment Data and Kindergarten Readiness Results Reflect National Trends on

Learning Loss. https://news.maryland.gov/msde/maryland-early-fall-assessment-data-and-kindergarten-readiness-results-reflect-national-
trends-on-learning-loss/

                                                                                          Maryland State Department of Education       |   9
The Blueprint for Maryland’s Future: College and Career Readiness                                               August 2022

Figure 3: Percent of Students at Performance Level 4 or Higher by Race/Ethnicity, ELA 3-8

 100%
                                                                                        Asian
   90%

   80%                                                                                  White
                                                                    72.4%
   70%       65.8%
                                                                    58.8%               Two or more races
   60%
             52.4%
                                                                                        Native Hawaiian or Other
   50%
                                                                                        Pacific Islander
   40%                                                                                  All Students
                                                                    29.5%
   30%
         24.6%                                                                          American Indian or Alaskan
                                                                    28.3%               Native
   20%
             22.7%
                                                                                        Hispanic/Latino of any race
   10%

    0%                                                                                  Black or African American
             2015           2016           2017           2018      2019

Mathematics data show a similarly concerning trend. Figure 4 shows a gap of approximately 50 percentage points
in the proficiency rates between the highest and lowest performing groups in math grades 3-8.

Figure 4: Percent of Students at Performance Level 4 or Higher by Race/Ethnicity, Math 3-8

 100%

   90%                                                                                  Asian

   80%
                                                                                        White
                                                                    66.9%
   70%
             60.7%
                                                                                        Two or more races
   60%
                                                                    49.5%
   50%                                                                                  Native Hawaiian or Other
             42.4%
                                                                                        Pacific Islander
   40%
                                                                                        American Indian or Alaska
   30%                                                                                  Native
                                                                      20.3%
   20%                                                                                  Hispanic/Latino of any race
         16.1%
   10%                                                              16.9%
             13.0%                                                                      Black or African American
    0%
              2015          2016           2017           2018      2019

                                                                              Maryland State Department of Education   |   10
The Blueprint for Maryland’s Future: College and Career Readiness                                                         August 2022

The lack of progress and persistent differences between student groups also appear when looking at student
service groups (Figure 5). For example, 2019 PARCC assessment data in grades 3-8 showed that 16.5% of
students eligible for free or reduced price meals achieved a performance level of 4 or higher, while 47.1% of
students not receiving free or reduced price meals achieved the same performance levels.5 This 30-percentage
point difference in proficiency rates has largely remained constant from 2015 to 2019.

Figure 5 also shows low proficiency rates and persistent differences between student groups for students with
disabilities and students who are English learners. Assessment data in English language arts for grades 3-8 and for
high school assessments in Algebra I and English 10 illustrate similar themes.

Figure 5: Percent of Students at Performance Level 4 or Higher by Service Group, 2015-2019, Math 3-8

 100%

   90%
                                                                                                   Students with Disabilities
   80%

   70%                                                                                             Not Students with
                                                                                                   Disabilities
   60%
                                                                                                   English Learners
                                                                           47.1%
   50%         43.6%

   40%                                                                     35.4%                   Not English Learners
               32.1%
   30%                                                                                             Free/Reduced Meals
   20%                                                                     16.5%
               12.9%
                                                                                                   Not Free/Reduced Meals
   10%                                                                           10.0%
            4.7%
    0%
               2015           2016           2017           2018           2019

5 Maryland State Board of Education meeting shared publicly available presentation: 2019 Maryland Comprehensive Assessment Program

(MCAP) PARCC English Language Arts (ELA) and PARCC Math Results.
https://marylandpublicschools.org/stateboard/Documents/08272019/TabD-MCAP.pdf

                                                                                      Maryland State Department of Education    |    11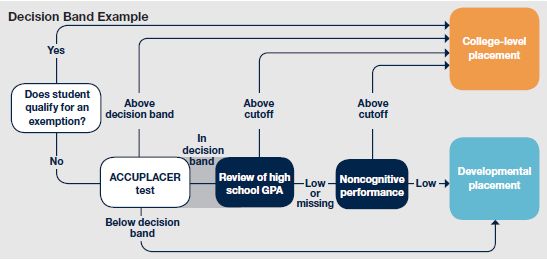
The Blueprint for Maryland’s Future: College and Career Readiness                                                                          August 2022

MARYLAND’S PERFORMANCE ON NATIONAL ASSESSMENTS

While the MCAP (Maryland Comprehensive Assessment Program) can be used to describe the degree to which
each student has mastered the expected knowledge and skills associated with grade level Maryland content
standards, it does not provide any information on how Maryland is performing compared to the rest of the nation.
The National Assessment of Educational Progress (NAEP) 6, administered every two years in each state, allows for
a national comparison by using a representative sample of 4th and 8th grade students’ knowledge and skills in math
and reading. The most recent administration of the NAEP from 2019 showed 4th and 8th grade Maryland students,
representing schools sampled throughout the state, performed similarly to the national average, yet substantially
lower than the proficiency cut score.7 Figures 6 and 7 provide a snapshot of this data.

Figure 6: NAEP Math average scores and proficiency cut score, 2019

                                          350
                                                                                                                                 299
                                          300                                                            280         281
                                                      239         240         249
                                          250
                         Average Scores

                                          200

                                          150

                                          100

                                          50

                                           0
                                                              Grade 4                                            Grade 8

                                                        Maryland          National Public     NAEP Proficient Cut Score

Note: The difference between the average Maryland score and all national public school students is not statistically significant.

Figure 7: Average NAEP Reading scores and proficiency cut score, 2019

                        300                                                                                                281
                                                                                                   264         262
                        250                                             238
                                                220         219
       Average Scores

                        200

                        150

                        100

                        50

                          0
                                                        Grade 4                                             Grade 8

                                                Maryland Score          National Score      NAEP Proficient Cut Score

Note: The difference between the average Maryland score and the average score for all national public school students is not statistically
significant.

6 National Assessmentof Educational Progress.
https://www.nationsreportcard.gov/profiles/stateprofile?chort=1&sub=MAT&sj=&sfj=NP&st=MN&year=2019R3
7
    The difference between the average NAEP score for Maryland that for the entire nation is not statistically significant.

                                                                                                         Maryland State Department of Education   |   12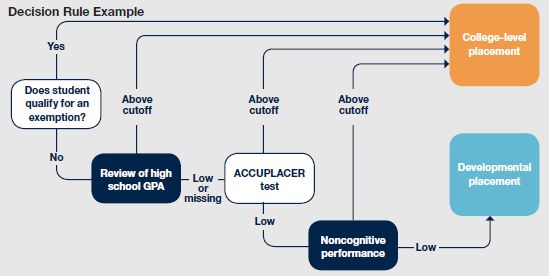
The Blueprint for Maryland’s Future: College and Career Readiness                                                               August 2022

Even though the average score for Maryland students is comparable to the nation, Maryland’s performance on
the 4th and 8th grade reading and math NAEP over the last ten years illustrates a troubling trend (Figure 8). With
the exception of Grade 8 Reading, average NAEP scores in Maryland in 2019 were at their lowest points in at
least a decade. Maryland’s average Grade 4 Math score in 2019 was 6 points lower than in 2009, Grade 8 Math
was 8 points lower, and Grade 4 Reading was 6 points lower.

Figure 8: Average Maryland NAEP scale scores by grade level and subject from 2009 to 2019

                    Average Maryland NAEP Score, by Subject and Grade Level
       300
                     288*                 288*                287*
       290                                                                          283               281               280
       280                                                    274*
                                          271*                                                                          274
                      267                                                           268*              267*
       270
       260
                                          247*                245*
       250           244*
                                                                                    239               241               239
       240                                231*                232*
                     226*                                                                             225*
       230                                                                          223
                                                                                                                        220
       220
       210
       200
                     2009                 2011                2013                  2015              2017              2019

                        Grade 4 Math                Grade 8 Math                 Grade 4 Reading             Grade 8 Reading

*Indicates the average score was significantly different (p
The Blueprint for Maryland’s Future: College and Career Readiness August 2022
While NAEP does not account for student demographics in published results, demographics are also an important
consideration. The Urban Institute publishes adjusted NAEP scores which account for demographic differences
across students in each state, rather than comparing states with vastly different student populations. The
adjustments include factors such as race, receipt of special education services, and status as an English language
learner. Their analysis underscores the importance of considering student characteristics along with
performance. The states that “break the curve” under this analysis are the states that perform better than
demographically similar states. These analyses show that a student’s demographics, and the state’s demographic
population, must be considered and addressed in all aspects of teaching, learning, and the greater school
environment.8
Figure 10: NAEP scores adjusted for demographics
8 Matthew Chingos, “Breaking The Curve: Promises And Pitfalls Of Using NAEP Data To Assess The State Role In Student Achievement,” Urban
Institute (October 2015). https://www.urban.org/research/publication/breaking-curve-promises-and-pitfalls-using-naep-data-assess-state-
role-student-achievement
Maryland State Department of Education | 14The Blueprint for Maryland’s Future: College and Career Readiness August 2022
Graduation Rate Data
Trend data of four-year high school graduation rates from 2016 to 2021 shows large gaps across student groups
in Maryland. Figure 11 shows the graduation rate of the two largest race/ethnicity student groups by population
and Figure 12 shows the graduation rate for English learner students.
Figure 11: Four-year Adjusted Graduation Rate Figure 12: Four-Year Graduation Rate for English
Among Student Groups: 2016-2021 Learners: 2016-2021
100 100
95.3 96.3 96.5 96.5 96.0
94.0 96.7
90 90
84.1 85.4 84.8 84.3 84.7 87.6 87.7 87.1 86.9 86.8 87.2
83.3
80 80
76.6 73.9 76
70 72.2 72.4 71.6 70
60 60 60.7
50 50 50.7
45.9 47.4
40 40
36.9 37.2
30 30
20 20
10 10
0 0
2016 2017 2018 2019 2020 2021 2016 2017 2018 2019 2020 2021
African Am Asian
All Students English Learners
Hispanic White
Figure 11. Shows a comparison of Maryland’s four-year graduation rate for African American, Asian, Hispanic, and White student group
populations. Figure 12. Shows a comparison of Maryland’s four-year graduation rate for all students compared to English learners. Source:
Maryland Report Card, graphs generated by MSDE.
Postsecondary Data
Maryland postsecondary data is collected to show the percentage of high school graduates who enroll in a college
level course after high school graduation. Disaggregated data is collected for all student groups including all races
and ethnicities, students receiving special services, and by gender, shown in Figure 13.
Figure 13: College Enrollment (Within 12 Months) Trend Data, 2016-2020
100
Percent Enrolled in College
90
84.7 85.4 85.9 85.6 83.0
80
70 72.4 72.7 72.8 72.9
67.7
60 60.5 61.5 61.8 62.0
56.6
50 52.2 50.4 47.3 47.0
40 40.1
30
20
10
0
2016 2017 2018 2019 2020
High School Graduating Class
Asian White African American Students Hispanic
Figure 13. Shows percentage of African American, Asian, Hispanic, and White students who enrolled in a postsecondary institution within 12
months after graduating from high school. Source: Maryland Report Card, graph generated by MSDE.
Maryland State Department of Education | 15The Blueprint for Maryland’s Future: College and Career Readiness August 2022
Section 1: CCR Standard
The Maryland State Department of Education is committed to implementing the Blueprint for Maryland’s
Future so that each student enrolled in public school, regardless of the student's race, ethnicity, gender, zip
code, socioeconomic status, or the language spoken at home, meets the College and Career Readiness
standard by the end of the 10th grade. The Blueprint calls for a clear definition of a college and career
readiness standard and a system of assessments that ensure students are reaching their goals and receiving
the support needed.
CURRENT COLLEGE AND CAREER READINESS STANDARD
The Blueprint for Maryland’s Future has a central goal of ensuring that all Maryland public school students are
College and Career Ready before graduation, thus signifying an ability to transition successfully to postsecondary
coursework at a two- or four-year institution or to the workforce. All instruction and assessments in public
schools should work toward this goal of preparing students to be ready for college and career. To actualize this
vision, the standard of what it means to be college and career ready needs to be defined and then set as the north
star for PreK-12 education. The Blueprint set the preliminary CCR standard to be measured by meeting or
exceeding the content standards (earning a score of 4 or 5 on the PARCC) on high school assessments.
The Maryland State Board of Education (SBOE) reinforced this standard on February 22, 2022 by adopting a
policy starting in the 2021-2022 school year, stating students are considered college and career ready when they
have met or exceeded a metric in both English and Math, as defined by these options:
• English - College and Career Ready metrics
o English 10 assessment
▪ Score 4 or 5 on the PARCC
▪ Score 2 or 3 on Early Fall MCAP (September 2021)
▪ Score 3 or 4 on Fall Block and Spring MCAP (December – January or March – May)
• Mathematics - College and Career Ready metrics
o Algebra I, Algebra II, or Geometry assessment
▪ Score 4 or 5 on the PARCC
▪ Score 2 or 3 on Early Fall MCAP (September 2021)
▪ Score 3 or 4 on Fall Block and Spring MCAP (December – January or March – May)
o Score of 520 on the Math SAT
The Blueprint also directs MSDE to contract with an external research organization to conduct an empirical
study of the skills, knowledge, and abilities needed to succeed in the first year of Maryland community college
coursework. The research study should then determine whether the College and Career Readiness standard
set by the State Board of Education aligns with and accurately identifies which students have gained the
requisite knowledge to succeed in community college. It should be noted that career readiness includes the
demonstration of requisite academic, technical, and employability skills. 9 The study should also test any
additional indicators of readiness, and further study the alignment between Maryland College and Career
Ready Standards and currently adopted content standards required by postsecondary institutions and
industry. Finally, the study should examine top–performing educational systems throughout the world and
9
Advance CTE: State Leaders connecting Learning to Work. https://careertech.org/
Maryland State Department of Education | 13The Blueprint for Maryland’s Future: College and Career Readiness August 2022
consider potential sources of bias in assessments used to determine college and career readiness. If
necessary, based on the results of the research study, MSDE will propose revised CCR standards to the State
Board of Education for approval.
COMMISSION OF RIGOROUS RESEARCH STUDIES
To fulfill the requirements of The Blueprint, it is necessary to determine the alignment of Maryland’s CCR
standards against national and international best practices and to consider potential sources of bias. MSDE is
commissioning two separate research studies to define and verify the CCR standard and how it will be measured.
The studies will address the long-term necessity of ensuring alignment of the components of the CCR standard
and the assessments, as well as the short-term necessity of ensuring current high school students are prepared to
succeed in college.
The Blueprint legislation articulates requirements for the research organizations completing these studies of the
CCR standard; however, with the additional context from other research and best practices together with
internal expertise, MSDE is expanding the scope of work agreements to prepare Maryland students to succeed.
Statute dictates that the study must:
• Determine the levels and types of literacy in reading, writing, and mathematics that are needed to
succeed in entry-level courses and postsecondary training offered at community colleges in the state
• Examine top-performing educational systems throughout the world, comparing these systems to the
education offered in the state
• Consider potential sources of bias in any proposed assessments and strive to eliminate any potential bias
in a proposed CCR modification
Study One: Exploratory Study
MSDE has partnered with the Maryland Assessment Research Center (MARC) at the University of Maryland to
complete a short-term quantitative study to explore the relationship between high school state and national
standardized tests, and other potential predictors of success measured in high school (such as course grades), and
actual success in postsecondary coursework and/or workforce outcomes.
The completion of the study process will result in a measure that best predicts whether a student is ready for
college and career, without a disproportionate impact on any particular student group. Meeting this college and
career readiness standard should be achievable through multiple methods that allow individual students to
demonstrate their skills based on their strengths. To enable Maryland to build these other methods, the research
study will evaluate the alignment and predictive abilities of indicators such as:
• State standardized tests for high school students
• National standardized test scores (SAT and ACT)
• High school course grades in math, ELA, and science, and high school GPA
• “Concentrator” status for career and technical education (meaning a student has completed two or more
courses in a program of study)
• Successful completion of a career and technical education apprenticeship
• Earned industry-recognized credentials as part of a career and technical education program of study
• Other measures that the community colleges use for placement decisions (could include AP, IB, and dual
enrollment course and assessment results)
Students should also be able to demonstrate success in higher education through multiple methods. This
component is especially important as The Blueprint dictates that all community colleges in Maryland shall accept
Maryland State Department of Education | 14The Blueprint for Maryland’s Future: College and Career Readiness August 2022
for enrollment in credit-bearing courses all students who meet the Maryland CCR Standard. Potential definitions
of success that will be evaluated in the research study may include:
• First-year postsecondary GPA, at both two- and four-year institutions
• Cumulative postsecondary GPA, at both two- and four-year institutions
• Credit attainment in entry-level courses in math, ELA, and science
• College persistence and completion
• Earning professional licensure
• Employment two quarters after exiting from high school and/or enrollment in postsecondary education
Study Two: Long-Term Study
To complete the long-term study, MSDE has published a Request for Proposals (RFP) for well-regarded external
research organizations to apply. This RFP was open for responses between May and July 2022 and will be
awarded for the study to commence as soon as possible. The specifications for the RFP are available on the
eMaryland Marketplace Advantage (eMMA) 10.
The RFP asks the research organization to perform a deep content analysis to determine the skills and knowledge
necessary to succeed in the first year at a community college or 4-year college or university in Maryland. The
definition of the CCR standard may be based primarily on the alignment to community colleges; however, MSDE
also has a responsibility to the portion of students who will matriculate directly into a 4-year university and to
careers. Maryland schools should strive to prepare its students not just to be “ready,” but to be equipped to thrive
in any postsecondary or career environment.
The long-term study will:
• Explore the alignment between Maryland College and Career Ready Standards and the content of entry-
level credit-bearing postsecondary courses and postsecondary training.
• Explore the alignment between Maryland College and Career Ready Standards and the content of
remedial postsecondary courses.
• Explore the alignment between Maryland College and Career Ready Standards and the measures used
by postsecondary institutions to place students in entry-level, credit-bearing postsecondary courses.
• Examine top–performing educational systems throughout the world, comparing these systems to the
education offered in Maryland. Specifically, (a) how those systems identify students as “college and
career ready,” and (b) the knowledge/skills students in those systems should have if they are identified as
“college and career ready.”
• Consider potential sources of bias in assessments used to determine college and career readiness, and
strive to eliminate any potential bias in a proposed CCR modification.
• Include a quantitative portion that will verify and expand on the findings of the exploratory study.
MOVING BEYOND STANDARDIZED ASSESSMENTS
MSDE’s guiding CCR implementation principles include establishing that multiple measures for demonstrating
college and career readiness be considered. Traditionally, standardized assessments such as SAT, ACT, and state-
administered assessments such as the PARCC were used to predict a student’s readiness for college and career.
To consider other types of measures, and perhaps more equitable measures, MSDE will explore if other indicators
of success, such as local assessments, performance assessments, dual enrollment course completion, GPA, CTE
10
https://emma.maryland.gov/page.aspx/en/bpm/process_manage_extranet/47111
Maryland State Department of Education | 15The Blueprint for Maryland’s Future: College and Career Readiness August 2022
Concentrator course completion, completion of an apprenticeship, or earning an industry-recognized credential
could be used as indicators of a student’s readiness.
The SAT and ACT have been widely used as primary predictors of college readiness and continue to be used at
many postsecondary institutions in determining college admissions, financial aid decisions, and in some cases,
placement into remedial or credit-bearing courses. While the intended use of these assessments is their ability to
forecast how a student may perform in their first year in college, trend data of over 1.6 million high school
graduates during a 12-year period indicated that test scores may be influenced by socioeconomic factors 11. There
specifically appears to be a strong correlation with a student’s family income or levels of parental education with
higher standardized test scores. Findings show that the more money a student’s parents earn and the higher the
education level they have completed, the more likely a student will score higher on these assessments.12 Figures
14 and 15 illustrate an example of the impact of family income on standardized test scores. Together they show
the juxtaposition of scores, ethnicity, and family income, and thus should call into question the reliability of what
is being measured by the ACT assessment13 and other similar measures. These practices present a compelling
argument in using multiple methods, in lieu of SAT or ACT scores, such as high school GPA or class rank.
Figure 14: ACT Scores by Race and Ethnicity, 2018 Figure 15: ACT Scores by Family Income
ACT Scale Score | Range 4-36
Ethnicity Family Income
African American About $0 to $24,000
American Indian/Alaskan About $24,000 to $ 36,000
Hispanic About $36,000 to $50,000
White/Caucasian About $50,000 to $60,000
Asian American About $60,000 to $80,000
About $80,000 to $100,000
About $100,000 to $120,000
About $120,000 to $150,000
More than $150,000
11 Geiser, Saul (2020). Norm-Referenced Tests and Race-Blind Admissions: The Case for Eliminating the SAT and ACT at the University of
California. From the book, The Scandal of Standardized Tests: Why We Need to Drop the SAT & ACT. Teachers College Press.
12 ACT contentsource: https://www.brookings.edu/blog/the-avenue/2019/05/17/students-need-more-than-an-sat-adversity-score-they-
need-a-boost-in-wealth/ Produced by the Hechinger Report.
13 Graphs Source: Boeckenstedt, Jon. “Some Final Thoughts on the SAT and ACT.” https://jonboeckenstedt.net/2020/01/10/some-final-
thoughts-on-the-sat-and-act/ (Accessed October 12, 2021)
Maryland State Department of Education | 16The Blueprint for Maryland’s Future: College and Career Readiness August 2022
Multiple Measures Placement Systems
Additional research from The Center for the Analysis of Postsecondary Readiness, a partnership between the
Community College Research Center at Teachers College, Columbia University, and the social policy research
organization MDRC, has shown that when determining a student’s college readiness and placement into credit
bearing courses (rather than remedial courses) at community colleges, using only standardized tests to make the
determination can be inadequate and lead to inaccurate decisions. However, integrating multiple measures into
the placement decision process creates more accurate decisions and allows more students to enroll and pass
credit-bearing courses. These multiple measures may include any or all of a list of criteria including high school
GPA, SAT Score, Accuplacer score, time since high school graduation, noncognitive assessments, and others. 14
All placement systems require a decision on what constitutes college-readiness. While selecting a cut score on a
single measure is relatively straightforward, the process is more complex when more than one measure is
involved. One of the systems that can be used with multiple measures is a “Decision Rule System.” Decision rule
systems generally consist of a series of “if-then” statements and may be hierarchical. The college will set up a flow
where they will check the student’s credentials against a series of thresholds, and see if the student surpassed any
of these minimum options. An example of this flow in shown in Figure 16.
Figure 1615
Another placement system involves using “Decision Bands,” where decision rules apply only to students who fall
within a certain range on a specified indicator (such as high school grade point average or a placement test score),
as shown in Figure 17. Students who score just below a college-level placement test cut score could be further
assessed using high school GPA or the results of a noncognitive assessment.
14 Barnett, E., Kopko, E., Cullinan, D., & Belfield, C. (2020). Who should take college-level courses? Impact findings from an evaluation of a
multiple measures assessment strategy. Center for the Analysis of Postsecondary Readiness and MDRC.
https://postsecondaryreadiness.org/wp-content/uploads/2020/10/multiple-measures-assessment-impact-findings.pdf
15 Barnett, E., Kopko, E., Cullinan, D., & Belfield, C. (2020). Who should take college-level courses? Impact findings from an evaluation of a
multiple measures assessment strategy. Center for the Analysis of Postsecondary Readiness and MDRC.
https://postsecondaryreadiness.org/wp-content/uploads/2020/10/multiple-measures-assessment-impact-findings.pdf
Maryland State Department of Education | 17The Blueprint for Maryland’s Future: College and Career Readiness August 2022
Figure 17
A final system involves using a Placement Formula algorithm. Here, a placement formula is developed that
weights and combines many measures at once, resulting in a placement score for each student. This placement
score is then used to assign students to specific classes.
A series of randomized controlled trial studies were conducted that evaluated the use of these multiple measure
systems for course placement and the academic success of the students who participated in these studies.
Students were randomly assigned to either be placed using multiple measures, or by using traditional
standardized assessments. The multiple measure systems used allowed more students to be “bumped up” into
qualifying for credit-bearing courses, but would not disqualify any students who met the traditional standard.
These students who were placed into the credit-bearing courses based on the multiple measures were 8–10
percentage points more likely to complete a college-level math or English course within three terms than they
would have been if forced to take remedial courses. Additionally, all gender, Pell recipient status, and
race/ethnicity subpopulations considered (with the exception of men in math) had higher rates of placement into
college- level courses using the alternative system. While disparities in academic achievement will not be
eliminated with these multiple measures, it does allow some students of minority groups to have a better chance
of succeeding in college than they would have otherwise.16
Recent Updates in Maryland
Informed by research such as these figures above and after reflecting on the implications of the Covid-19
pandemic, the University System of Maryland has recently removed the admission requirement to include SAT or
ACT scores for the universities in the state. In June 2022, the USM Board of Regents voted to remove the
SAT/ACT requirement for the system. Each individual university now has the option to require test scores or not.
In response to this decision, Darryl Pines, the president of the University of Maryland at College Park, said that
“We decided to communicate to our future students that we’re extending test optional (to) 2027, so that we can
understand the data post-pandemic as to how well students are doing.” 17 Each university is still in the process of
16 Barnett, E., Kopko, E., Cullinan, D., & Belfield, C. (2020). Who should take college-level courses? Impact findings from an evaluation of a
multiple measures assessment strategy. Center for the Analysis of Postsecondary Readiness and MDRC.
https://postsecondaryreadiness.org/wp-content/uploads/2020/10/multiple-measures-assessment-impact-findings.pdf
17 Maryland university system drops SAT/ACT admissions requirement. Kate Ryan. WTOP. June 22, 2022.
https://wtop.com/maryland/2022/06/maryland-university-system-drops-sat-act-admissions-requirement/
Maryland State Department of Education | 18The Blueprint for Maryland’s Future: College and Career Readiness August 2022
updating their policies as a result of this new rule, however, it is now possible that some Maryland public
universities will not require a SAT or ACT score for admission.
CASE STUDIES
The Blueprint serves as a clarion call for state and local leaders to consider innovative approaches of the types of
measures used to demonstrate that a student is college and career ready. A resounding finding is that the use of a
standardized assessment is no longer the only gold standard for a student’s ability to succeed in postsecondary
environments.
Case Study: Arkansas
In a case study conducted in Arkansas, The Fordham Institute found that CTE concentrators are 21 percentage
points more likely to graduate from high school than otherwise identical students (with similar demographics,
eighth grade test scores, and number of CTE courses taken) who do not concentrate. In the year after high school,
concentrators are 0.9 percentage points more likely to be employed (with average quarterly wages that are $45
higher), and 1.3 percentage points more likely to be enrolled in a two-year college, than similar non-
concentrators.18
While college readiness continues to be a strong focus in preparing students for postsecondary life, career
readiness at the end of K–12 education is key for the more than 57 percent of high school graduates who either
do not enroll in postsecondary education or who work and attend college at the same time (United States
Department of Labor, Bureau of Labor Statistics, 2021).19 CTE Concentrator course completion is a well-
researched alternative measure for demonstrating college readiness and especially career readiness.
Case Study: Nebraska and South Dakota
Education leaders in Nebraska and South Dakota partnered with the Regional Educational Laboratory Central
(REL) to examine postsecondary outcomes of CTE students and found that CTE concentrators were 7 percentage
points more likely than non-CTE concentrators to graduate from high school on time and 10 percentage points
more likely to enroll in any type of postsecondary education within two years of their expected high school
graduation year. The study also found that CTE concentrators were 3 percentage points more likely than non-CTE
concentrators to earn a postsecondary award, such as a professional certificate, diploma, or associate's or
bachelor's degree, within five years of their expected high school graduation year. CTE concentrators were 4
percentage points more likely than non-CTE concentrators to obtain up to an associate's degree as their highest
postsecondary award within five years of their expected high school graduation year but 1 percentage point less
likely to obtain a bachelor's degree or higher.20
Case Study: Chicago
As an alternative to relying solely on standardized assessments such as SAT and ACT as a measure of college and
career readiness, another method uses a student’s high school grade point average (GPA). A recent 2020
comprehensive study compared the use of ACT exam scores to using high school GPA as an effective predictor of
a student’s college completion. It found that high school grade point averages are five times more effective than
ACT scores at predicting who will graduate from college. To offer perspective, this study looked at over 55,000
graduates from all Chicago public high schools across a three-year period.21
18 Dougherty, S. M. (2016). Career and Technical Education in High School: Does It Improve Student Outcomes?. Thomas B. Fordham Institute.
19 Statistics, B. (2021). College Enrollment and work activity of 2020 high school Graduates. Washington, DC: US Department of Labor.
20 Brodersen, R. M., Gagnon, D., Liu, J., & Tedeschi, S. (2021). The Impact of Career and Technical Education on Postsecondary Outcomes in
Nebraska and South Dakota. REL 2021-087. Regional Educational Laboratory Central.
21 Allensworth EM, Clark K. (2020). High School GPAs and ACT Scores as Predictors of College Completion: Examining Assumptions About
Consistency Across High Schools. Educational Researcher. 49(3):198-211. doi:10.3102/0013189X20902110.
Maryland State Department of Education | 19The Blueprint for Maryland’s Future: College and Career Readiness August 2022
Individual high schools within Chicago vary greatly in many achievement metrics, yet GPA remains a strong
predictor of college enrollment and success. In fact, the study’s lead researcher said that “While people often
think the value of GPAs is inconsistent across high schools, and that standardized test scores, like the ACT, are
neutral indicators of college readiness because they are taken by everyone under the same conditions, our
findings indicate otherwise. The bottom line is that high school grades are powerful tools for gauging students’
readiness for college, regardless of which high school a student attends, while ACT scores are not.” The
researchers argue that GPA may be a better indicator of college success because of the wide array of skills and
behaviors that contribute to a student’s GPA.22
A student’s persistence and continued success across the varied inputs of different types of assignments, different
contents, and different environments are more similar to the actual demands of college, rather than a single test
in a sterile environment that can be prepared for over the course of years. 23 Recently, Harvard University had
similar findings which led to their amending admission guidelines. Now, candidates can submit “whatever
materials they believe would convey their accomplishments in secondary school and their promise for the
future.”24
Overall findings suggest that high school grade point averages perform in a strong and consistent way across high
schools as measures of college readiness, whereas ACT scores do not.25
Case Study: University of California
The University of California is one of many colleges and universities that has removed the ACT and SAT as an
admission requirement. Advocacy groups, students, and school systems argued that college entrance tests are
“biased against poor and mainly Black and Hispanic students” thus leading to discriminatory enrollment practices
based on race, wealth, and disability. The SAT and ACT scores will be used in a limited way such as students who
need the English subject matter requirement, course placement purposes, or for advising if students decide to use
the scores.26
Research into predictors of college success for California high school students found that high school GPA is a
stronger predictor of first-year college GPA and second-year persistence than either Smarter Balanced
Assessment or SAT at California State University. Also, using high school GPA as a predictor of college success
results in a much higher representation of low income and underrepresented minority students in the top of the
University of California applicant pool, than do SAT or Smarter Balanced Assessment scores. Using high school
GPA with Smarter Balanced Assessments versus high school GPA with SAT also results in a more
socioeconomically and racial/ethnically diverse applicant pool.27
Case Study: National Association for College Admission Counseling
The National Association for College Admission Counseling (NACAC) recently released a report citing needed
changes from the results of a long-term study which describes potential inequities associated with standardized
testing for college-bound students. In the 2020 report, there was a call for solutions focused on identifying
barriers for students who needed accommodations; offering fee waivers for the ACT and SAT exams for students
22 Ibid.
23 Ibid.
24 Anderson, N., (2021). Harvard Won’t Require SAT or ACT Through 2026 as Test-Optional Push Grows. Washington Post.
https://www.washingtonpost.com/education/2021/12/16/harvard-test-optional-college-admissions/
25 Allensworth EM, Clark K. (2020). High School GPAs and ACT Scores as Predictors of College Completion: Examining Assumptions About
Consistency Across High Schools. Educational Researcher. 49(3):198-211. doi:10.3102/0013189X20902110.
26 McDonnell, G., (2021). University of California Will No Longer Consider SAT and ACT Scores. New York Times.
https://www.nytimes.com/2021/05/15/us/SAT-scores-uc-university-of-california.html
27 Kurlaender, M., & Cohen, K. (2019, March). Predicting college success: How do different high school assessments measure up? [Report]. Policy
Analysis for California Education. https://edpolicyinca.org/publications/predicting-college-success-how-do-different-high-school-assessments-
measure-2019
Maryland State Department of Education | 20The Blueprint for Maryland’s Future: College and Career Readiness August 2022
who may need financial assistance; and more recently, recognizing the impact COVID-19 is having on college
admission practices and policies. To that end, a task force was assembled by the NACAC, whose role it was to
study the “cumulative effects on equity and access for international students and US students” taking online
standardized tests used for college admissions. 28 The work of the task force is summarized in the report
illuminating the Association’s greater goal: ensuring higher education creates environments in which all students,
regardless of race, ethnicity, country of origin, or country of residence, are provided equal access to educational
opportunity. Consequently, there were certain calls to action including how institutions should use standardized
test scores. Historically, they were intended as a “common yardstick” or finding a “diamond in the rough” in their
ability to assess the “cognitive characteristics” independent of the impact of a secondary curriculum.
Today, however, the report hastens colleges and universities to consider using high school grades as an important
factor in admission decisions. Years of research now point to high school grades as the single strongest predictor
of academic success during the first year of college and perhaps beyond. The report adds, though, that
standardized test scores can be value-added when combined with high school grades for their predictive
prowess.29
Case Study: Everett Community College, Washington
Everett Community College, one of 34 community and technical colleges in Washington state, offers an
innovative approach for prospective students trying to meet college admission requirements. Alternative options
appear scenario-based and mirror much of the more recent research for college admission such as:
• A student who completed a math class at a Washington high school, within the last two years, and who
earned a C+ or better, both semesters, enroll in a credit-bearing Math course.
• A student who graduated from a Washington high school, within the last five years with a 2.5 GPA or
higher, can enroll in English 101.
REVISIONS TO CCR STANDARD
The Blueprint specifies that each student should be supported to reach college and career readiness by the end of
the 10th grade to be prepared for participation in Post-CCR pathways during 11th and 12th grades. The studies that
MSDE are commissioning will determine whether GPA is a valid and reliable predictor of postsecondary success
in Maryland. MSDE will also investigate the reliability of multiple measures for determining how students meet
the CCR standard. Based on previous research, possible determinations might include cumulative 9 th and 10th
grade GPA, core subjects GPA, cumulative GPA including middle school courses, attainment of credits in core
content courses, attainment of credits in career and technical education (CTE) courses, or a combination together
with assessment scores, attendance, or other behavioral metrics. Although discussed earlier in this report, it is
worth revisiting how high school grade point average has been shown to be a stronger predictor of performance
in college-level English and math, than standardized test scores, among first time students enrolled in college-
level courses.30
Based on the outcomes of the commissioned research studies and other research, GPA and course completion
should be considered, at a minimum, as additional ways for students to meet an updated CCR standard.
28 Latting, J., (2020). Ensuring All Students Have Access to Higher Education: The Role of Standardized Testing in the Time of COVID-19 and
Beyond. National Association for College Admission Counseling. https://www.nacacnet.org/globalassets/documents/knowledge-
center/nacac_testingtaskforcereport.pdf.
29 Latting, J., (2020). Ensuring All Students Have Access to Higher Education: The Role of Standardized Testing
in the Time of COVID-19 and
Beyond. National Association for College Admission Counseling. https://www.nacacnet.org/globalassets/documents/knowledge-
center/nacac_testingtaskforcereport.pdf.
30 Hodara, M., & Lewis, K. (2017). How well does high school grade point average predict college performance by student urbanicity and timing
of college entry? (REL 2017–250). Washington, DC: U.S. Department of Education, Institute of Education Sciences, National Center for
Education Evaluation and Regional Assistance, Regional Educational Laboratory Northwest. Retrieved from
https://ies.ed.gov/ncee/rel/regions/northwest/pdf/REL_2017250.pdf
Maryland State Department of Education | 21The Blueprint for Maryland’s Future: College and Career Readiness August 2022
Additionally, MSDE will continue to investigate how various measures of college and career readiness, including
using GPA and course completion, may be used to identify when each student met the CCR standard.
Once the commissioned research studies have been completed, MSDE will define and provide guidance and
recommendations for what skills and knowledge students need to succeed in college and a career. As part of the
draft process, MSDE will propose needed changes to the CCR standard with a variety of options for
measurement. MSDE will bring the revised CCR standard to the State Board of Education for approval.
Additionally, the outcome of the research studies may require revisions to the comprehensive assessment
program, its related content standards, administration methods, or options for students to display mastery
through alternative methods.
Maryland State Department of Education | 22You can also read