Coca-Cola Bottlers Japan Holdings Inc - Second quarter 2021 Earnings Presentation

Page created by Peter Peters
 
CONTINUE READING
Coca-Cola Bottlers Japan Holdings Inc - Second quarter 2021 Earnings Presentation
Second quarter 2021
                                                       Earnings Presentation
                                                       August 12, 2021

                 Coca-Cola Bottlers Japan Holdings Inc.

Calin Dragan, President
Bjorn Ivar Ulgenes, Vice President & Chief Financial Officer
(Posted to CCBJH website on August 11, 2021)
Coca-Cola Bottlers Japan Holdings Inc - Second quarter 2021 Earnings Presentation
Forward-looking statements
 The plans, performance forecasts, and strategies appearing in this material are based on the assumptions and judgment of the management
 of Coca-Cola Bottlers Japan Holdings Inc. (CCBJH or Company) in view of data obtained as of the date this material was released. These
 forecasts may differ materially from actual performance due to risks and uncertain factors such as those listed below.
 Risks and uncertain factors are not limited to the items listed below. They are also included in our annual securities report, or “Yuka Shoken
 Houkokusho”.
 • Agreements with The Coca-Cola Company and Coca-Cola (Japan) Company Limited.
 • The quality and safety of products
 • Market competition
 • Natural environment, such as climate, disaster, water resources, etc.
 • Legal environment
 • Leakage or loss of information
 • Change of economic conditions, such as personal consumption, currency exchange rates, prices of raw materials, fair value of assets, etc.
 • Business integration, streamlining and optimization of business processes, etc.
 • Uncertain factors other than those above
 The information in this presentation is provided for informational purposes and should not be construed as a solicitation of an investment in
 our securities.
 CCBJH undertakes no duty to update any statement in light of new information or future events. You should rely on your own independent
 examination of us before investing in any securities issued by our company.

                                                                                                                                              2
Coca-Cola Bottlers Japan Holdings Inc - Second quarter 2021 Earnings Presentation
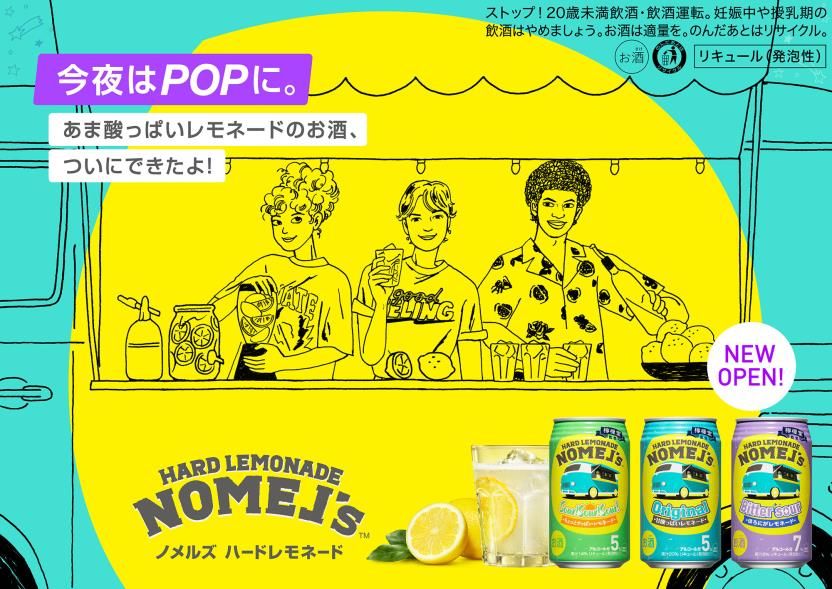
Coca-Cola Bottlers Japan Holdings Inc. (CCBJH)
Q2 2021 earnings presentation

    Overview and situational analysis

    1H 2021 results and 2021 outlook

    Q&A

                                                 3
Coca-Cola Bottlers Japan Holdings Inc - Second quarter 2021 Earnings Presentation
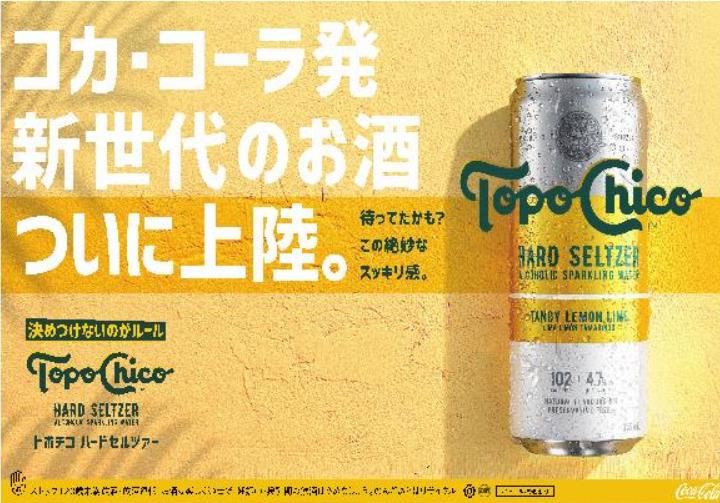
Overview and
Situational Analysis
Coca-Cola Bottlers Japan Holdings Inc - Second quarter 2021 Earnings Presentation
1H 2021– Highlights
   Market uncertainty continues; consumer traffic remains challenged due to rise in COVID-19 infections and
   additional State of Emergency declarations
   Ongoing COVID-19 impact on market trends (channels/packages) continue to pressure profitability
   Cycling includes one-time cost savings in Q2 and pre COVID-19 performance in Q1, resulting in bigger business
   income loss for 1H
   Despite headwinds, revenue and volume recovered in Q2 driven by innovation & growth initiatives
   Transformation initiatives in Commercial and Supply Chain are on track

             Winning in the market                                                           Transformation & Building Foundation
 ✓ New products contributing to growth
                                                                                      ✓ Recurring cost savings: about 6 billion yen
 ✓ Historical high vending value share since
                                                                                      ✓ Vending and Supply Chain transformation
   integration; 27 consecutive months of growth                                         initiatives entering next phase
 ✓ 60% volume growth in Online                                                        ✓ Advances on ESG initiatives: 100% Recycle PET
 ✓ Alcohol: new brands, production capacity,                                          ✓ Good stewards of capital: Dividend on plan
   #1 share in Lemon-dou
                              *Source : Intage (January-June 2021, nationwide excluding Okinawa, chuhai market 350ml                    5
                              can by SKU, value basis)
Coca-Cola Bottlers Japan Holdings Inc - Second quarter 2021 Earnings Presentation
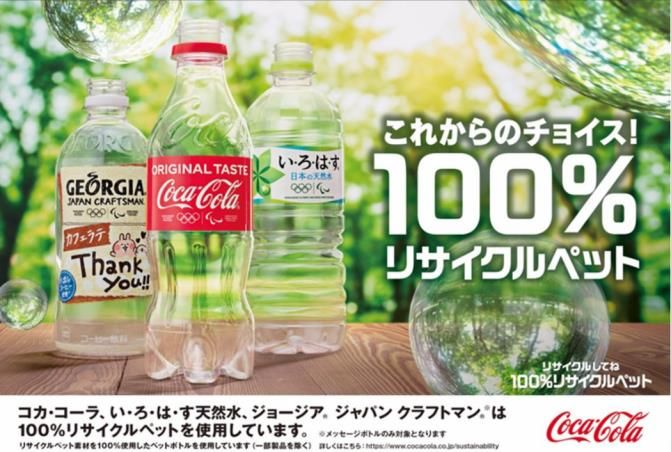
Winning in the market: Innovation & Growth
Accelerating initiatives to capture changes in consumer behavior

            New products/ Packages                                  Online                          Vending

                                                           Increase label less SKUs and,
 Capture growth with new innovative products and package                                   New Vending opportunity with
                                                              growing revenue from
   sizes that meet the new consumption occasions. Newly                                       Coke ON and effective
                                                           subscription consumers and
 launched products have been well received by consumers.                                       marketing strategies
                                                                various promotions

                                                                                                                          6
Coca-Cola Bottlers Japan Holdings Inc - Second quarter 2021 Earnings Presentation
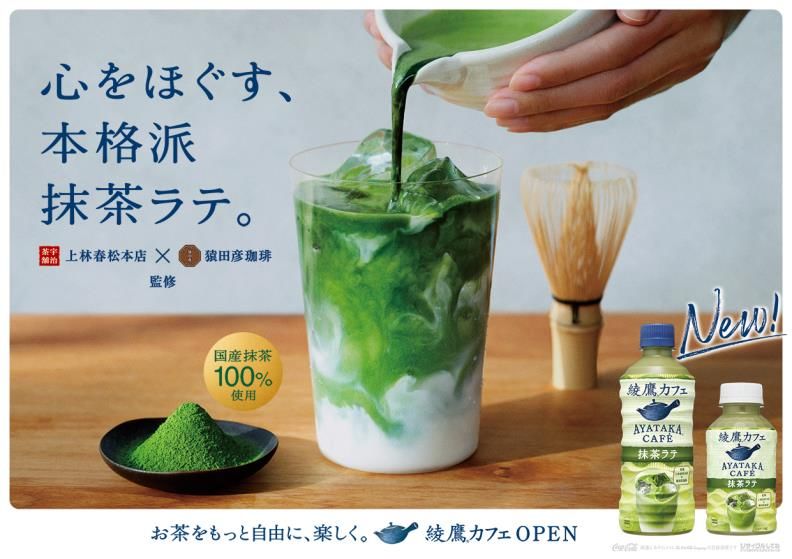
Winning in the market: Vending Channel
Achieving 27 consecutive months of value share gain
Investing to grow our healthy base & prepared to capture future growth

Product line-up                                     Improve placement location
   Effective new product launch                        Increase placement in high VPM
   Strategic pricing & package line-up                 locations
   Use of AI for to optimize product                   Continuous location mix
   line-up to maximize sales                           improvement led by past strategic
                                                       withdrawal of unprofitable
                                                       machines

Digitalization & promotion                          Operation quality improvement
   Leverage Coke ON as digital                         Solid infrastructure built through
   platform                                            transformation
   Targeted promotion based on                         Improvement in quality of
   consumers                                           operation and activities
                                                       Improved operation KPIs such as
                                                       out-of-stock ratios

                                                                                            7
                                                     *VPM: Volume Per Machine
Coca-Cola Bottlers Japan Holdings Inc - Second quarter 2021 Earnings Presentation
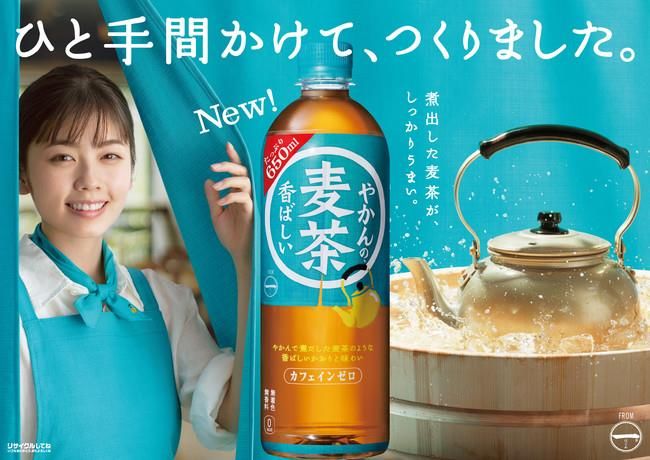
Transformation Continues: Vending business model
Phase 2 of vending transformation
    Phase 2 of Vending Transformation Started. Further accelerate transformation to improve quality and
    efficiency of operation from last year (Phase 1)
                        Phase 1:July 2020~                                                     Phase 2:May 2021~
                                                                             ▶Planning
                                                                                              Further route optimization accounting for
                                                                                              area characteristics with time study
                                                                                              leveraging big data

                                                                             ▶Picking/Loading
                                                                                             Further efficiency achieved by collaborating
                                                                                             with supply chain. Reduce total costs by
                                                                                             consolidating inventory to Saitama Mega DC
                                                                                             and automating operations
   1   Segmentation of sales person’s work routine                           ▶Operation on site
   2   Introducing new call/visit planning based on sales prediction by AI
   3   Route reorganization (call/visit # increase per sales person)                          Expand one-trip operation with new smart
   4   Productivity improvement and maximization of sales activity by                         phone hand held terminal and online VMs
       operation-focus work

          2020 Route reduction: -20% (vs 2019)                                     2021 Route reduction: -7% (vs 2020)
                                                                                                                                            8
Coca-Cola Bottlers Japan Holdings Inc - Second quarter 2021 Earnings Presentation
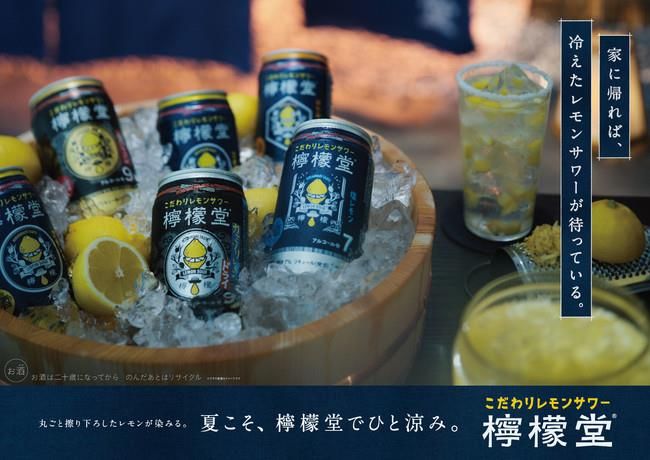
Transformation Continues: Supply Chain
Establishing a solid supply chain foundation for growth & improved efficiency
                   Manufacturing                                                Logistics

   Capacity expansion in growing areas                    Logistic centered around Saitama Mega DC
   ・Aseptic: 7 new lines between 2018 - 2020              •   Started operation in February, completed transfer of
   ・Alcohol: New line at Komatsu Plant in May 2021            inventory to Saitama Mega DC at half of the target
   Innovation                                                 locations. Closed 6 location in all areas.
   ・NAT (next generation aseptic technology)              •   Temporary cost associated with ramping up large-
   ・New package (350/700ml PET, 950ml PET)                    scale DC are within expectation. Progress towards
                                                              creating benefit from next year onwards.
   Improved production efficiency
   ・High speed manufacturing, labor-saving operations     Akashi Mega DC, progressing as planned

                                           Supply chain back office

   Streamlining the supply chain structure for low-cost operations
   ・ Implementing further standardization, consolidation and automation of operations

                                                                                                                     9
Coca-Cola Bottlers Japan Holdings Inc - Second quarter 2021 Earnings Presentation
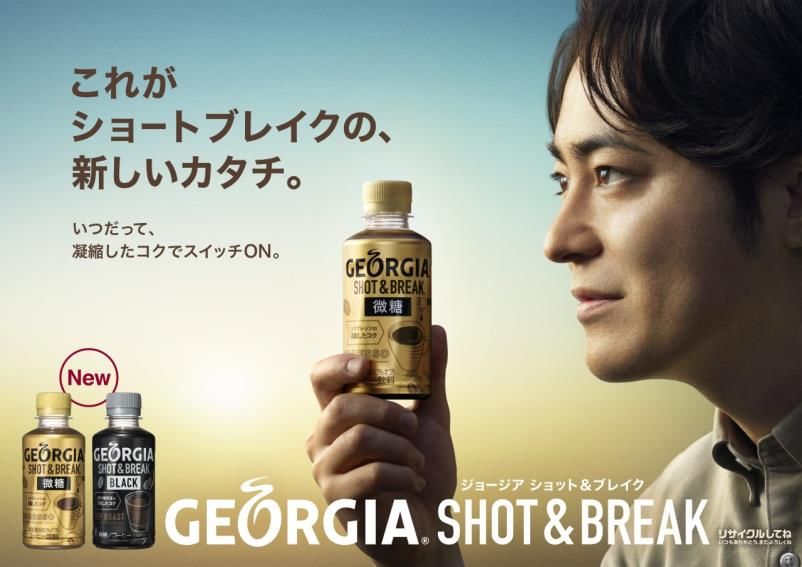
ESG – At the core of our daily operations
Steady progress in creating shared value
 Recycle                                                   Embrace Diversity and Equality
    Accelerate our initiative toward a “World Without         Coca-Cola system in Japan in May 2021
    Waste” with the introduction of Brand Coca-Cola with      implemented employment regulations
    100% recycled PET content, leading to reduced CO2 by      and benefits for same-sex partners of
    60% per bottle.                                           employees. CCBJH has implemented
 Food loss prevention initiatives                             such initiatives since last year.
    Food loss prevention vending machines. Through this
    vending machine will lead to increasing purchasers’
    awareness about food loss, and promote SDGs.           Work Place COVID-19 Vaccination
                                                              Implemented workplace COVID-19
                                                              vaccination. Scope including employees,
                                                              family members, and suppliers.

                                                           Supporting local communities
                                                              Multiple “Comprehensive Collaboration
                                                              Agreement” have been signed, to work
                                                              closer with local communities.

                                                                                                        10
Progress against 2021 target
Focusing on the controllable, building resilience and setting foundation for growth
              Market share              Recurring cost savings                               Capex

     Target           Progress          Target          Progress          Target                    Progress

                                         7-9 B yen         About          45-50 B yen                 28.1 B yen
                                                           6 B yen

          Value share growth             Recurring cost savings target    Limited new capex during COVID
              continues                    through transformation                   uncertainty
                                                                          *Not including IFRS16 non cash items

               Depreciation                 Annual dividends                  Content of recycled PET

     Target           Progress          Target           Progress         Target                   Progress
                                             50          On plan to pay                               Target
     55-60 B yen       28.9 B yen         yen/share      25 yen/ share           40%                Maintained
                                                          for interim

     On plan, as we control our capex   On track to target with solid      Expand recycled PET usage, on
                 spending                      cash position               track to meet 50% 2022 goals

                                                                                                                   11
1H 2021 Results
1H 2021 results vs. 2020
Continued COVID impact; cycling extensive one-time cost savings in Q2 2020
                                                                                                                                                     Unit: Million JPY

                                                                                                     2021 1H Actual                2020 1H Actual    YoY (%)

Continuing Operations (Beverage Business)
  Revenue                                                                                                         369,309                 374,598           -1.4%
  Beverage Sales Volume (Million Cases)                                                                                      217              212              +3%
   NARTD (Non-alcoholic ready to drink) Beverage Volume (Million Cases)                                                      213              207              +3%
  COGS                                                                                                            206,040                 205,054           +0.5%
  Gross Profit                                                                                                    163,269                 169,544           -3.7%
  SG&A                                                                                                            177,295                 176,016           +0.7%
  Business Income (Loss)                                                                                          (14,799)                 (7,368)                  -
   Operating Income (Loss)                                                                                        (18,250)               (14,937)                   -
Net income (loss) attributable to owners of parent                                                                     (354)               (6,452)                  -
(Total of continuing and discontinued operations)

                                             Some inconsistencies with the volume data provided in past presentations may                                                13
                                             be expected as a result of standardization of volume and revenue calculation.
1H 2021 Drivers of Business Income
Volume recovery in Q2 was not enough to offset the cycling impact cost savings of last year
                                            Volume, Price                  DME                     Commodity               Manufacturing                  Others
                                               & Mix*                (Direct Marketing
                                                                    Expense, fixed only)

                     -7.4                                                                                                                                                      -14.8
                                                                   • Resuming marketing                                  • New production line
                                                                     investment that had                                   depreciation increase
                  2020 1H                                            been restrained last year                             offset by enhanced
                  Business                    -7.7                   to drive growth after
                                                                     2021
                                                                                                                           productivity due to
                                                                                                                           higher production
                  Income                                                                                                   volume
                                                                   • New product launches
                                                                                                                                                                               2021 1H
                                        • Volume recovery in              -3.2                         0.0                      +0.6                     +2.9                  Business
                                          Q2 (+15%), slightly                                                                                      • Benefit from              Income
                                          positive channel mix                                                                                       transformation savings
                                                                                                 • Starting to see
                                        • Rising variable                                          rising commodity                                • Total labor cost
                                          expense along with                                       price impact in Q2                                decreased YoY, but
                                          volume recovery                                                                                            increased in Q2 with
                                          (vending commission,                                   • Cost push from
                                                                                                                                                     bonus payments
                                          price promotions,                                        commodity is to
                                                                                                   be monitored                                    • Logistic cost rise with
                                          etc.)
                                                                                                                                                     increased production
                                                                                                                                                     and rapid change in
                                                                                                                                                     volume                          Unit: B JPY
                                                                                                                                                                                     (Rounding off less than unit)
*Volume, Price & mix represent marginal profit of our commercial activities including variable costs and deduction from revenue in IFRS.

                                                                                                                                                                                                                     14
1H 2021 NARTD beverage volume performance by channel
Volume growth in Online, SM, D&D and Vending
                                                                                                     SM, D&D: Increased mainly in categories that offer a
1H total volume +3%                                                                                  wide range of package sizes in response to changes in
By channel                                                                                           consumer purchasing styles such as domestic
                                                                   Wholesale
                                                                                                     consumption and increased bulk purchases
                               Vs. PY                      Volume revenue  per
   3% 1%                                                              case                           CVS: Strategically implemented 950ml PET contributed,
                                                                                                     but decreased due to partially intensified competition.
                      Supermarket (SM)                          +7%            -88Yen
  14%
                                                                                                     VM: Q2 increased by + 18% mainly due to traffic recovery,
             26%      Drug & Discounter (D&D)                   +9%            -88Yen                positive in all categories. There was also a recovery in
 24%                  Convenience Store (CVS)                   -3%            -63Yen                volume per machine, mainly for outdoor machines
              17%     Vending (VM)                              +2%            -34Yen                R&F: Impacted by Food channel down due to sluggish
       15%
                                                                                                     customer attraction at restaurants, etc.
                      Retail & Food (R&F)                     -12%            +14Yen
                                                                                                     Online: Increased due to case purchases growth and the
                      Online                                 +60%              -38Yen                labelless products
                                                                                                     Wholesale revenue per case: SM, D&D decreased due to
                                                                                                     changes in case configurations for 1.5LPET products. VM
                                                                                                     was affected by increased implementation of low-priced
                                                                                                     can products to promote purchasing opportunities

                                        Note: Volume doesn’t include alcohol. Revenue per case doesn’t include DFR (deduction
                                        from revenue). Some inconsistencies with the volume data provided in past presentations                                15
                                        may be expected as a result of standardization of volume and revenue calculation.
1H 2021 NARTD beverage volume performance by category
Continued impact of COVID-19; new products starting to contribute
1H total volume +3%
By category
                                                                                                                      Sparkling Recovery in volume in Q2 in SM and
                                                  Vs. PY                                Volume                        online, new Fanta Premier Orange also contributed
 5%        8%                         Sparkling                                                    Flat               NST New products Yakan Barley Tea from Hajime,
                                                                                                                      Ayataka Matcha Latte contributed to growth
                     26%              Non-sugar tea (NST)                                         +4%
   21%                                                                                                                Sports Cycling the COVID-19 impact in the same
                                      Sports                                                      +4%
                                                                                                                      period before and showed recovery
                     21%              Water                                                     +29%                  Water Growth driven by SM, D&D and online. Large
     11%
             8%                       Coffee                                                       -2%                PET was strong and new products such as ICY SPARK
                                      Juice                                                        -7%
                                                                                                                      also contributed
                                                                                                                      Coffee COSTA COFFEE pushed up PET bottle coffee
                                                                                                                      in all major channels and partially offset the can
                                                                                                                      coffee decline
                                                                                                                      Juice Declined due to continued weakness in R&F as
                                                                                                                      outlets remain under COVID-19 restrictions

NARTD: Non-alcoholic ready-to-drink

                                                    Note: Volume doesn’t include alcohol. Revenue per case doesn’t include DFR (deduction
                                                    from revenue). Some inconsistencies with the volume data provided in past presentations                                16
                                                    may be expected as a result of standardization of volume and revenue calculation.
NARTD channel/category/package volume performance
Q2 2021 (April to June) volume: +15%                                                                By package
By channel                                                                                                                                                vs PY             Volume
                                                                     Wholesale
                                                                                                     1H 2021
                                   Vs. PY                     Volume revenue                                              5%                           S-PET                     +2%
          4% 1%                                                      per case                                      2%
                                                                                                                                                       M-PET                    +95%
                          Supermarket (SM)                      +12%           -91Yen                              8%                                  L-PET                    +11%
                                                                                                              5%
       13%                Drug & Discounter (D&D)               +10%           -82Yen                                                                  Can                        -5%
                   27%                                                                                                                39%
                                                                                                              12%
                          Convenience Store (CVS)                 +5%          -77Yen                                                                  Bottle Can                +3%
     23%                  Vending (VM)                          +18%           -40Yen                                                                  Syrup                    -13%
                                                                                                                     25%
                    18%   Retail & Food (R&F)                   +31%           -56Yen                                                                  Powder                     -9%
             14%                                                                                                                       4%
                          Online                                +57%           -70Yen                                                                     vs PY              Volume
                                                                                                   Q2 2021
By category
                                                                                                                           5%                          S-PET                     +12%
                                   Vs. PY                     Volume                                                 2%
       5% 7%                                                                                                                                           M-PET                   +107%
                          Sparkling                                 +7%                                             7%
                    26%                                                                                                                                L-PET                     +12%
                                                                                                               5%
    20%                   Non-sugar tea (NST)                     +17%
                                                                                                               12%                    39%              Can                        +4%
                          Sports                                  +12%
                                                                                                                                                       Bottle Can                 +8%
     11%           21%    Water                                   +50%
                                                                                                                                                       Syrup                     +41%
             10%                                                                                                     26%
                          Coffee                                    +7%
                                                                                                                                                       Powder                    +34%
                          Juice                                   +21%                                                                  4%
                                                                                                                                             S-PET: PET under 600ml/L-PET: PET above 1.5L
                                            NARTD: Non-alcoholic ready-to-drink
                                            Note: Volume doesn’t include alcohol. Revenue per case doesn’t include DFR (deduction
                                            from revenue). Some inconsistencies with the volume data provided in past presentations
                                                                                                                                                                                        17
                                            may be expected as a result of standardization of volume and revenue calculation.
Building a foundation for value share growth in 2021
Vending continues to grow; OTC leaves room for improvement
                     OTC market share                                                Vending value share

• Q2 OTC value share was challenging given the intensified   • Growing for 27 consecutive months, record high value
  promotion activities                                         market share achieved during Q2 since integration
• OTC market share growth in supermarket, drugstore &        • Market share gains across all sales regions in June
  discounters. CVS is a channel for future improvement
                                                                                      Retail pricing trends
                  OTC Market Share (YoY)
        Market Share (vs. PY, PP)   Value      Volume
                                                             • Observing continued price premium vs. market average
                                                               with effective promotional activities in the market
        1H (Jan to June)             -0.2        +0.2
        Q2 (April to June)           -0.3        +0.1                                    OTC Retail Price
                                                                  OTC Retail Price                               Vs. Market
                                                                                                                                      Vs. PY
                                                                  (January to June, JPY per bottle)               Average
                                                                  Small PET                                                +5.4             -2.2

                                      Value    Volume             Large PET                                               +21.0             -8.1
                                                                  Data source standards changed from 2021. SPET(351~650ml), LPET(1.251L~)
         Q1 2020 Q2 2020 Q3 2020 Q4 2020 Q1 2021 Q2 2021          Retail price data source: Intage

                                                                                                                                                   18
Continued priority on good stewardship of capital
Focus on shareholder value creation
                                      Shareholder value creation
                                            Balance sheet and
               Dividends                                                       Capex and depreciation
                                                cash flow
    ✓On plan to pay interim           - 45 billion cash-in with 12.8     - Continued restraint in
     dividend of 25 yen/share           billion yen pre-tax profit          placement of new sales
    ✓Maintain full year target          from Q’sai divestment               equipment helps to control
                                                                            capex and depreciation
               2021 plan              - Solid financial position:56.5%   - Reassessing every single new
                                        equity ratio at end of Q2
                                                                            investment
             50 Yen/share               2021
        Interim       Year-end Plan   - Continue to sell down idle       (Billion JPY)
                                                                                          2021 1H
                                                                                           Actual
                                                                                                          Vs PY
                                                                                                                        2021 FY
                                                                                                                         Plan
                                        assets and cross-held shares     CAPEX*               28.1               -8.8   45 to 50
         25               25                                             Depreciation         28.9           +0.2       55 to 60
      Yen/share        Yen/share
                                                                         *Not including IFRS16 non cash items.

                                                                                                                                   19
Marketing and branding update
Update from Coca-Cola (Japan) Company, Limited

                   2021 Q2 Initiatives Review

                   2021 Q3 Initiatives Highlight

                                                   21
2021 Q2 Initiatives Review
 Building consumer engagement and new users via core & innovations
 Coca-Cola TM & Flavor Sparkling                                 Coke ON campaign                  100% recycled PET bottle
         350/700ml PET                                                                              Coca-Cola, I LOHAS, Georgia*
                                                                                                 Reduction of CO2 emissions
         National Expansion                            Coke ON install exceeds 28MM        60% per bottle, approx. 35,000 tons in TTL SKU per year    **

     optimized price/pack format

                                                                                          * メッセージボトルのみ対象となります。
                                                                                          ** 一般的なPETボトルから100%リサイクルPET素材に切り替えた場合。対象製品合計、前年出荷実績に基づくCCJC試算。

            COSTA COFFEE                                               Yakan Barley Tea                      ICY SPARK
              Re-launch                                                  from Hajime                      from Canada Dry
“Mass Premium” Quality Coffee Proposition              Exceed 50 mil bottles shipment                ICY SPARK brought
  captures the RTD&NRTD “coffee lovers”                         in 2 months                   incremental NSR and market share

                                            ※As of June 18, 2021
                                            (Shipment base, KO data)

                                                                                                                                                     22
2021 Q3 Initiatives Highlights (Jul)
Expand users & drinking occasions by enhancing core & innovations
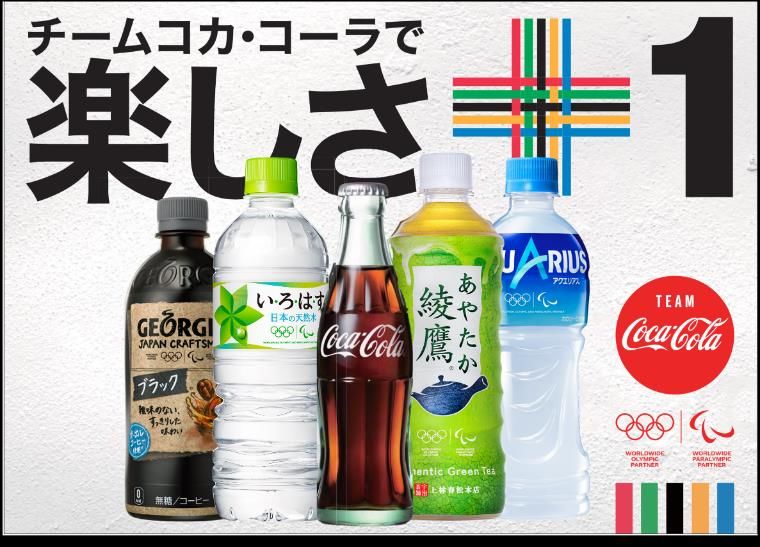
   Team Coca-Cola Tokyo 2020             GEORGIA                “Ayataka Café Matcha Latte”
      Portfolio Campaign               SHOT & BREAK                440mlPET Re-Launch
                                    Creating a new style of         Reclaim its product
  2.16MM users applied to the
                                      Short-Break Coffee        superiority (great taste) and
National Promotion for Tokyo 2020
                                    by smaller PET format     unique edge (new latte segment)
           (as of 7th weeks)

                                                                                                23
2021 Q3 Initiatives Highlights (Jul)
Cultivate alcohol as a white space with core campaign & innovations
        “Lemon Dou”                                       NOMEL’s                                                         Topo Chico Hard Seltzer
      Summer Campaign                                  Hard Lemonade                                                              (Pilot)
   Capture summer occasion                                                                                              Cutting edge
    by positioning Salty and              Get off to a good start and                                             hard seltzer alcohol brand
        Kamisori Lemon                  KO ranked as 3rd* in the market                                     has started its consumer experience
 as main flavors for heavy users            on a value share basis                                           in selected venue and limited area

                                   ※INTAGE SRI+ low alcoholic drink Market Share in Sales Value of 2020 June 21-28 week

                                                                                                                                                    24
2021 Plan:
Continue flexible and timely actions to adapt to changes
Ramping up marketing activities for solid growth

   FEWER, BIGGER          PIVOT TO CORE           STAY@HOME
    INNOVATIONS           コアへの原点回帰               家庭内需要の獲得
      選択と集中

                                                              25
2021 Outlook
Full year operating environment remains unpredictable
                                             COVID-19 Cases Rising                                                                                             Lower Traffic at Major Railway Stations
            14,000                            # of new cases         # of severe patients                       1,600
                                                                                                                                                                 Traffic data in Major Stations (% vs LY)
            12,000                                                                                              1,400

                                                                                                                1,200
                                                                                                                                               150
                                                                                                                                                      SoE                                    SoE                             SoE
            10,000

                                                                                                                        # of severe patients
 # of new cases

                                                                                                                1,000
                  8,000                                                                                                                        100
                                                                                                                800
                  6,000                                                                                                                                                                                                                Shinjuku
                                                                                                                600                             50
                                                                                                                                                                                                                                       Osaka
                  4,000
                                                                                                                400
                                                                                                                                                                                                                                       (Umeda)
                                                                                                                                                 0                                                                                     Hakata
                  2,000                                                                                         200                                                                                                                    Sendai
                                                                                                                                               -50
                                                                                                                                                                                                                                       Nagoya
                     0                                                                                          0                                    W11 W12 W13 W14 W15 W16 W17 W18 W19 W20 W21 W22 W23 W24 W25 W26 W27 W28 W29 W30   Tokyo
                          Apr          May                     Jun                      Jul               Aug
                                                                                                                                                         Mar           Apr             May               Jun               Jul
                                                 Source: Minister of Health, Labor and Welfare, as of Aug 1
                                                                                                                                                                                                                          Source: NTT Docomo
 • Number of COVID-19 cases rapidly increasing even after the 4th SoE
   was declared
 • From August 2nd, four prefecture were added to the SoE                                                                                                            Continued Market Uncertainty
 • Number of vaccination is steadily increasing, but still uncertainty
   remains
         Vaccination Progress (% of total population) As of Aug 1
                                                                                                                                                • 2021 annualized GDP originally estimated at +3.3%; now
                                                                                                                                                  revised downwards
Once or more                                                   39.6%                                                                            • Consumer Confidence Index shows initial signs of recovery
                          Twice                     29.1%                                                                                         and Consumer Price Index in July signals inflationary
                                                                                                                                                  outlook
                                  0%    20%                40%                60%             80%               100%
                                                                        Source: Prime Minister’s Office of Japan

                                                                                                                                                                                                                                                  27
Our focus areas during uncertain times

  SAFETY & SECURITY                    AGILITY                      RESILIENCE

  The safety and security of   Agile and flexible business   Accelerating transformation
 our consumers, customers,      planning, ready for the          to build a resilient
  partners, employees and                future                      foundation
communities are our priority

             “Business as usual is not an option”

                                                                                           28
Key Takeaways

   Uncertainty continues with rising COVID-19 infections and State of Emergency
   Market volume recovery expected, but outlook remains hard to predict with
   continued consumer trend shift
   Cycling of one time cost savings in 2020 is expected to put pressure on shot-term
   profitability, and 1H profitability is expected to weigh on full year performance

   We will continue our efforts to win in the market and transformation to build a
   solid foundation to be profitable when the market recovers to a stable state
   Aspire to be the best in class corporate citizen through ESG and creation of share
   holder value

                                                                                        29
Q&A
THANK YOU
Investor Relations
Coca-Cola Bottlers Japan Holdings Inc.
ir@ccbji.co.jp
https://en.ccbj-holdings.com/ir/
You can also read