Coal-free cities: the health and economic case for a clean energy revolution - September 2021
←
→
Page content transcription
If your browser does not render page correctly, please read the page content below
Coal-free cities: the health and
economic case for a clean energy
revolution
September 2021

Table of contents

C40 is a network of nearly 100 mayors of the                                                                 Glossary & Acronyms			                                                  4
world’s leading cities who are working to deliver
                                                                                                             Executive summary						                                                 6
the urgent action needed right now to confront
the climate crisis and create a future where
                                                                                                             Key findings		                                                          8
everyone, everywhere can thrive. Mayors of C40
cities are committed to using a science-based                                                                Introduction | The greatest threat, the biggest
and people-focused approach to help the world
                                                                                                             opportunity									                                                   10
limit global heating to 1.5°C and build healthy,
equitable and resilient communities. Through                                                                    About this research							                                          12
a Global Green New Deal, mayors are working           The Centre for Research on Energy and                     Methodology Summary						                                           12
alongside a broad coalition of representatives        Clean Air (CREA) are a new independent
from labour, business, the youth climate              research organisation focused on revealing the
movement and civil society to go further and
                                                                                                             Chapter 1 | Current national plans and the “ambition gap”              14
                                                      trends, causes, and health impacts, as well as the
faster than ever before. The current Chair of         solutions to air pollution.
C40 is Mayor of Los Angeles Eric Garcetti; and                                                               Chapter 2 | What’s at stake for C40 cities                             20
three-term Mayor of New York City Michael R.
                                                                                                               The high price of air pollution                                      22
Bloomberg serves as President of the Board.
C40’s work is made possible by our three                                                                       Creating jobs while cleaning the grid                                28
strategic funders: Bloomberg Philanthropies,                                                                   Lower investment costs, cleaner electricity                          30
Children’s Investment Fund Foundation (CIFF),
and Realdania.
                                                      Vivid Economics is a strategic economics               Chapter 3. How cities can accelerate the transition
To learn more about the work of C40 and our           consultancy spanning public policy and support         from coal to clean energy                                              32
cities, please visit our website, or follow us on     for commercial decision making with a broad,              Rapidly phase out coal                                              34
Twitter, Instagram, Facebook and LinkedIn.            international focus.
                                                                                                                Shift demand from coal to clean energy                              38
                                                                                                                Reduce demand                                                       40
                                                                                                                Accelerate renewable generation                                     40
                                                                                                                Ensure an equitable and just transition                             42

                                                                                                             Key takeways                                                           44
                                                                                                             Endnotes                                                               46
                                                                                                             Authors & Acknowlegements                                              48
Wellcome supports science to solve the urgent         The Center for Global Sustainability
health challenges facing everyone. They support       (CGS) at the University of Maryland utilizes a
discovery research into life, health and wellbeing,   collaborative, interdisciplinary approach to deliver
and they are taking on three worldwide health         research, education, and engagement for policy
challenges: mental health, global heating and         impact. CGS was created in response to the global
infectious diseases.                                  need for integrated analytics and engagement
                                                      to support higher ambition in achieving climate,
                                                      development, and sustainability goals.

                                                                                                                                              THE HEALTH AND ECONOMIC CASE FOR A CLEAN ENERGY REVOLUTION
Glossary                                                                                                       Acronyms

1.5°C scenario             The 1.5°C scenario is based on greenhouse gas emissions reductions from coal-       CO2
                                                                                                                   carbon dioxide
                           generated electricity in line with the Paris Agreement and assumes that cities
                                                                                                               COVID-19   coronavirus disease 2019
                           in OECD countries transition to 100% renewable electricity by 2030 and cities in
                           non-OECD countries by 2050.                                                         GDP        gross domestic product

Air pollution              Air pollution refers in this report to PM2.5, NO2 and SO2 as these are the          GHG        greenhouse gas
                           pollutants included in the study.
                                                                                                               GW		       gigawatt

Cardiovascular disease A cardiovascular disease is a disease relating to the heart and circulatory system,     IEA        International Energy Agency
                       including stroke and problems with arteries or veins in other parts of the body.
                                                                                                               IPCC       Intergovernmental Panel on Climate Change

Current plans scenario     Current plans scenario is based on coal-fired power plants within the Global        LCOE       levelised cost of electricity
                           Energy Monitor’s Coal Plant Tracker. The analysis includes: operating plants;
                           plants in the pipeline - including pre-construction plants (announced,              MW         megawatt
                           pre-permit and permitted) and plants in construction; and plants already
                                                                                                               MWh        megawatt-hour
                           scheduled for retirement.
                                                                                                               NDC        Nationally Determined Contribution
Coal capacity              Coal capacity refers to the amount of electricity operating coal power plants can
                           produce when running at full power.                                                 OECD       Organisation for Economic Co-operation and Development

                                                                                                               PV         photovoltaic
Direct jobs                Direct jobs are those which are a direct output from investment on the
                           intervention, for example labour required to deliver an intervention.               USD        United States dollar

Indirect jobs              Indirect jobs are those which are supported across the supply chain.

Mortality rate             Mortality rate refers to the deaths in the population.

Nitrogen oxides (NOX)      NOX are poisonous gases that stem from combustion processes, such as
                           electricity generation.

Particulate matter (PM) PM is the mixture of solid particles and liquid droplets in the air.

PM2.5                      PM2.5 is the mass concentration for every cubic metre (m3) of air particles with
                           a diameter of less than 2.5 micrometres (μm). Often called “fine particulate
                           matter”, these air particles can penetrate deep into the lungs.

Respiratory disease        Respiratory disease is an illness relating to the lungs.

Sulphur dioxide (SO2)      SO2 is a toxic gas and major air pollutant derived from burning sulphur-
                           containing fossil fuels.

4                                                                                                                                                         THE HEALTH AND ECONOMIC CASE FOR A CLEAN ENERGY REVOLUTION
Executive summary

There is no place for coal in a climate-         The findings, which describe impacts on         The scale of the ambition gap is huge.             Urban action on coal can provide an
safe world. Phasing out coal is the single       61 C40 cities across 27 countries between       Our research shows that to stay in line with       essential contribution to achieving 1.5°C.
biggest step we can take to keep global          2020 and 2030, are based on detailed city-      a 1.5°C scenario coal capacity in and around       A rapid phase out of coal from C40 city’s
heating below the 1.5oC threshold. Coal is       by-city modelling and present a clear urban     C40 cities needs to decrease by 61% between        electricity could prevent around 1.3 GtCO2e
the largest source of electricity in the world   case for the rapid phase-out of coal and        2020 and 2030. However, current coal plans         of GHG emissions. If C40 cities collaborate
– and the largest source of greenhouse gas       transition to clean energy.                     within 500 km of C40 cities will actually          with other stakeholders to phase-out all
emissions, accounting for more than 30% of                                                       increase coal capacity by 4% over this period.     coal-generated electricity across their
energy-related CO2.                              Coal is deadly for cities. Based on                                                                surrounding energy region, the avoided
                                                 currently announced national coal policies,     It doesn’t have to be this way. Clean              emissions increase to a cumulative total of
Cities are at the centre of the global           264,900 people could die prematurely due        energy alternatives already exist and there        24 GtCO2e, equivalent to 6% of the world’s
energy transition. They account for              to air pollution caused by coal-fired power     is no excuse for new coal capacity. All urban      total remaining carbon budget.
two-thirds of global energy use – meaning        plants. With a rapid transition to clean        residents deserve to live in cities that are
they both influence and are influenced by        energy, many of these lives could be saved.     free from coal. Given the urgent nature of         Cities are already leading the energy
the shift from coal to clean energy, and                                                         the climate crisis, rapidly phasing out coal is    transition by actively phasing out coal,
the impact of this on climate, health and        Coal affects all aspects of residents’          critical to keeping global temperature rise to     shifting demand to clean energy and
prosperity.                                      health, contributing to 121,100 preterm         below 1.5°C. Critically, it also presents a huge   accelerating renewable energy generation.
                                                 births, 93,600 new asthma cases among           opportunity for cities to save on energy           Cities are also playing a pivotal role in calling
This report presents new evidence for            children and 247,900 asthma emergency           costs, create jobs and promote healthy and         for and supporting wider stakeholders –
the urban case for a rapid coal phase-           visits. As many as 353,400 years of life will   sustainable futures.                               including national governments and other
out. C40’s analysis provides compelling          be affected by diabetes, stroke and chronic                                                        urban energy users – to transition from coal
evidence of the adverse impact of coal-fired     respiratory diseases due to air pollution       Phasing out coal will deliver a green, just        to clean energy.
electricity on GHG emissions, air pollution      from coal plants.                               and prosperous future. A rapid phase-out
and health, jobs and the cost of energy.                                                         of coal in favour of renewable, zero-carbon        If the world is to stand a chance of
                                                                                                 technologies could create 6.4 million jobs         preventing catastrophic runaway global
                                                 The economic costs of this health
                                                                                                                                                    heating, we need a massive expansion
                                                 burden are significant. Premature deaths        – which is 1.1 million more jobs than would        of clean, zero-carbon energy, and not to
                                                 from coal power could cost C40 cities           be created under current plans. Many cities        look to other polluting fossil fuels like
                                                 USD 877 billion. Between 2020 and 2030,         are already realising this opportunity – and       natural gas. Cities have a huge amount
                                                 124 million sick days could result from         making sure no-one is left behind as they          to lose, or gain, depending on whether a
                                                                                                                                                    clean energy transition is rapidly realised
                                                 exposure to air pollution from coal plants,     do. This means engaging and upskilling the
                                                                                                                                                    or not.
                                                 including 9.2 million days in 2019 alone.       communities that will be affected by the
                                                 The economic impact of these absences is        transition and ensuring that green jobs are
                                                 estimated at USD 10 billion.                    accessible.

6                                                                                                                                        THE HEALTH AND ECONOMIC CASE FOR A CLEAN ENERGY REVOLUTION
Key findings
    findings
    1   Cities are at the centre of the global energy transition.                                  4   It doesn’t have to be this way.
                                                                                                                           Renewable energy is already cheaper than operating coal

2/3                                38%                              68%                                                    in half of the countries modelled and costs continue to
                                                                                                                           decrease
                                                                    of global coal capacity
of global energy use is in         of the electricity grid is
                                                                    located 500 km around
cities                             powered by coal                                                                         By the early 2030's renewables will be cheaper than coal in all
                                                                    C40 cities
                                                                                                                           countries

    2    There is no place for coal in a climate safe world.                                       5    Cities can produce cheaper electricity, while creating
                                                                                                        many good, green jobs and improving air quality.
        Coal is responsible for    The ambition gap: current        Between 2020 and 2030,
        0.3ºC                      national plans will increase
                                   coal capacity by
                                                                    this represents:
                                                                                                          1.1 million more jobs
                                                                    24Gt
        of the 1°C global
        heating we’ve already      +4%                                                                    could be created with a transition to
                                                                                                          renewable energy compared with
        experienced
                                   ...when it needs                 CO2 =                6%               current coal plans
                                   to reduce by                     for plants   of the world’s                                    5.3 million
                                   -61%                             500 km
                                                                    around
                                                                                 remaining
                                                                                 carbon                                                      6.4 million
                                   to comply with a                 C40          budget to
                                   1.5ºC scenario                   cities       2030

    3   Coal air pollution affects all aspects of residents’ health.                              Cities are already leading the energy transition.
                                                                                                  Cities can take action to phase out coal, stop new
        Between 2020 and 2030, current coal plans could lead to:                                  projects, invest in renewables and engage with the
                                                                                                  just transition.
264,900                                            121,100
                                                                                                  Discover how cities can engage in their energy
premature deaths                                   preterm births
                                                                                                  transition in this report
                                                       93,600
                                                       new asthma
                                                       cases
                                                       among
                                                       children

              353,400              Air pollution is unfair. While
              years of life with   cities as a whole are impacted
              disabilities         by air pollution from nearby
                                   coal plants, some neighbour-
                                   hoods are disproportionately
              247,900              affected. The economic costs
              asthma               of this health burden impacts
              emergency            the whole economy.
              visits

8                                                                                                                                        THE HEALTH AND ECONOMIC CASE FOR A CLEAN ENERGY REVOLUTION
Introduction:
The greatest threat, the biggest
opportunity
Coal is the world’s largest source of anthropogenic power plants, 68% is located within 500 km of at Currently 10
Currently, 10nations
nationsaccount for
contain 86%ofofthe
86% theworld’s
world’s total 1/3 of the world’s
CO2 emissions and is responsible for more than least one C40 city, representing a significant source total coal capacity. CO2 energy-related
capacity
0.3°C of the 1°C global warming we’ve already of urban air pollution. emissions come
experienced.1 It is also a significant source of toxic Germany
Poland from coal power
air pollutants – particularly sulphur dioxide (SO2), The transition from coal to clean energy is critical plants.
Indonesia
nitrogen oxides (NOX) and particulate matter to achieving the goals of the Paris Agreement, and
South
(PM2.5), all of which have serious and deadly effects offers enormous benefits. Decarbonising electricity Africa Turkey 1/3 of
on people’s health. used by cities will lead to huge reductions in
urban GHG emissions and air pollution, while United States Japan Russia
CO2 e
The IPCC’s Sixth Assessment Report on climate also creating good green jobs and providing
232 GW 49 GW 43 GW emiss
science is unequivocal: we are not on track to meet increasingly cheaper and more secure energy. from
Coal
our commitment under the Paris Agreement, with It is imperative, however, that we ensure that Other power plants
fossil plants
global heating set to greatly exceed 1.5°C above the benefits of the energy transition are fairly fuels
pre‑industrial levels before 2040. Global coal-fired distributed, adopting the principles of a green
power generation contributes more than 30% of and just transition. Similarly, we must recognise Other
India Other coal
global energy-related CO2 emissions,1 making it the differentiated responsibility for delivering the China
use
1,046 GW 233 GW 280 GW
greatest single threat to a climate-safe future.2 transition. This is particularly relevant for coal
given its historic and current role in industrial and
Cities are at the centre of the transition from coal economic development. Source:
Source: The Bloomberg Coal data based(2021).
Countdown on the Bloomberg
IEA countdown
Fuel and technologies (2021).
(2018). Source: data based on the International Energy Agen
to clean energy, accounting for approximately
two-thirds of global primary energy use.3 They
are already leading the way by actively phasing
out coal, shifting demand to clean energy and
Cities are at the centre of the global Why developed countries should lead the transition from coal
accelerating renewable energy generation. C40 energy transition.
mayors have committed to the goals of the Paris
Agreement through their 1.5°C-compliant Climate The economic growth and increasing levels of is 20 years – little over halfway to the global
Action Plans. Decarbonising electricity supply – 68% of global 2/3 of global prosperity to which coal use has contributed average retirement age of 35 years in operation.5
and in particular rapidly phasing out coal – is a coal capacity energy use is in over the past 200 years4 has largely benefited This means that it will be less challenging for
located 500 km developed nations. At the same time these OECD countries to complete a coal phase-out by
critical aspect of this commitment; emissions from cities
coal-generated electricity account for 11% of C40 around nations have contributed disproportionately to 2030 that minimises stranded assets.
global emissions and therefore bear a greater
cities’ total greenhouse gas (GHG) emissions. A C40 cities.
responsibility than developing nations to rapidly Significant near-term GHG emission cuts by
phase out coal. wealthier OECD countries will provide non-
People in cities are dying prematurely and
OECD countries with more time to replace their
suffering lifelong health conditions as a result of air
Moreover, OECD countries also generally have electricity systems and help workers within the
pollution from coal-fired power plants. Air pollution older coal plants, with many that already are at coal industry to transition to other sectors, while
from coal power plants can travel hundreds of or near their expected retirement age. While the getting the world on track to limit global heating
kilometres. Of the current global coal fleet, which average age of plants in non-OECD countries to 1.5°C.
includes both existing and planned coal-fired
A Based on 30% GHG emissions from electricity (source data: C40 GPC Inventories), and an average of 38.5% of electricity
coming from coal (source IEA (2018) www.iea.org/reports/coal-2018)
10 THE HEALTH AND ECONOMIC CASE FOR A CLEAN ENERGY REVOLUTION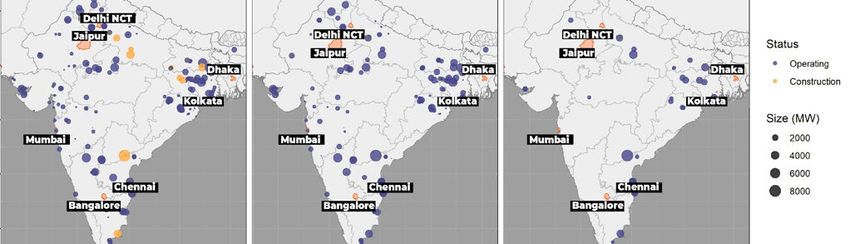
About this research                                        Air pollution modelling: Using reported
                                                           annual emissions data from coal power plants for
Cities know that coal-fired power plants are major         NOX, SO2 and PM2.5 and a complete atmospheric
polluters but, for the first time, this research           model (specifically the CALPUFF atmospheric
quantifies the impact of this pollution on the             model, which takes into account meteorological
health of urban populations and the economic               conditions, topography and atmospheric chemical
consequences of this. It also analyses the                 reactions), we modelled the concentration of
employment and cost impacts of coal compared               air pollutants from coal-fired power plants in
with clean energy.                                         all C40 cities located within 500 km of these
                                                           plants (identified using Global Energy Monitor’s
The findings in this report provide compelling             Global Coal Plant Tracker and additional national
evidence of the adverse impact of coal on urban            resources). We selected an area of 500 km because
GHG emissions, air pollution and health, jobs and          emissions from coal plants travel long distances,
the cost of energy. For cities the case is clear: we are   across jurisdictional borders, and because
calling for more ambitious national commitments            electricity used within a given city can be produced
to rapidly phase out coal through the immediate            up to several hundred kilometres from the city.
cessation of new coal capacity and swift retirement
of existing capacity.                                      The results of this modelling showed that 61 C40
                                                           cities were substantially impacted by air pollution
                                                           from coal-fired power plants. These cities are the
                                                           focus of this research.
Methodology summary
                                                           Health modelling: We analysed the impact
Our modelling is based on two future scenarios.            of this air pollution on public health and the
The first, a “1.5°C scenario”, is based on GHG             economic burden of these health impacts using
emissions reductions in line with the Paris                concentration response functions.
Agreement. The second, a “current coal plans”
scenario, includes coal-fired power plants currently       Jobs modelling: We modelled the direct jobs
operating, and takes into account new plants in            resulting from the development of the electricity
the pipeline and scheduled retirements up to 2050          generation sector and indirect jobs that are
– in other words it represents the current path we         generated across domestic supply chains to
are on and the future we can expect unless action          compare the employment potential of current coal
is taken.                                                  plans with those of a transition to 100% renewable
                                                           energy in line with 1.5°C.
Developing the scenarios: The current coal
plans scenario is based on coal-fired power plants         Cost modelling: We analysed the cost impacts
within the Global Energy Monitor’s Global Coal Plant       of coal compared with clean energy. Using a
Tracker. The analysis includes: operating plants;          levelised cost of electricity approach, we modelled
plants in the pipeline - including pre-construction        how the average net present cost of electricity
plants (announced, pre-permit and permitted) and           generation for different power technologies will
plants in construction; and plants already scheduled       change over time. We projected the future cost of
for retirement. For the 1.5°C scenario we set a near-      different technologies using recent current costs
term goal for C40 cities in OECD countries to retire       and then applying learning rates, carbon prices and
100% of their existing coal fleet by 2030, while those     storage costs.
in non-OECD countries follow a less steep phase-
out trajectory with significant retirements during         Time frames: Our analysis looks primarily at
the 2030s, only a few ultralow emissions plants            impacts between 2020 and 2030. The baseline is

                                                                                                                                                                                  Credits: Kelly Lacy on Pexel
by 2040 and a complete phase-out by 2050. The              taken from 2019 as 2020 was not a representative
1.5°C scenario is based on a combination of IRENA          year due to COVID-19.
and IEA data to create a scenario that accelerates
the transition to renewable energy and minimises
natural gas and biomass, given associated GHG               See full methodology for details.
emissions and air pollution.

12                                                                                                                THE HEALTH AND ECONOMIC
                                                                                                                                      CALLING
                                                                                                                                          CASEFOR
                                                                                                                                               FORCOAL
                                                                                                                                                   A CLEAN
                                                                                                                                                        PHASE-OUT
                                                                                                                                                           ENERGY IN
                                                                                                                                                                   REVOLUTION
                                                                                                                                                                     C40 CITIES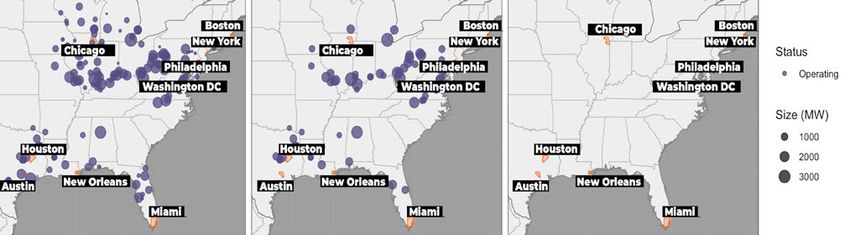
1.
          Chapter 1.
          Current national
          plans and the
          “ambition gap”

                                                                                          Credits: Bence Balla Schottner on Unsplash
14                           THE HEALTH AND ECONOMIC CASE FOR A CLEAN ENERGY REVOLUTION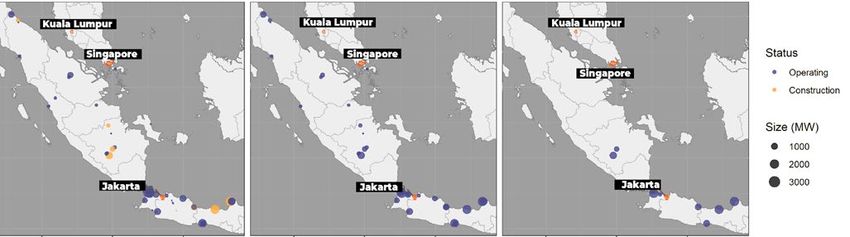
50
RETIREMENT GROWT
Chapter 1.
0
Global coal power growth and retirements over the past twenty years (GW)
Current national plans and the
50
Figure
Global
100
2:coal
Global coalgrowth
power power and
growth and retirements
retirements over the (GW), 2000–2020
past twenty years (GW)
0
1
2
3
4
5
7
6
7
8
9
0
1
2
3
4
5
6
8
9
0
200
201
200
200
201
201
200
201
200
201
200
201
200
201
200
201
202
200
201
200
201
“ambition gap”
100
GROWTH
50
GROWTH
50
0
RETIREMENT
80 countries use coal-generated electricity, with just 10 of these accounting for more 0
than 86%capacity
National of all operating status
by plantcoal capacity in 2021.GW globally).6 To date, 13 national
(GW) (2,067
RETIREMENT
governments have committed to phasing out coal by 2030,7 which affects 14 C40 50
cities.B However, our modelling reveals that in most countries there is a significant
0
1 001
2002
3003
40 0 4
5005
60 0 6
70 0 7
80 0 8
90 0 9
0 010
1 011
2 012
3 013
4 014
5 015
6 016
7 017
8 018
9 019
0020
ds
00 0
50
gap between current coal plans and what’s needed to avoid catastrophic global
201 2
201 2
201 2
201 2
201 2
201 2
201 2
201 2
2002
201 2
201 2
an
2002
2002
202 2
2002
2002
2002
2002
2002
2002
2002
es
heating (a 1.5°C scenario).
ica
rea
esh
erl
tat
es
a
bia
Afr
alia
eth
Ko
y
pin
tan
nd
dS
sia
esi
m
lad
an
d
o
ece
y
a
lom
tna
ina
aila
an
th
th
rke
lan
lay
on
xic
ilip
eN
ael
ite
str
kis
ssi
rm
ng
ia
Even more concerning, global coal power capacity within 500 km (and resultant increases in air
ly
Sou
Sou
Jap
Gre
Ind
Ind
Vie
Ch
Ma
Me
Un
Au
Ru
Co
Po
Pa
Ph
Isr
Ita
Ge
Ba
Th
Tu
Th
is still being increased, with planned expansions in pollution and GHG emissions) are in China, India,
1,000
capacity – that is, coal-fired power plants that are Bangladesh, Indonesia and Vietnam.C
in the pipeline, either under active construction or Figure 3: Capacity of coal plants and plants in the pipeline vs retired plants
OPERATING & PIPERLINE
plantscapacity
National
and scheduled plant
by for status (GW)
retirement in 2021. (GW), 2021
by country
in pre-construction stages – exceeding planned It is worth noting that although China’s coal
National capacity by plant status (GW) in 2021.
100
retirements (Figure 2). expansion is the greatest globally (and its overall
coal capacity is increasing), it is the second leading
s ds
nlda n
Taken together, global coal projects under active country in retiring plants, with 115 GW retired and a
es
a
ea
h
tteast
cfar i c
s es
rhl ae r
construction and the pre-development stage further 12 GW to be retired by 2030.9
C hC dleasdhe s
rKeoar
as i a
i ab i a
lia
y ny
npei n
10
an
d
Sdt aS
as i a
m
A
amount to 481 GW of capacity, which exceeds
t heet
i
i an
d
oi c o
ie
ce
yk e y
r
a l iraa
as i a
an a
l obm
na
tKho
t ai snt
a
n
tAhf
T h T nld
an
s iy
osn
l i ip
m
eN
el
eidt e
erm
Our analysis identifies 19 C40 cities (31% of C40
l ag
i ad i a
i nhai n
the entire combined 2019 capacity of the United
pa
l aayl a
s turs t
erceee
d
p
l ya l y
de
x iecx
tineat
l oom
an
k iask
u tohu
s sui s
a erla
a ihl aa
u tohu
e hNe
an
r kuer
l aonl
i l ihpi
on
i tn
rm
ng
cities analysed) that will see a net reduction
I n dI n
I n dI n
States (233 GW) and the European Union (143 GW)
Isr Is
M aM
M eM
U nU
A uA
R uR
C oC
PaP
P oP
I t aI t
B aB
G eG
G r eG
So S
V i eV
P hP
Th T
Tu T
So S
J a pJ
0 8 Our analysis of currently announced (or no change) in coal powered capacity by 2030. 1,000
by 28%.
1,000
expansion and retirement plans finds that, These cities are mainly located in the US and the
& PIPERLINE
RETIREMENT
EU, the two major regions where a steady phase-
& PIPERLINE
between now and 2030, 42 cities will see coal
power capacity within 500 km increase (69% of C40 out of coal-generated electricity is occurring. 100
10 100
cities analysed). The C40 cities that will experience
the most significant increases in coal capacity
OPERATING
RETIREMENT OPERATING
10
10
100
Figure 1: Status of coal power plants, global average 2021.
0
0
65% 6% 9% 12% 7%
In operation 2,067 GW Retired 396 GW RETIREMENT
10
Under active construction 184 GW Scheduled for retirement by 2030 224 GW 10
Pre-construction (announced, pre-permit or
permitted) 297 GW
100
Source: data from the Global Energy Monitor July 2021 update. Excluded Argentina, Jordan, Ivory Coast and Singapore which 100
had low or no domestic coal capacity
Source: data from the Global Energy Monitor July 2021 update. Excluded Argentina, Jordan, Ivory Coast and
Singapore which had low or no domestic coal capacity
B Amsterdam, Rotterdam, Lisbon, Paris, Rome, Milan, Venice, Athens, Toronto, Montreal, Vancouver, Auckland, Copenhagen, 65%
65% 6%
6% 9%
9% 12% 7%
12% 7%
and Tel Aviv.
Source: In
data from the Global
operation Energy
GW Monitor July 2021 update. Excluded
2,067GW Argentina,
Retired GW
396GW Jordan, Ivory Coast and Singapore which
C In the case of Athens, within 500 km there are a number of planned power plants in Western Turkey. In operation 2,067 Retired 396
had low or no domestic coal capacity
Under construction184
activeconstruction
Underactive GW
184GW Scheduled forretirement
Scheduledfor retirementby 2030 224
by2030 GW
224GW
Pre-construction(announced,
Pre-construction pre-permit
(announced,pre-permit or
or
16 THE HEALTH AND ECONOMIC CASE FOR A CLEAN ENERGY REVOLUTION
permitted)297
permitted) GW
297GW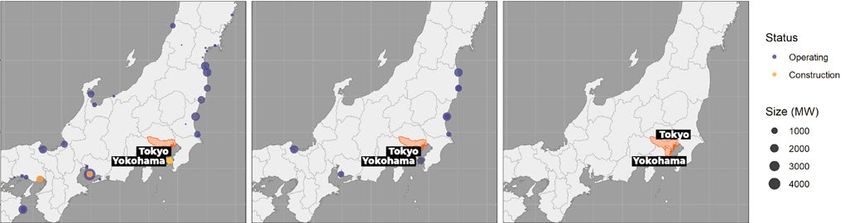
1 Cities are at the centre of the global energy transition. 4 It doesn’t have to be
Renewa
2/3 38% 68% in half
decreas
Figure 4: Comparing projected CO2 emissions (Mt CO2 per year) from coal power Overall, however, the modelling clearly of shows When considering the GHG ambition gap over the
global coal capacity
of the electricity grid is
of global energy use is in the scale
under a current coal plans scenario and a 1.5°C scenario in the 10 biggest coal-users of the ambition
powered by coal
gap. A 1.5°C located
scenario500 km around
period 2020-2050, the avoided emissions from the
cities By the
Projected
countries, coal power CO2 emissions (Mt CO2 per year): the ambition
1990–2050. C40 cities
requires that coal capacity in and around C40 cities 61 cities phasing out coal from their electricity use countri
gap between country plans and a 1.5oC-compliant scenario decrease by 61% between 2020 and 2030. However, is around 6.4 GtCO2e. Including the entire energy
current coal plans within 500 km of C40 cities will region the difference between a current coal
actually increase coal capacity by 4% between 2020 plans scenario and a 1.5°C scenario increases to a
2 There is no place for coal in a climate safe world.
and 2030. Citiesiscan
cumulative total of 120 GtCO25e. If nothing doneproduce c
C40 cities, 1,389 GW
Current plans (announced to shift current coal plans, then the many good, green jo
coal plants
8K Coal is responsible for The ambitiongap:
Theambition gap: current Between 2020 and 2030,
openings and retirements) current coal plans will
this represents: within these 61 cities and their energy regions
7K
+4% Current plans 0.3ºC
1.5ºC compliant scenarioof the 1°C global
national plans will increase
increase coal
coal capacity by capacity by will consume 30% of the entire world’s 1.1remaining
million more jo
6K 24Gt Ambition gap heating we’ve already +4% 24Gt carbon budget for 2050. could be created with a
renewable energy comp
5K
CO2 experienced
...when it needs CO2 = 6%
Even in countries that are expected current
to coal plans
see a net
to reduce by for plants reduction
of the world’s in coal capacity, the pace of change is not
4K
The ambition
gap: CO2
China, 1,046 GW
+17%
-61% 500 km
around
remaining
in line with a 1.5°C trajectory. We need to accelerate
carbon
the retirement of existing coal fleets, stop the
to comply with a C40 budget to
3K emissions that
could be avoided 4K 1.5ºC scenario cities 2030construction of new coal plants and expand clean,
-61% with a
Key findings
2K
-32% zero-carbon energy. Swift and ambitious urban
1.5ºC compliant scenario action on coal over the next 10 years can provide an
2K
1K
essential contribution to keep the world on track
3 Coal air pollution It is affects all aspects
clear that coal-fired powerof residents’
generation is health. Cities are already leading the ene
for 1.5°C. By influencing their wider energy regions
Cities can take action to phase ou
1990 2010 2030 2050 1990 2010 2030 Between 2020 and
2050 2030, with
incompatible climatecoal
current In total,could
goals.plans the to: can have an out-sized projects,
lead cities impact, increasing the
invest in renewables and
1 Cities are at the centre of the global energy GHG ambition transition.
gap between a current coal plans 4
avoidedIt doesn’t have
emissions 10-fold towhile
– just
all beimproving
this way.
transition.
scenario and a 1.5°C scenario is enormous. If the
India, 233 GW United States, 232 GW Japan, 49 GW 264,900 121,100
61 C40 cities in thispretermstudy phased-out coal from
public health and generating millions of good,
Discover how
Renewable citiesiscan
energy engage
already c
+20% births green energy jobs.
68%
premature deaths transition in this report
38% in half of the countries modelle
1,500
2/3
300 -1% their electricity use in line with a 1.5°C scenario this
1K
would of avoid
global around 93,600
1.3
coal capacityGtCO2e between 2020 and decrease
-22% 1,000
of the electricity grid is
of
-32% global energy
200
use is in 2030,located
compared 500tokm new asthma
aroundcoal plans scenario.
a current
500 cities powered by coal cases Urban action on coal can By the early 2030's
provide a renewables
500 100 C40 cities
If these 61 cities work with other stakeholders to
among countries
major contribution to achieving 1.5°C,
-100% -100% phase out all coal-generated childrenelectricity across each
of their respective 500 km energy regions, the total
preventing around 1.3 GtCO2e from cities’
1990 2010 2030 2050 1990 2010 2030 2050 1990 2010 2030 2050
own electricity demand, and through
avoided emissions increases to 24 GtCO2e. These
353,400 24 GtCO Air e pollution is unfair. While this influencing a wider phase-out of
2 There is no place for coal in years a climate safe
of life with world.
2
cities
of emissions
as a whole are
savings
impacted
represent 6% of the 5 Cities canelectricity
coal-generated produceofcheaper 24 GtCO2,electricit
Russia, 43 GW South Africa, 42 GW Germany, 41 GW world’s total remaining carbon budget for limiting
disabilities by air pollution from nearby many good, green jobstotal
equivalent to 6% of the world’s and improvin
250
Coal is responsible for The ambition gap: current global heating
Between
coal to
plants, 1.5°Cand
2020
some (400 GtCO2e).
2030,
neighbour- remaining carbon budget
0.3ºC
200 -6%
200
200 national plans will increase this
hoods represents:
are disproportionately
150 -29%
150 coal capacity
-26% 247,900
by affected. The economic costs 1.1 million more jobs
24Gt
of the 1°C global
+4%
100
asthma of this health burden impacts could be created with a transition to
100
heating100 we’ve already emergency the whole economy. renewable energy compared with
6%
-77%
experienced visits
CO2 =
50 50
-88%
-100%...when current coal plans
it needs
1990 2010 2030 2050 1990 2010 2030 2050 1990 2010 to reduce
2030 2050by for plants of the world’s 5.3 million
-61% 500 km
around
remaining
carbon 6.4 million
Indonesia, 36 GW South Korea, 35 GW Poland, 30 GW to comply with a C40 budget to
+127% 250 1.5ºC scenario cities 2030
+7%
150
300 200 -10%
150 100
200 +27%
100
100 3 air pollution affects all aspects of residents’ health.
Coal 50 Cities are already leading the energy transition.
50 Cities can take action to phase out coal, stop new
-100% Between 2020 and 2030,-100% current coal plans could lead to: projects, invest in renewables and engage with the
1990 2010 2030 2050 1990 2010 2030 2050 1990 2010 2030 2050 just transition.
264,900 121,100
Discover how cities can engage in their energy
premature deaths preterm births
transition in this report
Source: C40 modelling, based on the Global Energy Monitor plant tracker (January 2021).
93,600
18 new asthma THE HEALTH AND ECONOMIC CASE FOR A CLEAN ENERGY REVOLUTION
cases
amongChapter 2.
What’s at stake
for C40 cities
Credits: Andre Moura on Pexel
20 THE HEALTH AND ECONOMIC CASE FOR A CLEAN ENERGY REVOLUTIONCurrent power plants expansion could lead to major health
Chapter 2. impacts over the next decade (2020-2030):
What’s at stake for C40 cities Figure 6: Health impact of coal-power plants in 61 C40 cities, 2020-2030.
264,900 121,100 353,400 years of
premature deaths preterm life with disabilities
births
The high price of air pollution 93,600 247,900
new asthma asthma
cases among emergency
Coal-fired power plants pollute city air For example, in Australia – which has a per capita children visits
GDP of USD 52,51810 – permitted emission levels
Air pollutants from coal-fired power plants can for NO2 and PM2.5 are more than five times higher
travel long distances, crossing political and than in the EU (GDP per capita: USD 33,92711) and Coal air pollution is a Air pollution affects It impacts people’s lives,
geographical boundaries. Using reported annual eight times higher than the hourly regulation large contributor to babies and children’s and puts pressure on
emissions data from coal power plants and rate in China12 (GDP per capita: USD 10,50013). premature mortality development healthcare systems
an atmospheric model, we have modelled the This is because emission regulations in Australia
concentration of air pollutants in 61 C40 cities only apply to new coal power plants and the vast Source: C40 modelling. For further information on the data, see the methodology
that comes from coal-fired power plants located majority of existing plants are more than 30 years
within 500km to understand the full extent of coal’s old. Similarly, South Africa’s comparatively high
impact on city health. pollution has much to do with Eskom, the country’s Air pollution causes ill-health and early Our research shows that between 2020 and 2030,
main utility provider, delaying its compliance with death air pollution from neighbouring coal power plants
The C40 cities that are exposed to the most could cause more than 93,600 new asthma cases
minimum emission standards and installation of
polluting plants are located in South Africa, Exposure to air pollutants is linked to a wide range among children and 247,900 asthma emergency
pollution control technologies.
Australia, India, Thailand, Vietnam, Turkey and of adverse health outcomes. Air pollution affects visits in C40 cities (with 7,500 new asthma cases
Indonesia. Importantly, the amount of air pollution Our modelling also shows variation in all people but can be especially harmful to a city’s and 18,500 emergency visits in 2019 alone).
generated by coal-fuelled power plants depends concentrations of air pollutants within cities, most vulnerable populations, such as children,
more on political choices and jurisdictional highlighting the inequity and injustice of air pregnant women, older people and those with Air pollution exposure also significantly increases
regulations, controls and enforcement than on pollution. Of the 61 C40 cities modelled, 29 have pre-existing medical conditions.16 the risk of preterm birth and low birthweight,
factors like the level of a country’s economic one or more coal power units located within which increases the risk of infant death, lifelong
development. Our modelling shows that if the current planned health damage, diabetes and cardiovascular
the city boundaries. This proximity means that
expansion of coal power were to be realised, diseases. Our research finds that between 2020
some neighbourhoods are more exposed than
264,900 residents could die prematurely between and 2030, coal-fired power plants surrounding
others to pollutants, which has significant equity
2020 and 2030. Air pollution from operating C40 cities could cause as many as 121,100 preterm
implications. In the case of Chicago, for example,
Figure 5: Average emissions rates for coal plants caused more than 19,100 premature births. In 2019 alone, 9,600 preterm births in C40
the Will County Generating Station and the
coal power plants per country deaths in 2019 alone. The C40 cities expected to cities can be attributed to coal power plants.
Ingredion Incorporated Argo Plant affect the city’s
(tonnes
Emission of average
rates NO2/MW),from 2019.
coal plants (tonnes of NO₂ / MW)
west, southwest and south neighbourhoods far
experience the biggest health burden today are
located in South Africa, India, Indonesia, China, In addition, air pollution exposure increases the
more than the rest of the city (see the online videos
the US and Vietnam. The negative health impacts risk of diseases such as diabetes, stroke and
below). This variation in neighbourhood exposure
can be attributed both to their high exposure to chronic respiratory illnesses, as well as increasing
exacerbates existing social inequalities in the city, as
24.8 14.5
the West and South-side neighbourhoods contain
pollution from coal-fired power plants, as well as complications for patients with those pre-existing
their relatively high population densities. conditions and those facing existing inequalities.
12.4 9.4 8.9
a greater share of lower-income households than
In total, 353,400 years of life could be affected by
the city at large.14 These findings add weight to a
Air pollution exposure can contribute to the diabetes, stroke and chronic respiratory diseases
growing body of evidence on the disproportionate
development of asthma and trigger asthma due to air pollution from coal plants in C40 cities
impact of air pollution exposure on marginalised
South Africa Australia Vietnam India Indonesia
attacks – a chronic condition that affects health between 2020 and 2030.
communities.15
and well-being over a person’s lifetime. For
4.0 3.23.2 3.1 2.6 0.6 children, increased asthma attacks and sickness
To visualise the effect of air pollution A rapid phase-out of coal,
days affect educational performance and can force
from coal power plants in your city, and transition to clean energy, could
primary caregivers to take time off work.
explore our city videos here. prevent these health impacts, saving
Japan United South Germany China lives and improving health.
States Korea
Source: C40 modelling based on the Global Energy Monitor Plant tracker and annual self-reported emissions from plants (2019).
22 THE HEALTH AND ECONOMIC CASE FOR A CLEAN ENERGY REVOLUTIONFigure 7: Premature
Premature deaths deaths due 2019
due to coal: to airexisting
pollution from
plants coal in
against C40announced
2030 cities: current
plans2019 Figure 8: Deaths in C40 cities attributable to coal power pollution, 2020–2030
burden against and
(retirements current plans for 2030
expansion) Figure 8 highlights how an early retirement, in line with a 1.5°C scenario (orange), could prevent the
2019 coal plants Announced coal plants in 2030 majority of premature deaths from current plans (black). The faster the phase-out is, the smaller the health
burden will be for cities.
500 1,000 1,500 2,000 2,500 3,000 3,500
Kolkata
C40 cities
Johannesburg
30K Current plans (announced
Jakarta openings and retirements)
Tshwane
1.5ºC compliant scenario
Ekurhuleni
20K Premature deaths that
Beijing Premature
could be avoided
deaths that
Shanghai
could be
Chicago avoided
Mumbai Abidjan Amman
10K
Hanoi 3
60
Qingdao 2
40
Kuala Lumpur
1
20
Wuhan
Tokyo 2020 2030 2050 2020 2030 2050
2020 2030 2040 2050
Istanbul
Source: authors own modelling, based on the Global Energy Monitor plant tracker (January 2021).
Nanjing Amsterdam Athens Austin Bangkok Beijing
150
80
Chennai 400
20 1000
100 60
Delhi NCT 300
40 200
Ho uston 10 50 500 200
20 100 150
Washington DC
100
New York City 2020 2030 2050 2020 2030 2050 2020 2030 2050 2020 2030 2050 2020 2030 2050
50
Moscow
Dhaka Bengaluru Berlin Bogota Boston Chengdu
500 6
Bangkok 150 30
400
400
4
Dalian 300
300
100 20
200
Chengdu 200
2
50 10
100 100
Sydney
2020 2030 2050 2020 2030 2050 2020 2030 2050 2020 2030 2050
Bengaluru 2020 2030 2050
Philadelphia
Chennai Chicago Ciudad de Mexico Dalian Delhi NCT
Hangzhou
500
Warsaw 400 60
300 600
1000
Berlin 300 40
200 400
200
Guangzhou 500
20 100 200
100
Karachi
2020 2030 2050 2020 2030 2050 2020 2030 2050 2020 2030 2050 2020 2030 2050
Seoul
Ho ng Kong
Dhaka Ekurhuleni Fuzhou Guadalajara Guangzhou
Tel Aviv 1200 1200 150
10
Shenzhen 900 150
800 100
Zhenjiang 600 100
5
400 50
Ho Chi Minh City 300
8 50
Athens
2020 2030 2050 2020 2030 2050 2020 2030 2050 2020 2030 2050 2020 2030 2050
Aus tin
Amman
Hangzhou Hanoi Heidelberg Ho Chi Minh City Hong Kong
Singapore 250 2K
150
600
200 9
Fuzhou 1.5K
150 6 400 100
Melbo urne 1K
100
3 200 50
Ciudad de Mexico 50
0.5K
Yok ohama
2020 2030 2050 2020 2030 2050 2020 2030 2050 2020 2030 2050 2020 2030 2050
-
Source: C40 modelling. For further information on the data, see the methodology. Only the cities with a burden over 50
premature deaths per year are displayed. Source: C40 modelling. For further information on the data, see the methodology
24 THE HEALTH AND ECONOMIC CASE FOR A CLEAN ENERGY REVOLUTIONFigure 8 (end) The health burden of coal pollution
has huge economic costs
Houston Istanbul Jakarta Johannesburg Karachi
300 600 4K The impact of air pollution on urban health has • 124 million sick days, including 9.2 million
3K 2K
600
economic consequences through associated days in 2019 alone. Employees may be required
200 400
2K
400
healthcare costs, and the economic losses from to stay at home during pollution spikes due
100 200
1K
1K
200 disability and premature death. Air pollution also to personal illness or because of their role
4 impacts urban economies through a reduction as primary caregiver to a family member,
2020 2030 2050 2020 2030 2050 2020 2030 2050 2020 2030 2050 2020 2030 2050
in labour productivity and an increase in work increasing absenteeism.
absence.
Kolkata Kuala Lumpur Medellin Melbourne Miami • USD 10.5 billion from lost work, as a result
3K
600
3
60
12
We estimated these economic impacts from the of forced absence, which can greatly affect
2 8 health impacts of coal-fired power plants on the 61 individuals’ ability to earn a salary and support
400 40
2K
analysed C40 cities between 2020 and 2030: their families, especially among informal
4
1K 200 1 20
workers and the self-employed. Even among
• USD 651 million from childhood asthma, the formally employed, social insurance
2020 2030 2050 2020 2030 2050 2020 2030 2050 2020 2030 2050
schemes often fail to compensate for lost
2020 2030 2050
taking into account direct and indirect costs,
including medical costs and loss of income to wages.
Moscow Mumbai Nanjing New Orleans New York City
400 4
the child’s caregiver.
300
300
900
300 3
• USD 877 billion from premature deaths.
200 600
200 2
200 • USD 17.6 billion from years lived with disease.
100 300 100
Diabetes, chronic respiratory diseases and
100 1
stroke significantly lower the quality of life and
2020 2030 2050 2020 2030 2050 2020 2030 2050 2020 2030 2050 2020 2030 2050 economic productivity of people affected, and
cause substantial healthcare costs.
Philadelphia Qingdao Quezon City Rome Rotterdam
200
• USD 8.6 billion from early births, taking into
400
90 10
15
account healthcare costs and economic losses
150
60 10 associated with an increase in preterm births.
100
2050 200 5
30 5
50
2020 2030 2050 2020 2030 2050 2020 2030 2050 2020 2030 2050 2020 2030 2050
Seoul Shanghai Shenzhen Singapore Sydney
200
600 200 200 “Clean coal” technologies are not enough
150 100
150 150
400
100
200
50
100 100
Proponents of continued coal use maintain that However, the modelling shows that these plants
50 50 50
the most efficient of today’s “ultra-supercritical” contributions to GHG emissions and air pollution
2020 2030 2050 2020 2030 2050 2020 2030 2050 2020 2030 2050 2020 2030 2050
coal units, or units equipped with air pollutant – and resulting health impacts – remain high
emissions control devices, may be considered due to the significant capacity installed. These
Tel Aviv Tokyo Tshwane Venice Warsaw
150
1.5K 6 200 “clean” technology.17 technologies are not compatible with a healthy,
400
1K
150 1.5°C climate-safe future; all coal must be phased
300 4
100
100 China has led the development of “ultralow out urgently.
200
2050 50
100
0.5K 2
50 emission” plants with strict pollution-control
technologies that have significantly reduced
2020 2030 2050 2020 2030 2050 2020 2030 2050 2020 2030 2050 2020 2030 2050
SO2, NOX and particulate matter emissions, as
Wahsington DC Wuhan Yokohama Zhengjiang
well as energy efficiency requirements that
300
400
promote slightly lower CO2 emissions.
300 40 100
200
200
2050 20 50
100
100
2020 2030 2050 2020 2030 2050 2020 2030 2050 2020 2030 2050
2050
26 THE HEALTH AND ECONOMIC CASE FOR A CLEAN ENERGY REVOLUTIONSuggestion: include all cities instead of a selection
Suggestion: include all cities instead of a selection Suggestion: include all cities instead of a
Creating jobs while cleaning the grid Figure 9: Cumulative total jobs under current coal plans vs a 1.5oC-compliant
scenario, 2020–2030
Southwest Asia +17% more jobs in 1.5oC
Energy choices impact jobs – both directly as • The cities that see the greatestCurrent
proportional
coal plans
Southwest Asia
Current coal plans
+17% more jobs in 1.5oC scenario
scenario 1.5ºC compliant scenario Current coal plans
a result of the development of the electricity increase in job opportunities from1.5ºCan energy scenario
compliant 1.5ºC compliant scenario
Bengaluru
generation sector and indirectly through domestic transition are C40’s South African cities Bengaluru Bengal
supply chains. We have modelled the employment (Ekurhuleni, Johannesburg and Tshwane), Chennai
Chennai Africa +63% more jobs in 1.5oC scenario Chen
impacts of a rapid phase out of coal, comparing with 70% and 84% more Africa
jobs, +63% more
ranging jobs in 1.5oC scenario
from Delhi Africa +63% more jobs in 1.5oC scenario
Delhi D
current coal plans with a transition to 100% 23,000 (Ekurhuleni) and 78,000 (Johannesburg) Abidjan
Dhaka
Abidjan Abidjan
renewable energy in line with 1.5°C. cumulative jobs between 2020 and 2030. Other Dhaka Dh
Ekurhuleni Karachi
Ekurhuleni
C40 cities in Asia, such as Jakarta, Bangkok and Karachi Ekurhuleni Kara
Johannesburg Kolkata
Kuala Lumpur, are estimated to see 206,000,
Our modelling suggests that a transition Johannesburg Kolkata Johannesburg Kolk
to 100% renewable energy in line with 177,000 and 48,000 cumulative jobs, equal to Tshwane Mumbai
Tshwane Mumbai Tshwane
a 42%, 29% and 76% increase compared to a Mum
1.5°C could create as many as 6.4 million 0 20 40 60 80 100
0 20 40 60 80 100 0 50 100 150 200 250 300
0 50 100 150 200 250 300
jobs between 2020 and 2030 This is 1.1 current plants scenario, respectively. 0 20 40 60 80 100
million more than the 5.3 million jobs that China +17% more jobs in 1.5oC scenario Europe +18% more jobs in 1.5oC scenario
• China
Several European C40 +17% more jobs in 1.5oC scenario
cities also see a Europe +18% more jobs in 1.5oC scenario China +17% more jobs in 1.5oC scenario
would be created under current plans.
Beijing
significant number
Beijing of jobs under a 1.5°C Athens
Athens Beijing
Chengdu Athe
scenario. In Moscow, Istanbul and Warsaw, it Berlin
Chengdu Chengdu
Berlin
A transition to renewable is estimated that there will be 216,000, 88,000, Dalian Be
Dalian He ide lberg
Dalian
energy could create and 34,000 green energy jobs, equal to an He ide lberg
Fuzhou He ide lb
Fuzhou Rome
1.1 million more jobs than increase of 10%, 21% and 38%, respectively, Rome
Fuzhou
Guangzhou Ro
current coal plans compared to current plans.
Guangzhou Rotterdam
Guangzhou
Hangzhou
Rotterdam Rotterd
Hangzhou Hangzhou
Venice
• In Tokyo, Yokohama and Seoul, job creation
Hong Kong
Hong Kong
Venice Ven
Hong Kong
Warsaw
5.3 million under a 1.5°C scenario are 20%, 10% and 32% Nanjing
Warsaw
Nanjing Wars
greater than under a current plans scenario, Nanjing
Qingdao Amman
6.4 million respectively. Qingdao
Amman
Qingdao Amm
Shanghai Amsterdam
Shanghai Amsterdam Amsterd
Shanghai
While the transition to a renewable energy Shenzhen Istanbul
All 61 C40 cities included in the analysis see an Shenzhen Istanbul Shenzhen Istan
provides more jobs, it is important to recognise Wuhan Moscow
increase in job creation under a 1.5°C scenario, Wuhan Moscow Wuhan Mosc
that a significant overhaul of the energy sector Zhenjiang Tel Aviv
including several C40 cities located in major coal- Zhenjiang
poses challenges in terms of stranded assets, Tel Aviv 0 100 200 300 400 500
Zhenjiang Tel A
consuming countries. 0 100 200 300 400 500
0 50 100 150 200 250
workers and communities. This change must be 0 50 100 150 200 250 0 100 200 300 400 500
• C40 cities in China could see job creation 10% managed through working with industry groups, East Asia, Southeast Asia and Latin (+3%) & North America (+15%)
East Asia, Southeast Asia and Latin & North America Eastjobs
Asia,
in 1.5Southeast Asia and
and 20% higher under a 1.5°C scenario, with labour organisations and communities to ensure a Oceania
(+3%) +35% more jobs (+15%)
in 1.5oC scenario more o
C scenario
Oceania +35% more jobs in 1.5oC scenario more jobs in 1.5 C scenario
o
Oceania +35% more jobs in 1.5oC scenario
the total number of cumulative jobs ranging just transition to renewable electricity. Bangkok Bogota
Bangkok Bogota Bangkok Bogo
from between 53,000 (Zhenjiang) and 420,000 Hanoi
Ciudad de
Ciudad de Mexico Ciudad
(Shanghai). Hanoi Mexico Hanoi Mexi
HCMC Guadalajara
HCMC Guadalajara Guadalaj
HCMC
• Similarly, across C40’s Indian cities, there are Jakarta
Medellin
Medellin
Jakarta Jakarta Mede
expected to be between 18% and 27% more Kuala Austin
Kuala Austin
Lumpur Kuala Aus
jobs, with the cumulative total number of jobs Lumpur Boston
Lumpur
Melbourne
Boston
between 124,000 (Bengaluru) and 249,000 Melbourne Melbourne
Chicago
Bost
(Mumbai). Chicago
Quezon City Chica
Quezon City Houston
Quezon City
Houston
Seoul Houst
• In the U.S, C40 cities can expect to see Seoul
Miami
Miami
Seoul
Singapore Mia
between 10% and 27% more jobs under the Singapore New Orleans
Singapore
New Orleans New Orlea
energy transition. The highest number of Sydney New York
Sydney New York City
Sydney New Yo
cumulative jobs is created by transitioning City
Tokyo C
Philadelphia
Tokyo
New York City's electricity supply to Philadelphia Tokyo Philadelp
Yokohama Washington
renewables, at 93,000. Yokohama Washington Yokohama Washingt
0 100 200 300 400 500 0 20 40 60 80 100
0 100 200 300 400 500 0 20 40 60 80 100 0 100 200 300 400 500
Source: C40 modelling. For further information on the data, see the methodology
28 THE HEALTH AND ECONOMIC CASE FOR A CLEAN ENERGY REVOLUTIONLower energy costs, cleaner electricity
The cost of renewable energy technologies has based on the significant wider economic benefits Countries
Figure with the sources
11: The cheapest cheapest source of in
of electricity electricity: renewable
34 countries energy vs
(2019 vs 2030)
rapidly decreased over the past decade, and our from climate, health and employment gains that coal in 2019.
modelling suggests they are set to become even outweigh the small additional cost. Moreover, we
more competitive as economies of scale continue have taken a cautious approach to both carbon 2019
this trend and coal becomes more expensive pricing and investment in storage, assuming
(Figure 10). only a marginal increase in carbon price and no
additional investment in storage. If carbon pricing
Of the 34 countries modelled, new renewable and investment in storage increase this would
electricity is already cheaper than new coal significantly affect the cost of both renewables and
electricity in 27D and cheaper than operating coal coal, further strengthening the investment case.
capacity in 17. By the early 2030's renewables will
be cheaper than new and operating coal in all It is worth emphasising that a rapid phase out
countries (Figure 10). of coal has immediate air quality and health
benefits, and the upfront investment in clean
energy creates near-term jobs, both of which are
By the early 2030’s renewables will be
particularly important in the context of a green and
cheaper than coal in all countries
just recovery from the COVID-19 pandemic.
An energy transition to clean energy requires
considerable investment between now and By investing in a clean energy transition,
2050, especially in cities that rely heavily on coal- national governments and cities can Wind (9 countries)
Solar (18 countries)
generated electricity. However, the amount is realise significant climate, health and job Coal (7 countries)
similar to that required under current coal plans benefits.
– our analysis shows the investment for a 1.5°C
Source: C40 modelling supported by Vivid Economics and Bloomberg New Energy Foundation.
scenario between now and 2050 is only 4% greater.
This research makes the case for such investment
Countries with the cheapest source of electricity: renewable energy vs
coal in 2030.
Figure 10: Global trends in the levelised cost of electricity (USD per MWh), 2015–2050 2030
Evolution of the LCOE over time (USD per MWh), global average
160
Coal (new plants)
140
Coal (operating plants)
120
Wind
100 Wind + storage
80 Solar
Solar + storage
60
40
20
- Wind (4 countries)
2015 2020 2030 2040 2050 Solar (30 countries)
Coal (0 countries)
Source: C40 modelling supported by Vivid Economics and Bloomberg New Energy Foundation.
Source: C40 modelling. For further information on the data, see the methodology. Maps include comparison of LCOEs of
Source: C40 modelling. For further information on the data, see the methodology
renewables without storage against new coal LCOEs.
30 THE HEALTH AND ECONOMIC CASE FOR A CLEAN ENERGY REVOLUTIONChapter 3.
How cities can
accelerate the
transition from
coal to clean
energy
Credits: Justin Lim on Unsplash
32 THE HEALTH AND ECONOMIC CASE FOR A CLEAN ENERGY REVOLUTIONChapter 3.
of nearby Richmond has ordered the city’s port ◆ Los Angeles is represented on the governing
to end all coal exports by 2023, the majority of board of the regional South Coast Air Quality
How cities can accelerate
which come from coal mines in Utah and are Management District, through which the city is
shipped to Japan. able to influence decision making on regional
air quality policy that is designed to meet the
the transition from coal to
◆ Portland, Oregon, has introduced its Fossil US National Ambient Air Quality Standards.
Fuel Infrastructure Policy, under which the city
council actively opposes any new infrastructure ◆ Washington DC is a member of the Ozone
clean energy used primarily for transporting or storing of
fossil fuels.
Transport Commission, which addresses
regional ozone issues in the Northeast of the
US.
The central role of cities. By leading the fight against climate change and tackling
their own GHG emissions, cities deliver bold actions to decarbonise energy supply Regulate and price emissions and
and accelerate the global energy transition. The degree to which cities can directly pollution Take shareholder action
control how electricity is generated and used varies, and is determined by things
such as municipal financing and regulatory context.21 However, cities can influence In the absence of an outright ban on new coal By influencing company policies and practices,
the acceleration of the global energy transition in a number of different ways, using plants, a combination of policies can reduce shareholder action can help to steer economies
direct and indirect action – from procurement and investment decisions to setting emissions and pollution. in a greener direction. For city governments, this
targets, convening coalitions and championing a collective urban voice for change. can include divesting pension funds held at city
In this chapter we explore these actions, offering real-world examples from C40 ◆ New York City: A proposed amendment to level and shifting to sustainable investments, and
cities that are leading the charge. New York City’s building code aims to limit introducing criteria to ensure they only select asset
GHG emissions from new and renovated managers that have strong climate credentials
buildings to 50 kilograms of CO2 per million and engagement programmes (including voting
British thermal units (Btu) by incentivising
Rapidly phase out coal on climate-related shareholder resolutions).
cleaner energy supply that complies with the At the time of writing, 14 cities have committed to
To phase out coal in line with a 1.5°C scenario regulation standards. divesting their pension fund from fossil fuels.
Following Los Angeles’ decision, the remaining
cities must take bold action, using all the tools co-owners decided to retire the uneconomical
City governments can pioneer emissions trading ◆ London: Although the Mayor of London does
at their disposal to directly retire operating coal- coal plant in 2019 and purchase cheaper
systems in their entirety or trial different aspects not have control over the London Pension
fired power plants and to cancel new plants in the electricity that was generated by other energy
of wider emissions trading systems, such as higher Fund Authority (LPFA), they do provide
pipeline, or to make them more difficult, expensive sources. Los Angeles has also announced that
pricing levels. guidance to the LPFA and can influence the
or time-consuming to bring online. In most cases, it will close three gas-fired coastal power plants
cities will need to work closely with others to under the ownership of the Department of composition of its board. This role has enabled
◆ China: Before launching its country-wide
achieve the rate of decline required, but they can Water and Power, by the end of the 2030. the Mayor’s Office to table discussions on how
power-sector emissions trading system in July
also help to build the political case for transition to reduce climate change risks to investments
2021,18 China trialled versions of it in several
by highlighting the health, jobs and economic and to appoint new trustees with climate
provinces and major cities. Three C40 cities –
costs of coal and advocating for a just and inclusive knowledge. The LPFA now has a climate
Block and ban coal Beijing, Shanghai and Shenzhen – took part
transition. change policy, which sets out aims to engage
in these trials, helping lead the way for the
companies in the low-carbon transition and,
Where cities don’t own assets they can challenge national system.19
where engagement proves futile, to divest.
them through action to block or ban coal-fired
◆ Tokyo: has operated a Cap and Trade System At the time of writing, LPFA has sold out of
Close city-owned fossil fuel power plants and associated infrastructure.
several companies, including ExxonMobil, Coal
infrastructure for buildings since 2010, which mandates
India, BP and Shell.
◆ US city governments, in collaboration CO2 reductions from large commercial and
Where cities have ownership of coal infrastructure with a broad coalition of actors including industrial buildings in order to support the shift
◆ Berlin became the first “divestment capital” in
they can take measures to shut it down directly. Native American tribes, ranchers and away from coal-generated electricity.
the world, divesting assets, including pension
environmentalists, have successfully blocked
assets, from companies that produce, refine
◆ Los Angeles is closing coal, and other fossil- proposals for a number of new coal export Where urban air pollution levels exceed national
standards, cities can participate in regional and and sell fossil fuels. As part of this process
fuelled power plants, that it owns, or co-owns. terminals as a way to block the expansion of the
national air quality planning to address large sources Berlin created a fossil-fuel free, sustainable
In 2016, Los Angeles announced that it would US coal supply chain.
of emissions (such as coal-fired power plants) that equity index that enables all German federal
end its co-ownership in the Navajo Generating
states and municipalities to use and benefit
Station, the largest coal plant in the western ◆ Oakland: In California, the City of Oakland has lie outside the city’s boundary. In the US, cities often
engage in regional air quality policy processes to from the same investment vehicle.
United States and the third-largest individual voted to ban the storage and handling of coal
source of GHG emissions in the entire country. within the city’s jurisdiction and the city council address sources that affect the city’s air.
34 THE HEALTH AND ECONOMIC CASE FOR A CLEAN ENERGY REVOLUTIONYou can also read