CLIMATE TRANSPARENCY REPORT - 2022 G20 REPONSE TO THE ENERGY CRISIS: CRITICAL FOR 1.5 C
←
→
Page content transcription
If your browser does not render page correctly, please read the page content below
CLIMATE TRANSPARENCY REPORT
G20 REPONSE TO THE ENERGY CRISIS: CRITICAL FOR 1.5°C       2022

     +3°C           +2.5°C          +2°C          +1.5°C

                                                 A G20 STOCKTAKE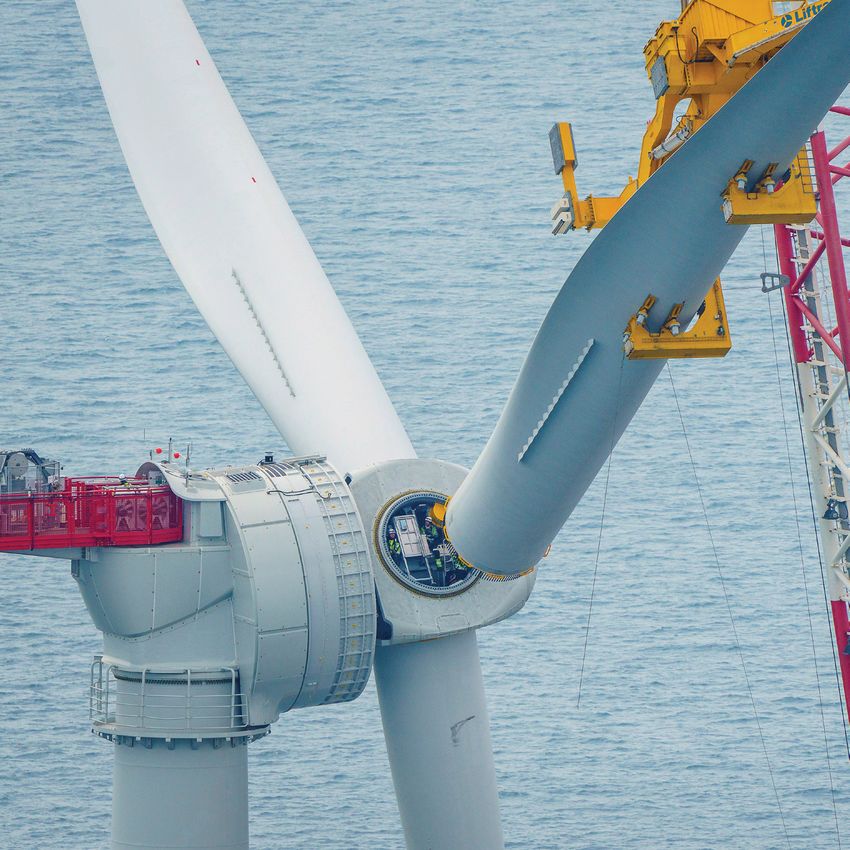
CONTENTS
Climate Transparency is a global partnership with a shared mission to stimulate a “race to the top”
in climate action in G20 members through enhanced transparency.

                                                                                                                    FOREWORD
                                                                                                                    Too little, but not too late for 1.5°C
                                                                                                                                                                         2
                     This Summary Report is part of the Climate Transparency Report 2022.
                     Find the G20 member profiles at www.climate-transparency.org

                     Published 20 October 2022
                                                                                                                    THE ENERGY CRISIS
                                                                                                                    A catalyst to tackle the climate crisis
                                                                                                                                                                         4

                                                                                                                    STOCKTAKE
                                                                                                                    Focus on implementation to keep 1.5°C within reach
                                                                                                                                                                         10
Data Partners       Partners

     Climate
     Action                                                                                                         ADAPTATION
     Tracker
                                                                                                                    Increase finance to cope with the inevitable
                                                                                                                                                                         22
                                            BERLIN
                                            GOVERNANCE
                                            PLATFORM

                                                                                                                    MITIGATION
                                                                                                                    Break rebounding emissions and stop deforestation
                                                                                                                                                                         30

                    Funders
                                                                      Supported by:

                                                                                                                    FINANCE
                                                                                                                    Reduce subsidies and increase climate finance
                                                                                                                                                                         44
                                                                      based on a decision of the German Bundestag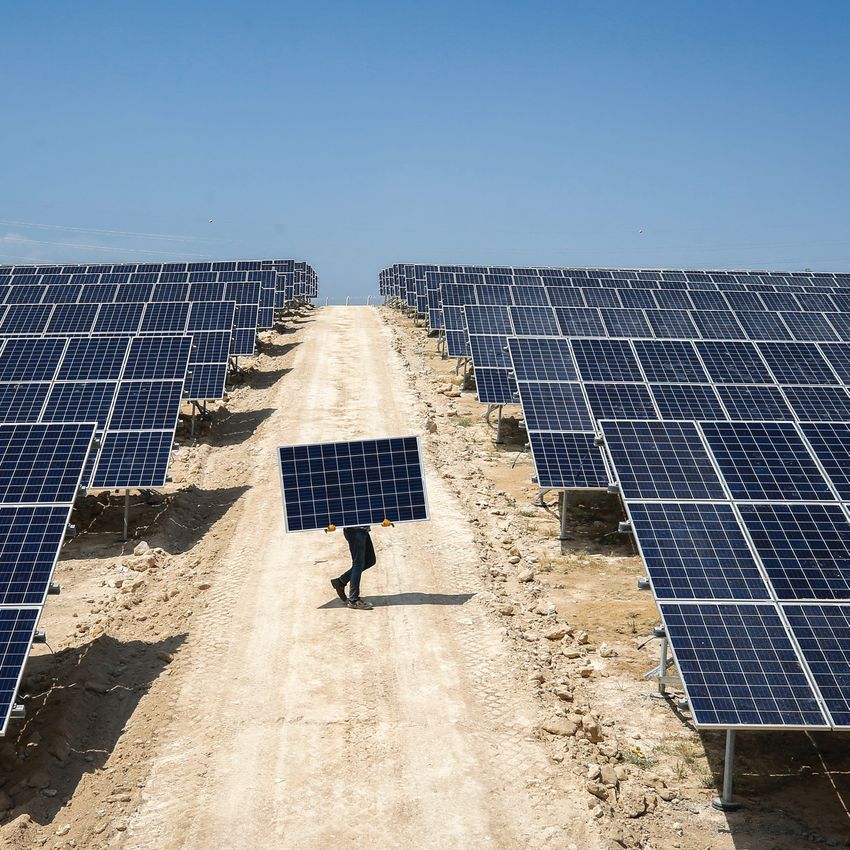
FOREWORD
Too little, but not too late for 1.5°C
                                                                                                               It is difficult to agree on what would be a just solution to the climate crisis, but not at all difficult to agree
                                                                                                               that the present situation is unjust. It is only a question of fairness that those who make the biggest
We are in the midst of a crisis that threatens the very foundations of our societies. Climate change           contribution to climate change – countries, companies, and individuals – must drastically reduce their
impacts are increasing across the world. Heatwaves, droughts, floods, and wildfires are causing                emissions, and must carry a bigger share of the costs associated with those reductions. And that
devastation: every day, people are dying, others are losing their homes and their livelihoods, and             means a big increase in climate finance. Yet the contributions to climate finance from the world’s richest
ecosystems are being destroyed.                                                                                countries are still dwarfed by the money they pour into subsidising the very product that is causing
                                                                                                               climate change: fossil fuels, a sum that appears to increase every year.
Energy prices have skyrocketed in many places of the world. Energy supply is not secure and, on top
of that, food prices are steeply increasing, with climate change impacts contributing to the crisis. Some      Reducing energy demand is central to reducing emissions. Yes, millions of people need cleaner and
governments are advocating for a pause in climate action, and others are using the energy crisis as an         more reliable energy for a better life. And they need the best available technology for that. But equally,
excuse for reducing mitigation efforts and delaying the shift from fossil fuels.                               there are millions who can – and should – change their lifestyle. Addressing unsustainable consumption
                                                                                                               trends requires increased and strengthened demand-side policies.
The COVID-19 pandemic could have been a point of transformation but, instead, we have returned
to business-as-usual in the way we generate and use energy. After a short dip in 2020, the G20’s               Present political tensions do not bode well for the upcoming climate negotiations, neither at the G20
emissions have rebounded in 2021 to nearly the level experienced in 2019: not enough renewable                 Summit in Indonesia nor at the UNFCCC’s COP27 in Egypt. We need global cooperation, despite the
energy added; no speeding up the coal phase-out; no reduction in deforestation; and no acceleration            economic and political differences.
of the exit from fossil-fuel-based transport.
                                                                                                               New crises, such as pandemics and wars, will come and go; but unless we act, the climate crisis will
There are enormous inequalities linked to greenhouse gas (GHG) emissions. The top 1% of individual             remain an ever-worsening constant. It will be with us for decades to come, and it will get more intense
emitters are responsible for 17% of the global emissions; the poorest half are responsible for only 12%.       every day unless we decarbonise our economies by the middle of this century.
This difference between the rich and the poor’s contribution to this global problem applies in most
countries. For example, the per capita emissions in sub-Saharan Africa are 1.6 tCO2 /yr; in North America      The 21st century – indeed the next decade – will be judged by whether we will
they are 21 tCO2 /yr.
                    1
                                                                                                               solve the climate crisis by acting decisively now.
Since the beginning of the Industrial Revolution, humanity has emitted 2,500 billion tonnes of CO2. If
we want to keep global temperature increase to 1.5˚C, less than 500 billion tonnes can be released
into the atmosphere. Under present trends, we will have used up the remaining carbon budget in less            Co-Chairs Climate Transparency:
than 10 years. Future generations will be left with little choice but to deal with the disastrous results of   Alvaro Umaña, Peter Eigen
our inaction.

2                                                                                                                                                                                                                                   3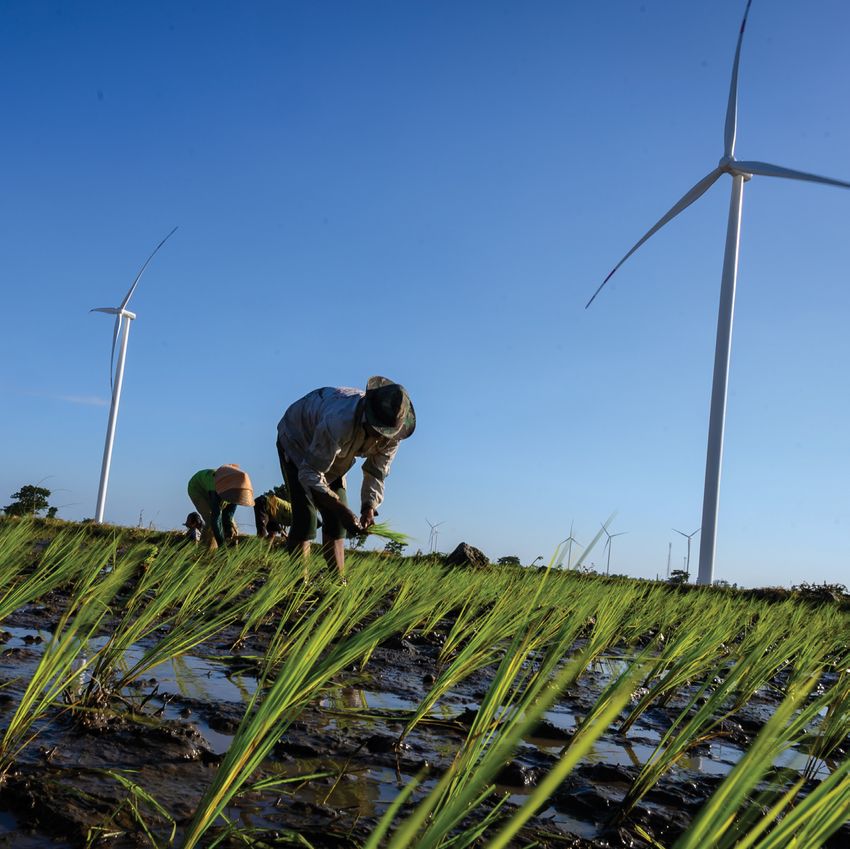
ENERGY CRISIS
A catalyst to tackle the climate crisis KEY ACTIONS
Increase the deployment of renewable energy and create sustainable jobs.
Ensure that “stop-gap” measures are reversible and do not undermine
climate action.
Stop domestic and international investments in fossil fuel infrastructure to
avoid carbon lock-in and stranded assets.
Use targeted support for poorer households instead of expanding
subsidies for all.
Incentivise and promote energy conservation and make energy efficiency
measures mandatory.
Maintain and extend carbon pricing mechanisms.
Expand climate finance for zero-carbon investments both domestically and
through international cooperation.
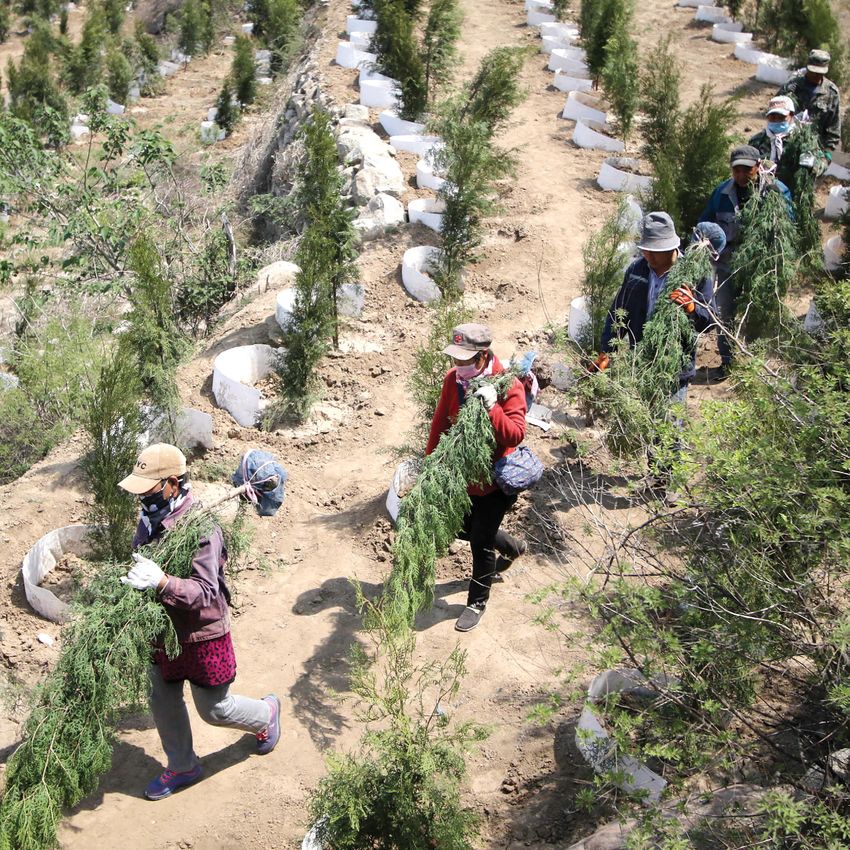
FRANCE, 2022: Construction of the first offshore wind farm launched in Saint-Nazaire, an important
site where 80 wind turbines will soon be built. © Philippe Petit/Paris Match via Getty Images
4 5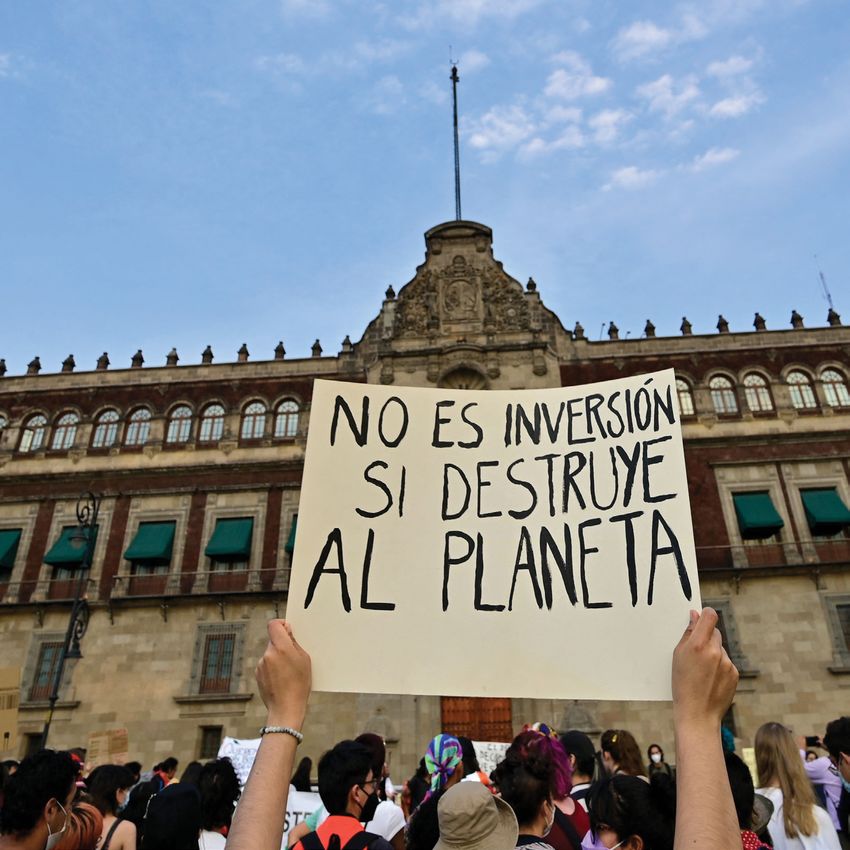
THE ENERGY CRISIS OVERSHADOWS                                                                                                               FOSSIL FUEL PRICES BEGAN RISING STEEPLY
                                                                                                                                            IN THE SECOND HALF OF 2021
THE CLIMATE CRISIS
                                                                                                                                                                  Development of fossil fuel prices between 2010 and 2022
                                                                                                                                            700%

This past year has seen massive impacts from climate change: heatwaves and wildfires in India,
Europe and the USA; floods in Pakistan, China and Australia; droughts in Europe, East Africa, and
                                                                                                                                            600%
North America; intense tropical storms in the central Pacific and North Atlantic.2,3 Meanwhile, global
emissions are growing again after a short-term drop in 2020 caused by the COVID-19 pandemic.4
                                                                                                                                            500%
At the same time, however, the repercussions of the war in Ukraine have given rise to a massive
energy crisis with global implications. Energy prices have soared in many countries. The availability
of oil and gas has been affected through sanctions by western countries on Russia. Meanwhile,

                                                                                                              % Change (compared to 2010)
                                                                                                                                            400%
Russia has reduced supply to the European Union (EU) and intensified new energy partnerships
with China, India, and other countries. Overall, these shifts have led to a high level of volatility in the
global energy market.5                                                                                                                      300%

Energy prices had already begun to increase in the second half of 2021, as the global economy
started to recover from its downturn at the height of the pandemic. The war in Ukraine escalated                                            200%
this trend. The price increases have varied for different fossil fuels and regions, but have been
felt worldwide.6
                                                                                                                                            100%
Due to extreme weather events coinciding with higher energy costs and the reduced availability
of wheat and fertilisers from Russia and Ukraine, food prices also increased significantly.
                                                                                                                                              0%
Prices started to stabilise recently, albeit at much higher levels than before. As a result, many
governments are now confronted with a cost-of-living crisis that shifts public attention away from
the climate crisis.
                                                                                                                                            -100%
                                                                                                                                                 2010      2011         2012   2013         2014      2015         2016        2017      2018          2019   2020         2021         2022

                                                                                                                                                        Crude oil, average       Coal, South Africa          Fossil gas, USA          Fossil gas, Europe       Liquefied fossil gas, Japan

                                                                                                                  World Bank, 2022a 7
6                                                                                                                                                                                                                                                                                            7
SUSTAINABLE SOLUTIONS ADDRESS CLIMATE AND ENERGY TOGETHER

There is no lack of challenges for governments: high prices and shortages in the supply of energy,    To keep the goals of the Paris Agreement within reach, the energy crisis must be used as a
food, and goods; the continuing COVID-19 crisis; and a looming global recession8 are endangering      stepping-stone for the G20 to rise to the challenge of the climate crisis, to continue and deepen
plans to decarbonise economies. Yet, now is the time for the G20 to define the paths for the future   climate action, and to reverse the currently rebounding trend of GHG emissions.
of their energy systems if the climate catastrophe is to be averted.9
                                                                                                      Targeted measures, expanding investments into renewable energy, and pricing mechanisms to
Many G20 governments have recently adopted short-term, “stop-gap” measures that are                   support the shift away from fossil fuels towards renewables will help to resolve the energy crisis at
designed to soften the effect of high energy prices and to ensure energy security for populations     hand and at the same time work against the climate crisis.
and domestic industries. These measures include fiscal and economic policies as well as direct
                                                                                                      Some governments are taking steps in this direction. China’s national Emissions Trading
payments to subsidise high fuel and electricity costs. These measures often delay or subvert
                                                                                                      System came online last year, covering about 2,100 power stations in the country.14 The EU, UK,
effective climate policies.
                                                                                                      Germany, South Africa, and the USA have strengthened their policies to ramp up deployment of
Some solutions to address the energy crisis have highly negative long-term consequences for           renewable energy.
the climate and are hard to reverse once they are in place. Fossil fuel infrastructure decisions
                                                                                                      More members of the G20 need to join them in a decisive push towards renewable energy as
especially have high investment costs and long lifespans that work against the energy transition to
                                                                                                      cheaper and more flexible alternatives to fossil energy that will enhance their domestic energy
a fossil-free future.
                                                                                                      security and lower emission levels.
We are already seeing increased investments in the exploration and expansion of fossil fuel
                                                                                                      To do this effectively, bilateral and multilateral collaboration among the G20 and between
infrastructure. Fossil gas has recently seen a massive boost, including in Canada, the EU and its
                                                                                                      developed and developing countries is indispensable. As part of this, the wealthier countries need
member states, among others.10 Fracking in the UK,11 and tar sands exploration in Canada12 are
                                                                                                      to demonstrate their commitment to shared responsibility by strongly increasing climate finance.
being discussed as ways to address fuel shortages. Coal use is not only up in Germany and Italy,
but also in Brazil, and possibly China.13                                                             The energy crisis will pass, but the climate crisis will be much harder to overcome if the two are not
                                                                                                      addressed together. The path the G20 take will determine the success of the Paris Agreement.

8                                                                                                                                                                                                              9
Paris Agreement: Hold the increase in the global average temperature to
STOCKTAKE
well below 2°C above pre-industrial levels and pursue efforts to limit to 1.5°C,
recognising that this would significantly reduce the risks and impacts of
climate change.
Focus on implementation to keep 1.5°C within reach
KEY ACTIONS
2030 targets: All G20 members need to further enhance their NDCs
to be 1.5°C compatible (including sectoral targets) and quickly ramp up
implementation. The current energy crisis must not be used as a reason
to delay action, but rather as a driver towards faster, more ambitious
implementation.
Defining mid-century net zero targets: Mexico needs to commit to net zero
targets. Argentina, Australia, Brazil, China, India, Indonesia, Saudi Arabia,
South Africa, Turkey and the USA need to enshrine their net zero targets
into law.
Implementation is the key: All G20 members need to ramp up
implementation to keep 1.5°C within reach.
TURKEY, 2018: A worker carries a solar panel at the construction site of a 20 MW solar power plant project
of Akfen Renewable Energy in Edremit district of Van. © Ozkan Bilgin/Anadolu Agency/Getty Images
10 11ENERGY-RELATED CO2 EMISSIONS REBOUNDED IN 2021;
REBOUNDING EMISSIONS INSUFFICIENT DECOUPLING OF EMISSIONS FROM
The pandemic has not turned the trend
GDP GROWTH
120%
100%
The average global temperature in 2021 was about 1.1°C above pre-industrial levels, and it was the
seventh consecutive year in which global temperature had been over 1°C above these levels.15 80%
% Change (compared to 1997)
According to the IPCC, to limit global warming to 1.5°C, the remaining carbon budget is less than 60%
500 Gt CO2.16 This means that we have eight years left to keep warming to 1.5°C.17 40%
Globally, total net anthropogenic GHG emissions have continued to rise during the period 20%
2010–2019. The growth rate from 2010–2019, however, was lower than that from 2000–2009
0%
(over 2%/yr).18
-20%
Emissions trends among the G20 members, accounting for 75% of global emissions, are following
this pattern. While the energy intensity of G20 economies is falling, carbon intensity has not -40%
1997 2000 2005 2010 2015 2021
changed significantly over time because the energy sector is not sufficiently decarbonised. GHG
emissions increased by 268% between 1990 and 2019. Decoupling emissions from growth has not
happened to the extent needed. Total primary energy supply
GDP Energy-related CO2 emissions (TPES)
Unfortunately, COVID-19 did not break the rising trend in emissions. In the first year of the 2021 2020 2010–2019* 2021 2020 2010–2019* 2021 2020 2010–2019*
pandemic (2020), energy-related CO2 emissions decreased by 4.9% – a direct result of reduced +6.1% -3% +3.5% +5.9% -4.9% +1.1% +5% -4% +1.5%
economic activities. GDP fell by 3% in the same year. However, 2021 shows a strong rebound
effect. GDP increased by 6.1%, energy-related CO2 emissions by 5.9%, and total primary energy
Carbon intensity of the Energy intensity of the
supply (TPES) by 5%. Population energy sector economy
2021 2020 2010–2019* 2021 2020 2010–2019* 2021 2020 2010–2019*
+0.4% +0.6% +0.8% -0.9% +0.9% -0.3% -1.1% -1.1% -1.6%
*Average percentage change 2010–2019
Enerdata, 2021 19
12 13BEFORE THE PANDEMIC TOTAL ANNUAL GHG G20 PER CAPITA EMISSIONS DECREASED ON AVERAGE BY
EMISSIONS PLATEAUED IN THE G20 1% FROM 2015–2019, BUT INCREASED IN 5 COUNTRIES
G20 total GHG emissions across sectors G20 per capita GHG emissions (incl. LULUCF)
40,000 25 10%
8% 9%
35,000
5%
4%
-1% 2%
30,000 20 0%
-2% -2% 1%
-3%
-5% -5% -5% -5%
-6%
Growth in 2019 compared to 2015 (% change)
-6%
MtCO2e/year (1990–2019)
25,000
-7%
GHG emissions per capita (tCO2e/capita) (2019)
-8%
-9%
20,000 15 -10%
-12% -12%
-13%
15,000
10,000 10 -20%
5,000
0 5 -30%
-34%
-5,000
1990 1995 2000 2005 2010 2015 2019
0 -40%
Energy Industrial processes Agriculture Waste Other LULUCF IND MEX TUR IDN FRA ITA UK BRA G20 ARG CHN EU27 ZAF JPN GER RUS KOR USA CAN AUS SAU
Non
OECD
OECD
Gütschow, J. et al., 2021;20 Climate Action Tracker, 2022b 21 Enerdata, 2022 22
14 15METHANE EMISSIONS METHANE EMISSIONS STILL RISING; SIX G20 MEMBERS
Actions need to follow pledges DID NOT SIGN THE GLOBAL METHANE PLEDGE
Methane is the second most important GHG emission after CO2. Its global warming potential is at least 29.3%
27 times higher than CO2 on a 100-year timescale. Since 1750, about 30% of global warming can be 14.2% 10.5% 9% 8.2% 6.8%
attributed to methane.23 Sources of methane emissions include oil and fossil gas operations, fracking,
agricultural activities, coal mining, combustion, wastewater treatment, and certain industrial processes. China USA India Brazil EU27 Russia
+1% +1.3% +1.7% +1.6% -4.7% +2.5%
Methane emissions accounted for 16% of all GHG emissions in 2019. While they rose slower than CO2
emissions but still increased by 11% between 1990 and 2019. In 2019, the major share of methane
emissions came from agriculture (46%), followed by 32% from energy and 20% from waste.
Methane emissions are, therefore, highly relevant for keeping the long term temperature goal of the
5% 3.3% 2.5% 2.1% 2.1% 2.1% 1.2%
Paris Agreement within reach. According to the United Nations Environment Programme (UNEP), Indonesia Mexico Saudi Arabia Canada Argentina Australia France
reducing human-caused methane emissions is one of the most cost-effective strategies to rapidly +8.4% +7.9% +7.9% -4.4% +2.8% -4% -3.5%
reduce the rate of warming and contribute significantly to global efforts to limit warming to 1.5°C.24
Measures include reducing food waste and loss, improving livestock management, adopting healthy
diets (vegetarian or with a lower meat and dairy content), gas leak detection and repair, recovery and
1.3% 1.3% 1.1% 1.1% 0.9% 0.7% 0.6%
utilisation of vented gas, and the treatment and disposal of solid waste.25
During COP26 in Glasgow, the Global Methane Pledge was launched. Signatories have agreed to take South Africa Turkey Germany United Kingdom Italy South Korea Japan
actions to reduce global methane emissions by at least 30% from 2020 levels by 2030. With methane -0.8% +16.8% -10.6% -3.7% -2.5% +4.3% -2.7%
emissions in the G20 having increased by 1.4% between 2015 and 2019, signatories must not only
scale-up activities to keep this goal within reach, but also those high emitters – such as Australia, China,
India, and Russia – need to join.
Share of methane emissions within G20 Share of methane emissions within G20
Change between 2015 and 2019
Signed the Global Methane Pledge Did not sign the Global Methane Pledge
Climate and Clean Air Coalition, 2021; 26 Gütschow et al., 2021 27
16 17NEITHER NDC 2030 TARGETS NOR POLICY PROJECTIONS
2030 TARGETS AND IMPLEMENTATION ARE 1.5°C ALIGNED
G20 members are not on track
NDC target (excl. LULUCF) Current policy projection 1.5°C modelled domestic pathway Ambition gap
200%
G20 members account for around 85% of global GDP, 75% of international trade and two-thirds of the world’s
population, and are responsible for around three-quarters of global emissions.28 The USA is estimated to be
150%
responsible for 25% of global emissions, followed by the EU (22%), China (12.7%), Russia (6%), Japan (4%), and
India (3%).29
To limit warming to 1.5°C, the G20, therefore, carries high responsibility. For developed countries, this includes
GHG emissions (in 2030 compared to 2010)(%)
providing climate finance to assist developing countries’ mitigation and adaptation actions. 100%
However, G20 members are still not taking the necessary level of accountability of action. Although most
countries have submitted stronger NDC targets over time (except for Brazil, India, Indonesia, Mexico, and Russia),
their overall level of ambition and action is still insufficient to meet 1.5°C, according to the Climate Action Tracker.
50%
The UK is the only country with an overall rating of “almost sufficient”. Nonetheless, it is promising that some of
the highest emitters (China, the EU, and the USA) submitted the greatest increase in their updated NDCs.
The combined mitigation effect of all 2030 targets assessed is projected to lead to warming of 2.4°C, with current
policies leading to a 2.7°C world by 2100. 30 This underlines the urgent need for G20 members to strengthen 0%
current climate policies, intensify implementation, and submit more ambitious 2030 targets that align with mid-
century net zero targets.
-50%
Overall rating of G20 member efforts by the Climate Action Tracker -100%
ARG AUS BRA CAN CHN EU27 FRA GER IND IDN ITA JPN MEX RUS SAU ZAF KOR TUR UK USA
RUS TUR ARG BRA CAN CHN IND IDN MEX SAU KOR AUS EU27 GER JPN ZAF USA UK Updates
from first
Critically Almost NDCs
Updated with more ambitious 2030 target No 2030 target increase No updated NDC
insufficient Highly insufficient Insufficient sufficient
For more information, please see www.climateactiontracker.org Climate Action Tracker, 2022a, 31 2022b;32 Climate Analytics, 2021 33
18 19MORE COUNTRIES ANNOUNCE NET ZERO TARGETS
NET ZERO COMMITMENTS
Implementation needs to follow All emissions
Only reductions
Legally binding Comprehensive
Target year / removals Enshrined in law
covered review process planning
domestically
Argentina Net zero target announced (2050)
Not yet / in policy Non-binding / in
Australia 2050 Yes No No
document process
A positive development in the last two years has been that governments are increasingly adopting Brazil Net zero target announced (2050)
net zero targets. By September 2022, within the G20, only Mexico had not announced a net zero Canada 2050 Yes Yes Yes Yes Limited details
target. Not yet / in policy Non-binding / in
China Before 2060 No No Limited details
document process
Overall, the G20 net zero targets vary in terms of timeframe, coverage of GHGs and economic France 2050 Yes Yes Yes Yes Yes
sectors, use of carbon offsets and reductions outside a country’s border, and legal status, all of EU 2050 Yes Yes Yes Yes Yes
which have important implications for the strength of those targets. Germany 2045 Yes No Yes Yes Limited details
India Net zero target announced (2070)
Increasingly, countries are enshrining net zero targets in law. Canada, the EU (including France and Indonesia Net zero target announced (2060)
Germany), Japan, Russia, South Korea, the UK, and the USA – together accounting for 37.5% of
Not yet / in policy
Italy 2050 Yes Yes Yes No
global GHGs in 2019 – have done so. document
Non-binding / in
However, most of the G20 net zero targets that go beyond just announcements at least partially Japan 2050 Yes No Yes
process*
Limited details
rely on reductions or removals outside the country’s borders, creating a high risk of double Mexico No target announced
counting. Additionally, most targets rely on measures – such as carbon capture and storage (CCS) Non-binding / in
Russia 2060 Yes No Yes Limited details
– that are still under development and not commercially viable. process
Saudi Arabia Net zero target announced (2060)
Importantly, without both setting and implementing short-term targets that at least halve global
South Africa Net zero target announced (2050)
emissions by 2030, the net zero targets will be out of reach. For their mid-century targets to
Non-binding / in
have any credibility, the G20 members must ramp up both the ambition and implementation of South Korea 2050 Yes** Yes Yes Limited details
process
their 2030 targets towards 1.5°C compatibility. To realise these net zero plans requires significant Turkey Net zero target announced (2053)
investment and a lot more progress on implementation. UK 2050 Yes No Yes Yes Yes
Not yet / in policy Non-binding / in
USA 2050 Yes No Limited details
document process
Climate Action Tracker, 2022b; 34 France: IDDRI, 2022; 35 Italy: ECCO (www.eccoclimate.org)
**Adapted from Climate Action Tracker, 2022c36, with input from IGES
**SFOC assessment based on the Framework Act on Carbon Neutrality and Green Growth; according to CAT, not all emissions are covered as they are not specified
20 21ADAPTATION
Paris Agreement: Increase the ability to adapt to the adverse
effects of climate change and foster climate resilience and
low-GHG development.
Increase finance and actions to cope with the inevitable
KEY ACTIONS
Adaptation strategies: Establish adaptation strategies across key
systems – including food, water, health, and infrastructure.
Monitoring & Evaluation (M&E): Strengthen M&E mechanisms to
guarantee adaptation implementation.
Adaptation finance: Increase finance for adaptation to avoid
damages and loss of life, and put additional focus on, and funding
for loss and damage, to build back better if disaster strikes.
CHINA, 2020: Afforestation workers plant trees
on the mountain, Handan City, Hebei Province.
© Costfoto/Future Publishing via Getty Images
22 23EXTREME WEATHER EVENTS THE CLIMATE EMERGENCY HAS ECONOMIC AND
The new normal in the G20 HEALTH IMPACTS ON ALL PEOPLE
Highest losses of earnings Highest percent change
from heat-related labour in heat-related deaths in
While there has been some progress in the G20 governments’ stated ambition to achieve net zero
capacity reduction in the G20 people over 65
emissions by mid-century, the effects of climate change are already hitting hard.
in 2021 (% share of GDP) in 2017–2021 compared to 2000–2004
In 2022, Australia matched the hottest temperature it had ever recorded (50.7°C). Extremely high
temperatures recorded in the UK (40.3°C) led to wildfires breaking out in London and across
the country.37 A heatwave in India also saw record heat, which greatly affected workers, labour
migrants, low-income households and the homeless, and reduced the yields of wheat crops, which
227%
would have been useful to address supply shortages caused by the war in Ukraine.38 Exposure to
higher temperatures and the resulting reduction of working hours has led to substantial income
losses in services, manufacturing, agriculture, and construction. For India, this income loss has
been estimated at 5.4% of GDP, for Indonesia at 1.6% of GDP.39 5.4% 191%
Indonesia
The IPCC notes that there will be unavoidable and severe damages to nature and people even if
Brazil
global warming can be limited to 1.5°C.40 Water security and food production have been negatively
affected;41 serious health outcomes and economic damages have been the result.42 The extreme
India
climatic and weather-related events have brought about high economic and human costs.
1.6% 141%
There is no doubt that we will see more, and more severe, weather events in the near future. A
multi-agency report produced by the World Meteorological Organization found that there is a one- 1% 141%
in-two chance that the world will break the 1.5°C barrier at least once within the next five years, and Saudi Arabia
Indonesia
that regional tipping points with cascading effects on the climate may already have occurred.43 The Saudi Arabia Turkey
need to adapt to climate change is more urgent than ever. 0.9%
0.7% 123%
China
Brazil Mexico
Romanello, M. et al., 2022 44
24 25EXTREME HEAT AND FOOD SCARCITY WILL
CLIMATE IMPACTS
AFFECT MANY MEMBERS OF THE G20
Strong increases with higher average temperatures
Exposure to future impacts at 1.5°C warming and higher
Using the projected impacts at 1.5°C of warming compared to the reference period of 1986–2006, the table compares
probable impacts at higher levels of warming. Country population figures in 2021 provided for reference.
The adverse effects of climate change grow with temperature increases, in some cases Australia Brazil
dramatically so. Even fractions of a degree can have serious economic, social, and environmental (ca. 26 million) 1.5°C 2°C 2.5°C 3°C (ca. 212 million) 1.5°C 2°C 2.5°C 3°C
costs. At 1.5°C, most G20 members can expect water scarcity and prolonged periods of drought; People affected by People affected by
1m 1.7m 2.4m 2.9m 20m 30m 36m 44m
more frequent and extreme heatwaves; and less favourable agricultural conditions. This gives heatwaves (ca.) heatwaves (ca.)
cause for concern because, even if governments were to implement their current NDCs, the Change of soil Change of soil
-2.75% x1.1 x1.3 x1.7 -1.63% x1.4 x1.4 x1.6
average temperature rise is already projected to be 2.4°C.45 moisture content moisture content
Change in maize Change in maize
The number of people exposed each year to climate-induced hazards is expected to rise as the -2.69% x1.4 x1.8 x2.9 -1.2% x2.7 x2.3 x7.0
yield (%) yield (%)
temperature increases. In India alone, 142 million people, roughly 10% of the population, may be
exposed to summer heatwaves at 1.5°C. Wildfires also pose a growing threat: in Indonesia an India Indonesia
additional 70,000 people more than those exposed annually during the reference period of 1986– (ca. 1,392 million) 1.5°C 2°C 2.5°C 3°C (ca. 272 million) 1.5°C 2°C 2.5°C 3°C
2006, are projected to be exposed to wildfires each year at 1.5°C of warming. At 3°C of warming, People affected by
142m 227m 337m 398m
People affected by
20m 34m 58m 94m
heatwaves (ca.) heatwaves (ca.)
that increase in people exposed to wildfires is projected to be multiplied almost 3 times, with a
corresponding rise in dangers to individual health and the overall economy. Change of soil Change of soil
0.69% x1.1 x2.5 x2.6 -0.27 x0.8 x0.5 x0.4
moisture content moisture content
With increasingly unpredictable wet cycles, and incidences of extreme weather events, farmers are Change in maize Change in maize
-2.84% x2.4 x1.5 x2.5 -6.23 x1.3 x1.5 x2.4
likely to experience increasing crop failures. Good harvests depend on precipitation, favourable yield (%) yield (%)
temperatures, and the right soil moisture which, in many countries, will be severely diminished
as the temperature rises. Using maize as an example, crop yields will diminish with increasing Turkey USA
(ca. 85 million) 1.5°C 2°C 2.5°C 3°C (ca. 332 million) 1.5°C 2°C 2.5°C 3°C
temperature, which will very likely exacerbate the already existing global hunger crisis.
People affected by People affected by
0.25m 0.5m 0.9m 1.2m 9.5m 17.1m 22.8m 29.5m
Increased river flooding is also connected to change. Floods can have devastating effects. At heatwaves (ca.) heatwaves (ca.)
least 1,100 people lost their lives, for example, when the Indus River in Pakistan flooded tens Change of soil Change of soil
-2.77% x1.9 x2.4 x2.5 -0.71% x1.8 x2.8 x3.3
of thousands of square kilometres in August 2022.46 G20 members will likely have to deal with moisture content moisture content
a higher number of, and more severe, river floods as the temperature increases. The floods in Change in maize Change in maize
-0.3% x9.9 x13.2 x7.1 -4.43% x1.3 x2.8 x3.8
western Europe in July 2021 bear witness to this.47 yield (%) yield (%)
26 Climate Analytics, 2021; 48 Statista, 2022 49 27MOST NATIONAL ADAPTATION STRATEGIES
ADAPTATION MEASURES INCLUDE REGULAR REVIEWS
Finance must be ramped up
Fields of action (sectors)
Monitoring and
Infrastructure
Coastal areas
and research
Finance and
Biodiversity
Energy and
and fishing
Agriculture
evaluation
Education
insurance
Urbanism
Transport
Forestry
industry
Tourism
Health
Water
Year
Enhancing adaptive capacity, strengthening resilience, and reducing vulnerability to climate change
in a country are indispensable to minimise damages from an already changing climate, protect
ARG 2020
people’s lives, and prevent economic losses.
AUS 2022
G20 members are increasingly embedding adaptation planning and policies in their overall climate
BRA 2016
politics. Only Saudi Arabia has not yet developed a national adaptation strategy. Brazil, France,
CAN 2020
Japan, and the UK assess the progress of their adaptation measures in regular cycles.
CHN 2022
However, in many other countries, such as India, Mexico, and Turkey, the implementation of
EU 2021 Actions by member states
measures to adapt to climate change, as well as monitoring and evaluation systems, are not
FRA 2018
yet sufficiently robust.50 This is frequently attributed to a lack of financial, human, and technical
resources, particularly in vulnerable, developing countries where adaptation is most needed and GER 2008
damage costs continue to rise. IND 2008
IDN 2019
The annual needs for adaptation finance for developing countries are estimated at USD 140–
300bn by 2030.51 The sectors identified as adaptation priorities in the NDCs include agriculture, ITA 2017
water and health, representing three-quarters of the quantified adaptation needs.52 JPN 2018
Estimated global private and public climate flows of USD 632bn/yr for 2019–2020 only include MEX 2021
7% (USD 46bn) in adaptation finance. Most of that originates from public actors, and about 80% of RUS 2020 No information on status
adaptation finance is channeled through multilateral public organisations, such as development SAU No dedicated Adaptation Strategy
banks and multilateral funds.53 ZAF 2020
While the level of adaptation funding has increased in recent years, it is still clearly insufficient. KOR 2020
At the current rate of a changing climate, adaptation finance will need to be raised by a factor of TUR 2012
5–1054 to meet the needs. This considerable amount, however, is dwarfed by the projected need UK 2018
by 2050 if the climate crisis keeps escalating: USD 280–500bn/yr.55
USA 2021
28 Own Evaluation 29MITIGATION
Paris Agreement: Hold the increase in the global average temperature to well below
2°C above pre-industrial levels and pursue efforts to limit to 1.5°C, recognising that
this would significantly reduce the risks and impacts of climate change.
Break rebounding emissions and stop deforestation
KEY ACTIONS
Power: Further stimulate and scale-up growth in renewables whilst rapidly phasing
out fossil fuels, accelerating energy efficiency, improving grid digitalisation and
energy savings.
Transport: Introduce policies and measures aimed at switching fuels to zero-carbon
fuels, mass electrification and modal shifting. Sales of internal combustion engine
vehicles must be banned globally by 2035 at the latest.56
Industry: Increase energy and material efficiency (switching to zero-carbon
sources such as renewables-based electrification and green hydrogen) as well as
material recycling.
Buildings: Focus on the retrofitting and electrification of existing buildings to reduce
energy demand. Require all new buildings to meet high energy-efficiency standards
and be equipped with heating and cooling technologies that either are, or can be,
zero emission.
Land use: Strengthen policies to reduce deforestation and implement protected area
networks, deforestation-free supply chains, and forest-friendly infrastructure.
Agriculture: Improve productivity to feed a growing population and also preserve
biodiversity, shift high-meat diets towards plant-based diets, and slow the demand for
INDONESIA, 2019: Residents farming next to wind turbines in South Sulawesi. Indonesia already has two wind power plants with the
largest total capacity in Southeast Asia. © Hariandi Hafid/SOPA Images/LightRocket via Getty Images agricultural land by reducing food loss and waste.
30 31ALMOST ALL G20 MEMBERS INCREASED THEIR SHARE OF
REDUCE ENERGY EMISSIONS
RENEWABLES – THIS TREND MUST URGENTLY ACCELERATE
through renewables and energy conservation
Direct energy-related CO2 emissions by sector (2021)
Energy-related emissions accounted for 76% of all GHG emissions in the G20 in 2019 (primarily CO2, including
9% 40% 19% 8% 22% 2%
land use change and forestry). In 2021, 40% of the energy-related CO2 emissions came from the power sector, Energy sector, own use* Power Transport Buildings Industry Agriculture
followed by industry (23%) and transport (19%). In the first year of the COVID-19 pandemic (2020), energy-related
Enerdata, 2022 62 *Includes energy-related CO2 emissions from extracting and processing fossil fuels.
CO2 emissions decreased by 5% – a direct result of reduced economic activities. GDP fell by 3% in the same year,
and total primary energy supply (TPES) by 4%. However, 2021 showed a strong rebound: GDP increased by 6%;
energy-related CO2 emissions by 5%, and TPES rose by 5%. Energy mix in G20 members
100% 10%
To break this connection between GDP growth and emissions, increased energy efficiency, energy conservation
(including lifestyle and consumption changes57 ), fuel switching, and electrification with renewables can bring
the necessary reductions. The decarbonisation of the energy sector through renewables is critical in reducing
emissions from the power, transport, industry, and buildings sectors. Indonesia, UK, and Turkey increased their 80% 8%
% Change renewable sources (2017–2021)
share of renewables in the energy mix between 2017 and 2021 by more than 3 percentage points. In the G20, the 7.8%
share of renewables increased to 10.5%, up from 9.1% in 2017.
% Source in TPES (2021)
60% 6%
Costs and energy security arguments favour renewable sources. From 2010–2021, the competitiveness of
renewables has constantly improved. The cost of electricity of newly commissioned utility-scale solar PV
declined by 88%, whilst that of onshore wind fell by 68%, concentrated solar power by 68% and offshore wind 4.7%
40% 4%
by 60%.58 Almost two-thirds of newly added renewables in the G20 had lower costs than even the cheapest 3.9%
coal-fired plant.59
3%
2.7% 2.6%
As a reaction to the current energy crisis, governments are taking steps to further enhance the development 20% 2.3% 2%
2.1% 2%
of renewables sources. In May 2022 in the EU, for example, Belgium, Denmark, Germany, and the Netherlands 1.7% 1.6% 1.7%
1.5% 1.5% 1.4%
pledged to increase wind capacity in the North Sea by at least 150 GW.60 In the USA, USD 425m61 will be spent 1.3% 1.3%
0.8% 0.8% 0.7% 0.7% 0.3% 0.1%
to expand state clean energy programmes, and the government has added further programmes to extend the 0% 0%
capacity of renewable energy. While the development of renewables is likely to accelerate, it is not clear whether IDN UK TUR GER EU27 BRA MEX JPN ITA FRA AUS KOR G20 IND CHN USA ARG CAN ZAF RUS SAU
Non
OECD
OECD
it will be fast enough.
Coal Oil Fossil gas Nuclear Renewables Other
Enerdata, 2022 63
32 33INCREASED SHARE OF RENEWABLES DRIVEN BY WIND
POWER Between 2030 and 2040, the entire
world needs to phase out coal-fired AND SOLAR; HOWEVER, REBOUND IN 2021 MAINLY
Prioritise renewables and phase out fossil fuels power generation. By 2040, the share of
renewable energy in electricity generation
needs to be increased to at least 75%, and the
CARRIED BY FOSSIL FUELS
Emissions from the power sector come from energy used to share of unabated coal reduced to zero.64,65
generate electricity and heat. It accounts for 40% of the energy-
related CO2 emissions. These emissions are mainly from the use Electricity generation mix
of coal, which accounts for almost 40% of the G20’s electricity G20 ENERGY-RELATED
25,000
generation mix, with fossil gas at 19%. CO2 EMISSIONS IN 2021
While the average G20 emissions intensity decreased by 8%
between 2017 and 2021, overall energy-related CO2 emissions
40% Direct
are still growing in line with more demand for electricity. After a Reduction Rebound 2015–2019: 20,000 80%
decrease in 2020 of 2.8% when economic activity slowed down, in 2020: in 2021:
+3.2%
emissions rebounded by 7.1% in 2021. -2.8% +7.1% (+0.8% p.a.)
Gross electricity generation (TWh)
Even though the share of renewables in the power mix did not
% Share of fossil fuels and renewables
15,000 60%
change between 2020 and 2021 (only by 0.1%) after an increase between 2019 and 2020 (1.8%), it has seen
strong growth over the last decade. Renewable energy accounted for almost 29% of gross power generation
in 2021, compared to 22% in 2014 and 19% in 2010. This growth in the share of renewables has primarily been
driven by wind and solar installations. The decarbonisation of other sectors – such as transport, industry, and
10,000 40%
buildings – is highly contingent on a decarbonised power sector. To fully decarbonise the power sector by
2050, G20 members need to phase out coal and avoid relying on fossil gas.66 Instead, they need to prioritise the
development of renewable sources.
5,000 20%
Policy assessment
ARG AUS BRA CAN CHN EU FRA GER IND IDN ITA JPN MEX RUS SAU ZAF KOR TUR UK USA
Renewable energy
in the power sector 0 0%
1990 1992 1994 1996 1998 2000 2002 2004 2006 2008 2010 2012 2014 2016 2018 2021
Coal phase-out in
the power sector Fossil fuels
Coal Oil Fossil gas Nuclear Biomass Wind
Hydro and waste Geothermal Solar Renewables
Low Medium High Frontrunner Enerdata, 2022 67
34 35TRANSPORT EMISSIONS CONTINUE TO GROW
TRANSPORT The share of low-carbon fuels in
the transport fuel mix globally must
Electrify and switch to public transport increase to between 40% and 60% by 2040,
and between 70% to 95% by 2050.68 G20 transport emissions (per capita)
5
The transport sector is responsible for a fifth of the G20’s
energy-related CO2 emissions. This is driven by the consumption G20 ENERGY-RELATED
CO2 EMISSIONS IN 2021
of oil – with road travel accounting for two-thirds of these
emissions. In this sector, there is a large difference between 4 30%
OECD and non-OECD countries of the G20 members, resulting 19% Direct 1% Indirect
from different levels of motorisation and use of transport modes. 25%
Reduction Rebound 2015–2019: 23% 22%
+4.9%
Pre COVID-19 trend (2015–2019)
in 2020: in 2021:
In 2020, the first year of the COVID-19 pandemic, CO2 emissions
3 15%
-11.5% +7.7% 16%
tCO2 /capita (in 2021)
per capita from the transport sector decreased by 11.8%, but by (+1.2% p.a.)
2021, per capita emissions had already rebounded by 7.2% – 12%
10%
although many companies still allowed their employees to work 7% 6%
2% 6% 2%
from home. Total energy-related CO2 emissions in the transport sector in the G20 rebounded by 7.7%, after a 3% 4% 3% 4%
2 0%
reduction in 2020 of 11.5%. In China and Turkey, per capita emissions rebounded to even higher levels than in 2019. 1% -3%
-5% -1% -5%
-7%
To decarbonise the transport sector, G20 members will need to engage in switching to low-carbon fuels (e.g.,
through mass electrification including decarbonising heavy-duty vehicles and phasing out fossil fuel cars, while -13% -13%
increasing alternative low-carbon fuels, such as biofuels and green hydrogen) as well as modal shifting (e.g., from 1 -15%
private to public transport and active transport; moving freight to rail instead of road, non-motorised transport).
Policy assessment 0 -30%
IND IDN CHN ARG BRA ZAF MEX TUR G20 JPN UK RUS ITA FRA GER EU27 KOR SAU AUS CAN USA
Non
OECD
OECD
ARG AUS BRA CAN CHN EU FRA GER IND IDN ITA JPN MEX RUS SAU ZAF KOR TUR UK USA
Phase out % Change
-12.5 -16.5 -4.7 -20.4 -6.3 -16.3 -14.0 -6.5 -11.8 -8.5 -20.7 -6.2 -19.9 -10.3 -15.2 -13.5 -5.6 -13.0 -6.1 -16.0 -15.4 -8.3 -13.8
fossil fuel cars 2019 2020
% Change 2.7 4.7 11.9 9.5 7.3 6.5 -1.6 12.3 7.2 1.1 9.8 9.5 17.3 3.7 12.9 6.4 2.1 2.2 -1.4 2.2 9.0 8.5 6.6
Phase out fossil fuel
2020 2021
heavy duty vehicles
Modal shift in
ground transport Rebound after COVID-19 restrictions
Low Medium High Frontrunner Enerdata, 202269
36 37OVERALL GROWTH IN BUILDINGS EMISSIONS, BUT AVERAGE
BUILDINGS By 2040, global emissions intensity
Increase energy efficiency and electrification
from buildings need to be reduced PER CAPITA EMISSIONS FROM 2015–2019 UNCHANGED
by 90% from 2015 levels, and at least 95%
below 2015 levels by 2050.70,71
G20 buildings emissions (incl. indirect emissions) per capita
CO2 emissions from this sector include direct emissions from 6 39%
G20 ENERGY-RELATED
fuel combustion (for space heating, food preparation, etc.), and
CO2 EMISSIONS IN 2021
indirect emissions from energy (incl. electricity) used to build,
heat and cool buildings, and district heating. 30%
8% Direct 16% Indirect 5
26%
26%
In 2021, direct emissions from the buildings sector accounted for
8% of the energy-related CO2 emissions in the G20. While per Reduction Rebound 2015–2019:
capita emissions in the OECD countries of the G20, on average,
in 2020: in 2021:
+3.2% 19%
were reduced by 12% between 2017 and 2021, they increased in -2.1% +4.4% (+0.8% p.a.)
4 13%
Pre COVID-19 trend (2015–2019)
non-OECD countries by 19%, reflecting vastly different per capita 10% 10%
tCO2 /capita (in 2021)
8% 7%
emissions. Between 2019 and 2020, in most countries, emissions 6%
per capita decreased (except for an increase in Indonesia of 34% and in Saudi Arabia of 10%). However, in 2021, in 3 0%
0% -4%
all G20 members (except Australia, Canada, Japan, and Mexico), per capita emissions again increased, showing a -6%
-8% -8% -9%
strong rebound effect of 4.4% after a decline of 2.1% in 2020.
-13% -12% -12%
2 -13%
The buildings sector is one of the sectors most urgently in need of decarbonisation. To reduce emissions, G20
members need to develop and implement ambitious energy codes for existing buildings and near zero policies -15%
-23% -22%
for new buildings, as well as promote retrofitting to reduce heat demand.72 Achieving zero emissions in the -24%
-26%
buildings sector is also contingent on upstream decarbonisation (specifically in the power sector) to reduce the 1 -26%
sector’s indirect emissions. -33%
0 -39%
Policy assessment BRA IND MEX IDN ARG FRA G20 TUR CHN ITA UK ZAF EU27 GER JPN CAN RUS KOR SAU AUS USA
Non
OECD
OECD
ARG AUS BRA CAN CHN EU FRA GER IND IDN ITA JPN MEX RUS SAU ZAF KOR TUR UK USA
Near zero energy % Change
2019 2020 -8.8 -3.2 -15.9 34.0 0.0 -5.6 -3.3 -1.0 2.5 -5.6 -4.3 -6.3 -7.5 -5.7 -0.1 -7.7 -3.5 -8.3 9.8 -5.6 -10.5 1.6 -8.0
new buildings
% Change
Renovation of 22.6 3.5 -2.2 3.8 3.3 6.0 6.1 13.8 10.3 5.9 4.8 4.6 6.8 7.4 -2.6 -1.6 10.0 1.1 1.4 -3.1 5.3 8.2 4.2
2020 2021
existing buildings
Rebound after COVID-19 restrictions lifted
Low Medium High Frontrunner Enerdata,2022 73
38 39INDUSTRY EMISSIONS INTENSITY DECREASED
INDUSTRY Industrial emissions need to be
IN 12 G20 MEMBERS BETWEEN 2014 AND 2018
reduced by 65–90% from 2010
Increase material and energy efficiency levels by 2050.74
G20 industry emissions intensity (incl. indirect emissions)
CO2 emissions in the industry sector result from direct emissions
G20 ENERGY-RELATED 2.0
(conversion of energy), indirect emissions (electricity and co-
CO2 EMISSIONS IN 2021
generated heat), and process emissions (mainly from iron, steel,
or cement). In 2021, direct emissions from the industry sector
accounted for 23% of the energy-related CO2 emissions in the 23% Direct 18% Indirect
G20, the highest share of all energy-related CO2 emissions.
Reduction Rebound 2015–2019:
On average, energy-related CO2 emissions have declined by 1.5 60%
in 2020: in 2021:
-3%
0.8%/yr since 2015. With decreases in industrial activity due
-4.5% +3.3% (-0.8% p.a.)
to COVID-19 pandemic lockdowns, emissions fell by 4.5%.
48%
However, in 2021 emissions rebounded by 3.3%.
tCO2e/USD (in 2018)
Pre COVID-19 trend (2014–2018)
Developing countries of the G20 show higher emissions intensity, partly due to heavy industry moving to 1.0 33% 34% 30%
emerging and developing countries, along with differences in technological standards and regulations. 30%
Developing countries also typically derive a higher share of their GDP from energy-intensive industry, which 22% 22%
contributes to higher overall carbon intensity of their economies.75 To reduce emissions from industry, G20 16%
15%
members need to increase material and energy efficiency, fuel switching, and improve material recycling.
0.5 -1% 0%
One way to do this is by using green hydrogen to reduce the carbon footprint of the sector. Fifteen members 1% -6% -8%
of the G20 already have hydrogen strategies, although some include hydrogen production from coal and gas. -3% -10% -10% -10%
-14% -14% -13%
To reach net zero, G20 members that have not yet done so should, therefore, focus their strategies on green
hydrogen production.76 -22% -23%
-25% -25%
0.0 -30%
UK FRA ITA GER USA EU27 JPN CAN AUS ARG MEX BRA KOR SAU IDN G20 TUR CHN RUS IND ZAF
Policy assessment
Non
OECD
OECD
Hydrogen
strategy:
ARG AUS BRA CAN CHN EU FRA GER IND IDN ITA JPN MEX RUS SAU ZAF KOR TUR UK USA
Energy efficiency
in industry Strategy No strategy
G20 members with hydrogen strategies
Low Medium High Frontrunner Enerdata, 2022 77
40 41LAND USE Global deforestation needs to be
AGRICULTURE Methane emissions (mainly enteric
fermentation) need to decline by
halted and changed to net zero
Stop wildfires and promote reforestation Reduce methane emissions 10% by 2030 and by 35% by 2050 (from
CO2 removals by around 2030.78
2010 levels). Nitrous oxide emissions
(mainly from fertilisers and manure) need to
be reduced by 10% by 2030 and by 20% by
Forests absorb GHGs, regulate water flows, protect biodiversity, and shield coastal communities from extreme Emissions from agriculture accounted for 10% of the G20’s total 2050 (from 2010 levels).84
weather events and sea level rise, thus helping reduce the impact of climate change. The forests with the largest GHG emissions in 2020. However, while it only accounts for
carbon sinks in the world are situated in Brazil, Canada, China, Russia, and USA.79 1.7% of the G20’s energy-related CO2 emissions, the sector is
responsible for 46% of methane emissions (2019). Methane emissions rose from 1990 to 2019 by 6.6%. In addition
However, the global forest stock is at risk. Destructive drivers are wildfires, land use change to croplands, cattle
to CO2 emissions and methane emissions, agriculture is responsible for 80% of global nitrous oxide emissions.
pastures, and forestry as well as urbanisation and commodity-driven deforestation.80 From 2002 to 2021, Brazil
lost 27.8 Mha of humid primary forest (important for carbon storage), nearly half of the total forest loss in the Agricultural emissions are primarily caused by digestive processes of livestock and their manure. Synthetic
country.81 In Russia, the total area burnt by wildfires in the first half of 2022 had reached 19 Mha – an area bigger fertilisers, higher demand for food, feed and biofuels and more resource-intensive production result in ever more
than Greece.82 In Canada, over the last two decades, their managed forest lands have been logged faster than emissions.85 Demand for space for livestock and feed also drives forest destruction to use the land for grazing
they have grown back. and fodder production, thereby reducing natural carbon sink capacities.
Halting deforestation and forest degradation is an enormous yet important task. Governments need to develop Sustainable agricultural practices are needed to feed a growing world while also minimising emissions.
and implement policies to stop deforestation. They must also ensure that implementing agencies are sufficiently Measures include reducing enteric fermentation through adapting the diets of livestock and using new
financed. It is important that indigenous land rights are protected, and that indigenous peoples are part of technologies, improving manure management, changing rice types, and upgrading cultivation and clearance
the decision making. Additional measures include using protected area networks, developing deforestation- techniques. Reducing production emissions should be augmented with behavioural changes by resource-
free supply chains, promoting forest-friendly infrastructure (including through strict impact assessments), and intensive consumers. Such changes include making dietary changes in favour of vegetables and fruits, reducing
developing optimal land use approaches.83 consumption of animal-derived products, and reducing food waste.86
Policy assessment G20 methane emissions from agriculture
2,200
ARG AUS BRA CAN CHN EU FRA GER IND IDN ITA JPN MEX RUS SAU ZAF KOR TUR UK USA 2,150
MtCO2e/year
Net zero deforestation
2,100
policies
2,050
2,000
Low Medium High Frontrunner 1990 1995 2000 2005 2010 2015 2019
Gütschow, J. et al., 2021; 87 Climate and Clean Air Coalition, 2021 88
42 43FINANCE
Paris Agreement: Make finance flows consistent with a pathway towards
low-GHG emissions and climate-resilient development.
Reduce subsidies and increase climate finance
KEY ACTIONS
Risk disclosures: Make the disclosure of climate risk mandatory for financial
institutions and corporations.
Production subsidies: Subsidies to fossil fuel production with the justification of
energy security and revenue generation need to be avoided, and clean energy
pathways need to be prioritised.
Consumption subsidies: Support for the cost-of-living crisis must not entail higher
levels of fossil fuel consumption subsidies and should, instead, prioritise increasing
energy efficiency to lower energy bills and encourage switching to low-carbon
energy alternatives.
Carbon pricing: Ramp up carbon pricing schemes and expand their coverage in line
with climate targets.
Public finance: Commit to ending public finance for all fossil fuels, make good on
any existing commitments to end finance for fossil gas, and scale up funding for
renewable energy.
MEXICO, 2022: A demonstrator
holds up a sign that reads: “It is
not an investment if it destroys
Climate finance: G20 members that are obliged to provide climate finance need to
the planet” outside the National increase their contributions to meet the USD 100bn goal, to be at least in line with
Palace in Mexico City, during
a global protest. © PEDRO
what a fair share of their contribution would be, based on national income, historic
PARDO/AFP via Getty Images emissions, and size of population.
44 45SOME G20 MEMBERS ARE MAKING GOOD
FINANCIAL POLICIES AND REGULATIONS PROGRESS ON CLIMATE RISK DISCLOSURES
Mandate disclosure of climate-related financial risk
France: Pushing forward
UK: Mandatory climate risk on climate risk assessment South Korea: Mandatory ESG
disclosure requirements for large with 2022 report on the disclosure requirements for
Governments can align financial systems with climate goals through regulations and by enforcing organisations (>500 employees) governance of climate change companies listed on the Korea
standards of behaviour. The most important of these is the disclosure by companies and financial from April 2022, to be extended risks in the insurance sector.107 Composite Stock Price Index
institutions of climate-related financial risks, which helps to push investment towards green to all firms by 2025.106 to be rolled out between 2025
and 2030.108
finance and away from risky assets. The Task Force on Climate-Related Financial Disclosure
(TCFD) recommended in 2015 that disclosure be broken down by governance, strategy and
management of climate risks, as well as the metrics and targets used to assess them.89 The
International Sustainability Standards Board (ISSB) will release a detailed framework building on
their recommendations late in 2022.
Japan: Mandatory
Some G20 governments have made disclosure mandatory, or committed to doing so – notably climate risk disclosure
France,90 Brazil,91 Germany,92 the EU,93 the UK,94 South Korea95 and Japan.96 Others have requirements for 4,000
suggested voluntary disclosure.97 The obligations around disclosure refer in some cases to financial companies listed
institutions, and in others to corporations. The ISSB framework will likely influence the drafting of on the Tokyo Stock
Exchange announced
regulations in many countries and encourage international standardisation.98
in October 2021, to
Australia, Canada, France, Japan, Mexico, the UK and the EU are also members of the Task Force be implemented by
on Nature-Related Financial Disclosures (TNFD). Acknowledging the complex relationship that 2024.109
nature and biodiversity share with climate change, this initiative lays out recommendations for
disclosure along similar lines as the TCFD but for nature-based risks beyond carbon emissions.99
Brazil: Implementation
Progress has also been made on testing the vulnerability of national financial systems to climate of mandatory climate
risks. Known as climate ‘stress tests’, these have been conducted recently by regulators in risk disclosure
China,100 the EU,101 South Africa,102 South Korea,103 and the UK.104 Building on earlier assessments of requirements for South Africa: Green Finance
Indonesia: Green Taxonomy
financial institutions Taxonomy announced in
climate risk, France released a report in February 2022 on the governance of climate risks in the announced in January 2022 to
to be completed by April 2022 to identify and
insurance sector.105 help investors direct finance
December 2022.110 track sustainable finance
toward sustainable activities.112
activities for investors.111
46 47CARBON PRICES ARE RISING, BUT ARE STILL TOO
CARBON PRICING AND REVENUES LOW; COVERAGE IN THE G20 REMAINS HIGHLY
Accelerate carbon pricing and expand coverage INSUFFICIENT, EXCEPT IN FEW COUNTRIES
Coverage and average price of explicit carbon pricing schemes
Pricing carbon effectively can encourage emitters across the entire economy to implement efficiency measures G20 MEMBER COVERAGE PRICE COVERAGE*
and low-carbon transition plans. Currently, 13 G20 members (compared to only 10 five years ago) have some form
Argentina Low Very low High >66%
of explicit national carbon pricing scheme, such as carbon taxes and emissions trading schemes (ETS). Brazil,
Australia None n/a Medium 33%– 66%
Indonesia, Russia, and Turkey are considering introducing such schemes.
Brazil None n/a Low USD 40***
France Medium Sufficient
climate aims. France and Canada are the only G20 members whose carbon prices were above the USD 40/tCO2e
Germany High Low Low USD 11–39
threshold by 2020 as recommended by the High-Level Commission on Carbon Prices. Some members (Germany,
India None n/a Very low USD 1–10
South Korea, the UK, and the EU) have a carbon price that is defined as “low” (USD 11–39/tCO2e), while carbon
prices in the rest of the G20 remain “very low”, below the USD 10/tCO2e threshold. Indonesia None n/a *Total GHG covered by a carbon price including
EU ETS, national and subnational mechanisms.
Some progress is being made. Under the EU’s Carbon Border Adjustment Mechanism (CBAM – draft regulation Italy Medium Very low
released July 2021113), imports of certain goods to the EU will face a carbon price, based on the GHG emissions Japan High Very low **Price ranges in some countries based on sector
or use type. For EU ETS countries, the prices
generated during their manufacture. Mexico Medium Very low
listed are separate to the EU ETS price (last line of
China’s national carbon ETS, launched in July 2021, is now used by nearly all liable power stations (more than Russia None n/a the table).
2,100), covering over 30% of China’s total GHG emissions; South Africa proposed to increase their carbon tax Saudi Arabia None n/a ***The High-Level Commission on Carbon Prices
rate to reach USD 20/tCO2e by 2026 and USD 30/tCO2e by 2030; and the state of Washington in the USA plans concluded that the explicit carbon price level
South Africa High Very low
to introduce carbon pricing schemes. Progress is too slow, however: Indonesia has delayed the introduction of a consistent with achieving the Paris Agreement
South Korea High Low temperature target is at least USD 40–80/tCO2 by
carbon pricing scheme due to the energy crisis, while Mexico’s carbon tax now exempts fuel and diesel.114
Turkey None n/a 2020 and USD 50–100/tCO2 by 2030.
Moreover, when emissions coverage is considered for national-level explicit carbon pricing schemes, only
UK Medium Sufficient In some countries, such as South Korea, due to
schemes in Canada, Japan, South Africa, and South Korea cover more than 66% of domestic emissions. Most
USA Low Low exemptions or extensive use of free allowances,
governments have, at least, maintained plans for pricing carbon in the aftermath of the COVID-19 pandemic.115
the actual implicit price is much lower than the
EU Medium Sufficient
explicit price.
Carbon Pricing Leadership Coalition, 2022 116
48 49You can also read