Classification of directionally specific vagus nerve activity using an upper airway obstruction model in anesthetized rodents
←
→
Page content transcription
If your browser does not render page correctly, please read the page content below
www.nature.com/scientificreports
OPEN Classification of directionally
specific vagus nerve activity using
an upper airway obstruction model
in anesthetized rodents
P. Sabetian1, Y. Sadat‑Nejad2 & Paul B. Yoo1,2,3*
Electrical signals from the peripheral nervous system have the potential to provide the necessary
motor, sensory or autonomic information for implementing closed-loop control of neuroprosthetic or
neuromodulatory systems. However, developing methods to recover information encoded in these
signals is a significant challenge. Our goal was to test the feasibility of measuring physiologically
generated nerve action potentials that can be classified as sensory or motor signals. A tetrapolar
recording nerve cuff electrode was used to measure vagal nerve (VN) activity in a rodent model of
upper airway obstruction. The effect of upper airway occlusions on VN activity related to respiration
(RnP) was calculated and compared for 4 different cases: (1) intact VN, (2) VN transection only
proximal to recording electrode, (3) VN transection only distal to the recording electrode, and
(4) transection of VN proximal and distal to electrode. We employed a Support Vector Machine
(SVM) model with Gaussian Kernel to learn a model capable of classifying efferent and afferent
waveforms obtained from the tetrapolar electrode. In vivo results showed that the RnP values
decreased significantly during obstruction by 91.7% ± 3.1%, and 78.2% ± 3.4% for cases of intact VN
or proximal transection, respectively. In contrast, there were no significant changes for cases of VN
transection at the distal end or both ends of the electrode. The SVM model yielded an 85.8% accuracy
in distinguishing motor and sensory signals. The feasibility of measuring low-noise directionally-
sensitive neural activity using a tetrapolar nerve cuff electrode along with the use of an SVM classifier
was shown. Future experimental work in chronic implant studies is needed to support clinical
translatability.
Among myriad peripheral nerve electrodes, such as spiral nerve cuffs, flat interface nerve electrodes (FINE) or
intrafascicular electrodes1–5, have been used successfully in many nerve stimulation systems as potential means
of optimizing therapies via a closed-loop controlled approach. Cuff electrodes have been shown to be stable
for chronic implantation in humans for both stimulation and recording applications. However, the widespread
clinical use of nerve electrodes as a means of recording peripheral nerve activity has been limited6. This is due
to numerous factors such as (1) developing an appropriate nerve cuff to record high signal-to-noise ratio (SNR)
as well as directionally-sensitive r ecording7,8 (2) clinical translation of advanced neural interfaces for long-term
atients9, and (3) developing closed-loop controllers that can process and provide meaningful information
use in p
about the recorded neural s ignals10.
The ability to obtain directional information from electrically measured neural activity could have important
functional implications for neuroprosthetic applications, such as vagus nerve stimulation (VNS) therapy. The
cervical vagus nerve is commonly referred to as the tenth cranial nerve and innervates the heart, lungs, diges-
tive tract, and other organs of the chest and abdomen. VNS is an established therapeutic option for patients that
suffer from drug-resistant epilepsy and depression, with potential for treating rheumatoid arthritis and other
disorders11. Despite the continued use of VNS therapies in patients, the overall clinical efficacy remains modest
due in part by limitations in utilizing electrically recorded vagal nerve activity as part of a closed-loop controlled
1
Institute of Biomedical Engineering, University of Toronto, 164 College St Room 407, Toronto, ON M5S 3G9,
Canada. 2Department of Electrical and Computer Engineering, University of Toronto, 10 King’s College Rd,
Toronto, ON M5S 3G9, Canada. 3Toronto Rehabilitation Institute‑University Health Network, University of
Toronto, 550 University Ave., Toronto, ON M5G 2A2, Canada. *email: paul.yoo@utoronto.ca
Scientific Reports | (2021) 11:10682 | https://doi.org/10.1038/s41598-021-89624-3 1
Vol.:(0123456789)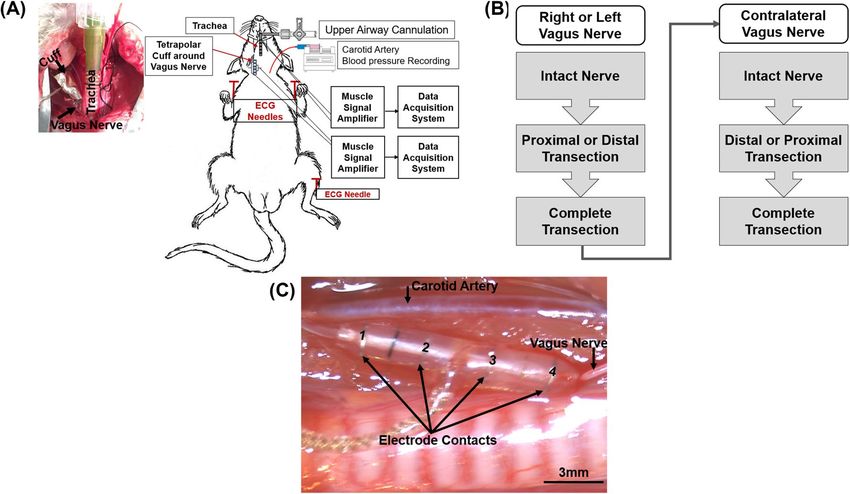
www.nature.com/scientificreports/
Figure 1. Sample data consisting of neural and physiological raw data that were measured when (A) left vagus
nerve was intact, (B) left vagus nerve transected only at the proximal end, (C) left vagus nerve was transected
only at the distal end, and (D) left vagus nerve was transected at both ends. It is noted that (A) and (C) are
from the one experiment and (B) and (D) are from another experiment. Each signal trace (from top to bottom)
represents the recorded neural activity (ENG: tetrapolar signal, RnP: respiratory-related vagus nerve profile) and
physiological parameters (GGEMG: genioglossus muscle activity, BP: blood pressure, and HR: heart rate). Grey
boxes represent upper airway obstructions. [†, denotes flushing of carotid catheter with heparinized saline].
therapeutic system. Importantly, it has been shown that neural signals obtained from the vagus nerve can provide
a means of predicting epileptic s eizures12,13 , as well as monitoring respiratory function14,15.
To date several potential techniques and methods have been developed to extract directional information
from peripheral nerves. However, these techniques have been demonstrated using either arrays of multi-contacts
electrode cuff (MEC) placed within a single nerve cuff electrode or using electrically-evoked neural activity (for
example compound action potential (CAPs) in frog and p ig16,17). MECs can be used to differentiate directional
information by measuring the propagation of neural signals. Velocity-selective recording (VSR) methods in
MECs16–18, have taken advantage of action potential propagation via delay-and-add operators that emphasize
CAP with specific velocities and make it possible to detect the fiber type. However, this approach is unable to
distinguish signals that have similar conduction velocities. Alternative method of selective recording of naturally-
evoked (or mechanical stimuli) CAPs can be achieved using spatiotemporal signatures extracted from MEC
recordings19,20. These recordings demonstrated two important concepts; firstly, that it is possible to record natu-
rally occurring spikes using MEC and basic signal processing and, secondly, that by using either a modified VSR
process or spatiotemporal signatures, it is possible to record physiological neural spikes and classify the signals
based on their velocities or direction in real time. However, such MECs may not be suitable for use in small
animal experiments and may likely entail complex hardware specifications (e.g., huge number of lead wires or
high data transfer rate) when clinically translating this technology in patients.
Building on these ideas, our previous work showed that directionally-sensitivity recordings of KCl-evoked
signals that are closer to physiological neural activity (e.g., 1–10 µV) can be achieved by using a simple tetrapolar
nerve cuff electrode21. Tetrapolar cuff uses the absolute minimum number of electrodes needed to generate two
distinct tripolar signals that, in turn, generates a low-noise, directionally-sensitive neural signal. However, the
tetrapolar recording configuration is uniquely different and this study is the first application of minimizing the
number of recording electrode contacts (e.g., tetrapolar nerve cuff e lectrode21).
In this paper, we present results from a study where the primary objective was to test the feasibility of using a
tetrapolar nerve cuff electrode to record physiological electroneurogram signals from either the left or right vagus
nerve in anesthetized rats. We employed an upper airway obstruction model to generate directional changes
in neural activities (e.g., suppressed afferent respiratory fibers during obstruction)22. The recorded signals were
classified into efferent and afferent waveforms by using a supervised learning model—support vector machine
(SVM)—which used a Gaussian kernel to transform the data into latent space and differentiate neural signals
based on an imposed h yperplane23.
Results
Vagus nerve activity and related physiological parameters. In animals with an intact vagus nerve
(Fig. 1A), obstruction of the upper airway resulted in an immediate and sustained decrease in the tetrapolar
ENG activity (first panel, ENG [µV]) and a corresponding 92% reduction in the RnP (second panel, RnP [µV2]),
when compared to baseline. This decrease in neural activity was accompanied by increases in GGEMG activ-
ity (138%), BP (20%), and HR (5%). The changes in variables (except for the HR) were statistically significant
(Fig. 2). Once the airway obstruction was removed, all signals returned to baseline levels within approximately
Scientific Reports | (2021) 11:10682 | https://doi.org/10.1038/s41598-021-89624-3 2
Vol:.(1234567890)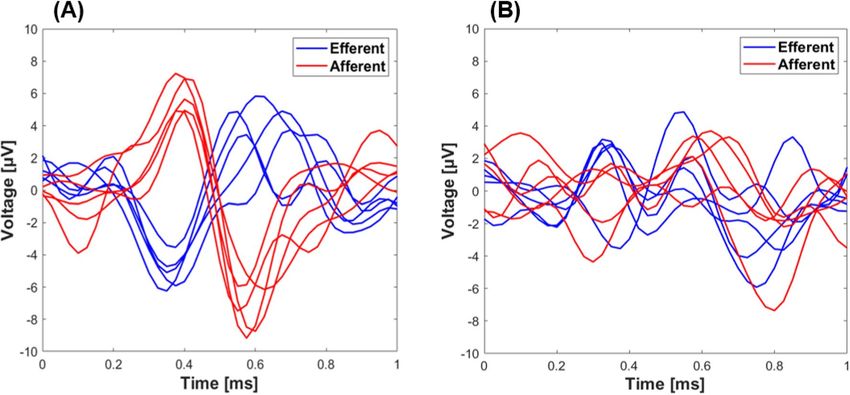
www.nature.com/scientificreports/
Figure 2. Summary of the effects of airway obstruction on different cases including (1) the intact nerve, (2) the
transected nerve at the proximal end, (3) the transected nerve at the distal end, and (4) the transacted nerve at
both ends. Analysis was performed for on all physiological parameters including (A) respiratory-related vagus
nerve profiles (RnP), (B) genioglossus muscle activity (GGEMG), (C) blood pressure (BP), and (D) heart rate
(HR). [*, p value < 0.05 compared to the baseline, n = 6].
1 min. Similar responses were observed in animals where the vagus nerve was only transected proximal to the
recording electrode (Fig. 1B). Airway obstruction caused a significant decrease in RnP (78%) along with signifi-
cant increases in GGEMG (111.3%) and BP (18%). Again, the change in HR was negligible.
Surgical transection of only the distal segment of an intact nerve (Fig. 1C) or transection of both ends of
the VN (Fig. 1D) resulted in marked losses of RnP that confirmed our hypothesis that the measured neural
activity primarily consisted of afferent signals traveling towards the brainstem. Naturally, there were no signifi-
cant changes in RnP observed during airway obstructions (Fig. 2A), but there was a significant difference in
the baseline RnP activity (p = 0.013) between distal only and complete transection of the VN (Fig. 1C vs. 1D,
respectively). Compared to the absence of RnP activity (Fig. 1D), there was a measurable amount of efferent
VN activity when the proximal end remained intact, however airway obstructions did not cause any changes in
efferent neural output.
With only the distal VN transected (Fig. 1C), airway obstructions elicited significant increases in GGEMG
(133.3%) and BP (15%), with negligible changes in HR. Both responses returned to baseline shortly (e.g., ~ 1 min)
after re-opening the upper airway. Interestingly, with the VN completely transected (Fig. 1D), there was only a
significant increase in GGEMG (91%).
Accuracy of classification models. Samples of 6 raw data of afferent (proximal transection only) and
efferent (distal transection only) activity from either the left or right VN of one experiment is shown in Fig. 3.
One can see that the main difference between the two waveforms is the opposite polarity, where afferent and
efferent signals were completely synchronized (Fig. 3A). However, due to the amount of noise within the data
and the complexity of the waveforms (e.g., the starting point of the AP and the possibility of overlap, refer to
Fig. 3B), more advanced methods such as machine learning approaches are required to classify afferent from
efferent waveforms. As mentioned in Methods and Materials, a thresholding method was used to denoise the
data and find the peaks that correspond to the ENG waveforms. The average of the threshold value among all
experiments was obtained 2.8 ± 0.3 µV.
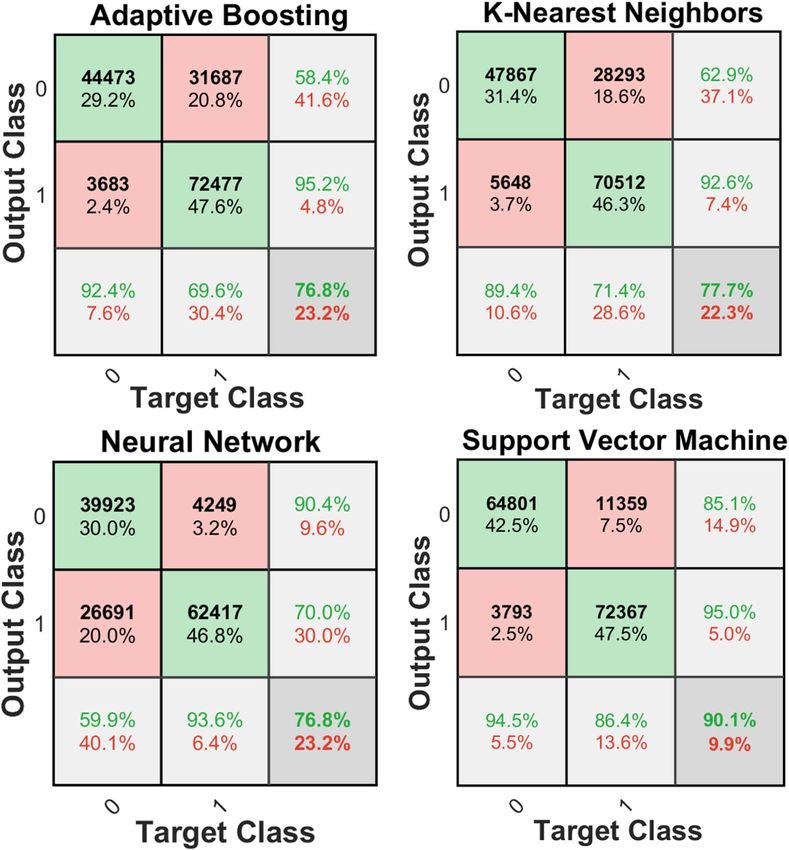
The confusion matrix of the mentioned classifiers (refer to Machine Learning in the Methods and Materials)
was calculated and compared for all of the 4 different classifiers for 2-class classification [e.g., class0 (efferent)
and class1 (afferent) in model 1 (Fig. 4)]. Furthermore, the summary of F 1-score for all the classifiers using
model 1 applying validation set (refer to Fig. 5) is shown in Table 1. Both the confusion matrix as well as the
F1-score analysis show that the SVM classifier exhibits the best performance among all the classifiers for the
Scientific Reports | (2021) 11:10682 | https://doi.org/10.1038/s41598-021-89624-3 3
Vol.:(0123456789)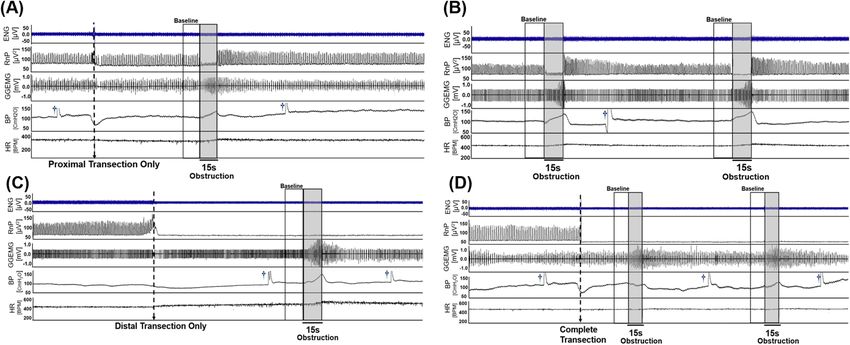
www.nature.com/scientificreports/

                                            Figure 3.  Sample data of neural recordings obtained from a single experiment, where the vagus nerve was
                                            transected only proximally (afferent) or distally (efferent) from the nerve cuff electrode. Signals representing (A)
                                            synchronized and (B) asynchronized ENG signals were plotted in 1 ms windows. [x-axis: time = 0–1 ms; y-axis:
                                            amplitude =  − 10–10 μV].

                                            2-class classification of this study’s raw data. Therefore, the SVM classifier was chosen as the classifier for both
                                            models (e.g., model 1 and model 2).
                                                Confusion matrix analysis for 2-class classification showed a significant imbalance in accuracy in two dif-
                                            ferent classes (e.g., 94.5% for the class 0 vs. 86.4% for the class1 in the SVM classifier, refer to Fig. 4). To tune
                                            hyperparameters (cost function penalty term in this case), the validation set was used as described in Methods
                                            and Materials section. This method demonstrates a ratio of 1.5:1 for afferent and efferent respectively, which
                                            leads to a more balanced prediction between the classes for the selected SVM model. This means that misclas-
                                            sifying afferent data leads to a higher penalty for the classifier. Based on this new ratio, the SVM classifier was
                                            reconstructed with the balanced classification model (e.g., the ratio of 1.5:1 for afferent and efferent, respectively).
                                                The performance of both proposed models (e.g., model 1 and model 2) in differentiating two classes [e.g.,
                                            class 0 (efferent) vs. class 1 (afferent)] was further evaluated using ROC and AUC techniques (Fig. 6). The ROC
                                            plot illustrates a value between zero and one, where an AUC of one refers to a perfect separation of the classifier
                                            between the two classes, and an AUC of 0.5 represents chance. True positive rate (or the y-axis) illustrates the
                                            rate at which samples were correctly classified, while false positive rate (or the x-axis) illustrates the portion of
                                            the samples that were misclassified. Both Figs. 6 A and B show an overall AUC of 93% and 95%, respectively.
                                            These results confirm two important points: (1) both models have high accuracy in the detection between the
                                            two classes and (2) both models perform similarly. The only difference between the two models is the ratio of
                                            training and validation data sets.
                                                The confusion matrices obtained for both model 1 and model 2 illustrate the performance of the SVM clas-
                                            sifier on each individual class, as shown in Figs. 7 A and B, respectively. Model 1 achieved accuracies of 84.5%
                                            and 84.8% for class 0 (efferent) and class1(afferent), respectively (Fig. 7A). Model 2 had accuracies of 86.5%
                                            and 85.1% for class 0 and class1, respectively. Overall, model 1 and model 2 had accuracies of 84.7% and 85.8%,
                                            respectively for 2-class classification. These high accuracies as well as the similarity between these two models
                                            suggests that the features used and the learned classifier led to a generalizable and robust classifier. The main
                                            difference between model 1 and model 2 refers to their test sets. Model 1 was tested on the unseen individual
                                            points but from experiments that the model was trained on. While, in model 2, the test set was chosen from a set
                                            of new data points from an unseen experiment. The non-significant and negligible difference (e.g., only 1.1%)
                                            in accuracy of these two models could be due to variation in SNR.

                                            Hypothesis testing using airway obstruction data. In order to further test the accuracy of both model
                                            1 and model 2, the obstruction data that was collected for the intact nerve, the proximal end transection, and
                                            the distal end transection were fed to both classifiers so as to evaluate the outcomes. All data was then compared
                                            to their corresponding baseline data. Both models predicted that the percentage of afferent signals significantly
                                            decreased for both the intact nerve (60% decrease) and the proximal transection only (70% decrease), during
                                            obstruction. However, this value did not change significantly (e.g., 5% decrease) during obstruction in the case
                                            where only the distal VN was transected (Fig. 8). This data confirmed the hypothesis that during obstruction the
                                            majority of the afferent neural activities are suppressed, and the majority of neural signals consisted of efferent
                                            activity. This data also verifies the suitability in performance of our classifiers in detecting afferent and efferent
                                            signals.
                                                Both classifiers illustrate that, when compared to baseline, afferent signals decreased significantly during
                                            obstruction for both the intact nerve and after the proximal end was transected. This value did not change sig-
                                            nificantly in the case where the vagus nerve was transected distal to the recording electrode.

          Scientific Reports |   (2021) 11:10682 |                https://doi.org/10.1038/s41598-021-89624-3                                                      4

Vol:.(1234567890)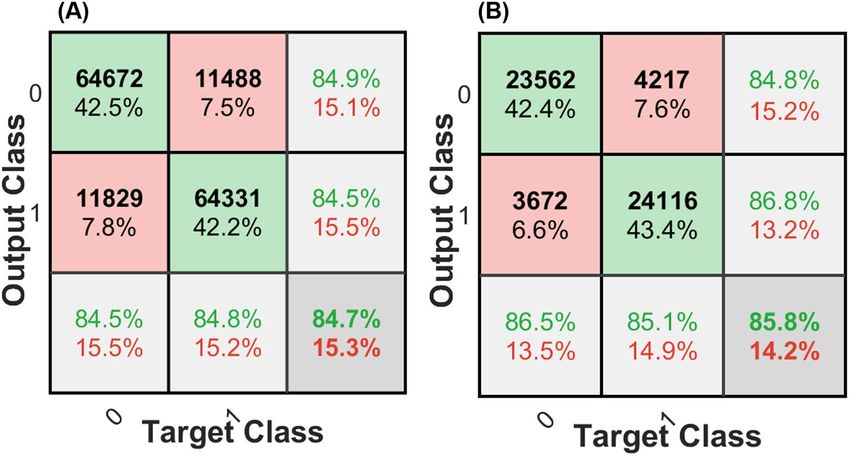
www.nature.com/scientificreports/
Figure 4. Confusion matrices corresponding to the different algorithms used for the 2-class problem
constructed with combined test sets (n = 6 rats). This data was tested on Model 1 only. The last row and column
of each confusion matrix show the recall and precision per class (class0: efferent, class1: afferent), respectively.
Discussion
In this study, we present preclinical data that supports the feasibility of using a single nerve cuff electrode in
conjunction with a machine learning algorithm to differentiate VN signals travelling in opposite directions.
Using an anesthetized rodent model of obstructive sleep apnea, changes in neural activity (RnP) and relevant
physiological signals (HR, BP, and GGEMG) were assessed under four different experimental conditions: (1) an
intact nerve, (2) nerve transected at the proximal end of the cuff electrode, (3) nerve transected at the distal end,
and (4) nerve transected at both ends. Our experimental results showed that a tetrapolar nerve cuff electrode
can be used to measure VN activity in a directionally-specific manner. Afferent and/or efferent neural activity
was compared between baseline conditions and during brief episodes of airway obstructions, where significant
decreases in afferent RnP were observed under certain conditions (e.g., proximal nerve transection). As pre-
dicted by previous work in other animal models18,22,24,25, we observed significant increases in GGEMG activity
(range = 91–138%) and BP (range = 15–20%) that were associated with airway obstructions. It is noted that the
GG muscle responded to obstructions, regardless of whether the VN was intact or bilaterally transected. In
contrast, there were no changes in BP in response to airway obstructions when the VN was transected bilater-
ally. Considering that there were no significant changes in HR (e.g., tachycardia), it is likely that the observed
increases in BP were mediated by vagal afferents.
The results of these experiments suggested an interesting model to test the bi-directional ability of a tetrapo-
lar nerve cuff electrode in recording VN activity. After filtering, thresholding and labeling all raw ENG (e.g.,
VN APs) the data was fed to a machine learning algorithm which was trained with 380,800 examples of signals
corresponding to afferent and efferent labels. To ensure that ECG and EMG artifacts were not mistaken for the
CAPs19, a sample size window of 1.025 ms (less than 5 ms) was set for the individual CAPs. In this study, support
vector machine (SVM) with Gaussian kernel23 was chosen as the classifier since it had the best performance
Scientific Reports | (2021) 11:10682 | https://doi.org/10.1038/s41598-021-89624-3 5
Vol.:(0123456789)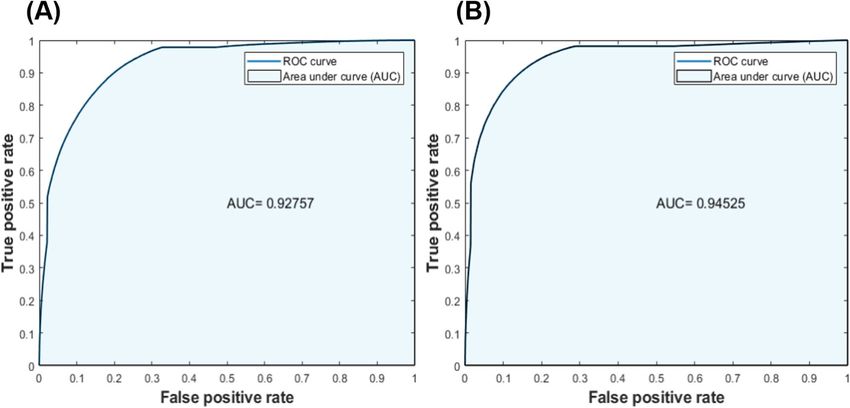
www.nature.com/scientificreports/
Figure 5. Illustrates the flow chart of (A) Model 1 and (B) Model 2. (A) In model 1, all data from every
experiment were concatenated and then randomly separated into two different data sets of (1) training and (2)
testing by considering a ratio of 60% to 40%, respectively. The training set was further split into 85% training
and 15% validation sets. (B) In model 2, one experiment was randomly chosen for testing, while the rest of the
data was used for training and validation with a ratio of 85% to 15%, respectively.
F1-score SVM Neural network K-nearest neighbours Adaptive boosting
Efferent 0.8472 0.7403 0.7383 0.7155
Afferent 0.8462 0.6721 0.8060 0.8039
Table 1. Summarizes the F1- score for different algorithms applied to the 2-class problem (efferent and
afferent) using Model 1.
Figure 6. Receiver operating characteristic (ROC) and the area under the curve (AUC) for the calculated the
performance of both classification models. These plots were conducted with respect to the true positive rate
and false positive rate of the test set; (A) shows the ROC for the classification model1 and (B) shows the ROC
for the classification model 2. The obtained results in both parts illustrate that both models had an acceptable
performance in distinguishing the two different classes, with an AUC of 93% and 95%, respectively.
Scientific Reports | (2021) 11:10682 | https://doi.org/10.1038/s41598-021-89624-3 6
Vol:.(1234567890)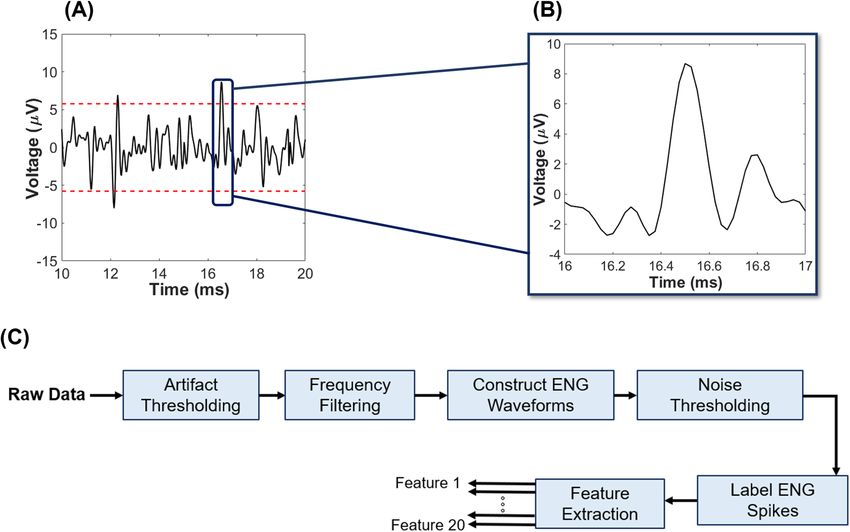
www.nature.com/scientificreports/
Figure 7. Confusion matrices corresponding to the testing data used to distinguish class 0 (efferent) from
class1 (afferent) ENG data: (A) Model 1 and (B) Model 2. Both figures illustrate a high performance of both
models in detecting efferent or afferent data and there is a close balance on performance that confirms the
generalization and robustness of both models. The last row and column of each confusion matrix shows the
recall and precision per class, respectively.
Figure 8. Comparison of the % afferent signals recorded during both baseline and airway obstruction for cases
of (1) intact nerve, (2) transection of only the proximal end, and (3) transection of only the distal end. Analysis
was performed for model 1 and model 2 classifiers. [*, p value < 0.05 compared to baseline, n = 6].
among other classifiers such KNN with coarse k ernel26, Adaboost27, NN with one hidden layer and 10 u nits28,
and were used to perform classification learning (refer to Fig. 4).
Two different models were trained in SVM with variation in training, validation and testing ratio. In the
first model, all data from every experiment were concatenated and then randomly divided into training (60%)
and testing (40%) sets. In which, training data was further divided into 85% training and 15% validation. In the
second model, one of the experiments was set aside, and the remaining data were trained to a validation ratio
of 85% to 15%, respectively for tuning hyper parameters. Models 1 and 2 illustrated accuracies of 84.7% and
85.8% on the testing set. While both models achieved high accuracy on the testing set, model 2 yielded about
1% higher accuracy (84.7% vs. 85.8%) compared to the model 1. This was achieved with a smaller number of
training data compared to model 1 (e.g., 228,480 vs 161,814). The difference in accuracy could be attributed the
testing data in model 2 being obtained from an experiment with high SNR, whereas the testing set in model
1 were randomly selected from experiments with variable SNR values. In conclusion, having high accuracy in
both models illustrates that the model (e.g., used features and classifier) are robust and generalizable. However,
it needs to be mentioned that the prediction of models is sensitive to the quality of recording. This means that
if the testing data experiment had low SNR, the prediction would be lower, as the model may have been trained
Scientific Reports | (2021) 11:10682 | https://doi.org/10.1038/s41598-021-89624-3 7
Vol.:(0123456789)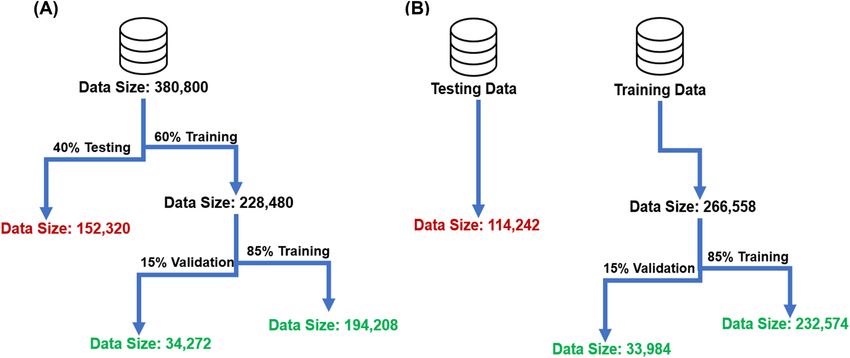
www.nature.com/scientificreports/
on higher-quality experiments. In this study, however, we were able to show that reliable differentiation between
efferent and afferent signals could be achieved using neural activity with relatively low SNR (6.05 ± 0.36 dB, range:
4.3–7.3 dB). It is reasonable to predict that the performance of machine learning algorithms could be further
improved with higher SNR signals (e.g., CAP) recorded from peripheral nerves.
In the final part of this study, the performance of both models was tested using a new data set from obstruc-
tion recordings that were fed to both model classifiers. Both models predicted obstruction data as efferent
signals with above 80% confidence, which confirms that the obstruction includes efferent data. As noted above,
the obstruction data should theoretically consist of efferent nerve activity. However, less than ideal SNR of the
recording data as well as the existence of overlapping afferent and efferent data could have caused the obstruction
data model to not consist of purely efferent activity. In addition, the upper airway was mechanically occluded
for only short periods of time and that an incomplete occlusion in some trials could have affected the results in
terms of yielding purely efferent or afferent activity during obstruction.
Thus far, several techniques and algorithms have been developed to improve the recording selectivity of extra-
neural electrodes. These techniques revolve around two general approaches: (1) using the temporal information
of recorded neural signals such as velocity-selective recording (VSR) methods16–18,29 or (2) using the spatial and/
or spatiotemporal characteristics of neural signals to localize the sources within a compound nerve trunk19,20,30,31.
Most of these studies involved CAPs that were electrically evoked using stimulation e lectrodes16,32–34, leading
to much higher amplitude signals than naturally evoked neural activity (e.g. produced by proprioceptive or
mechano-sensory afferent activity). For studies involving naturally evoked afferent activity18,35 classification
was applied to windowed signals (e.g. rectify-bin-integrated), not to individual CAPs. While a major advantage
of multi-contact electrode arrays is that they can be used to easily tune the recording system to differentiate the
fiber-type among the multitude of recorded neural signals, the need for large numbers of recording sites may
require relatively longer nerve cuff electrodes. Large multi-electrode arrays may not be suitable for use in small
animal experiments and may likely entail complex hardware specifications (e.g., large number of lead wires or
high data transfer rates) when clinically translating this technology in patients.
The results of this study suggest a minimum number of recording sites needed in a nerve cuff electrode that
when combined with machine learning techniques (e.g., SVM classifier) can effectively distinguish efferent and
afferent information from physiologically evoked neural activity. The results suggest that good performance of
directional recording may be achievable with fewer number of contacts and may be used as a template for design-
ing more complex implantable nerve cuff electrodes with greater geometrical efficiency.
Further refinements to classification algorithms such as applying cross validation in model 2 to ensure the
model will provide consistent results as that using different experiment for testing data set, combined with
improvements to the SNR and AP detection, could likely yield more robust discrimination performance and
improved tracking of neuronal firing rates. Future in vivo studies should investigate the long-term performance
of tetrapolar nerve cuff electrodes. The potential improvements in monitoring physiological function could
lead to precise control signals for assistive devices that are able to produce more natural movements and more
efficient electrical neuromodulation systems.
Implementing electrical neuromodulation therapies in a closed-loop manner could have a significant impact
on the use of implantable neurostimulators for treating patient populations. A logical progression of the cur-
rent work is to explore the use of tetrapolar recording configurations in high density nerve cuff electrode arrays
designed to be implanted around peripheral nerves. Recent preclinical studies suggest that VNS could potentially
be used to treat drug-resistant hypertension by modulating baroreflex depressor responses36,37. It has also been
shown experimentally that afferent vagal nerve activity can serve as a physiological biomarker of BP38, which in
turn could provide a feedback mechanism for adjusting VNS parameters. As shown by our classification results,
a tetrapolar nerve cuff can be used to record low-noise afferent or efferent neural activity to track changes in a
variety of physiological functions, such as those of the respiratory, cardiac or vascular systems.
Methods
Surgical setup. Acute, non-survival in vivo experiments were conducted in 6 Sprague Dawley rats (male,
weight = 500–750 g). All surgeries and procedures were approved by the University of Toronto Animal Care
Committee in accordance with the regulations of the Ontario Animal Research Act (Toronto, ON, Canada).
The design and conduct of the study were in accordance with the ARRIVE guidelines. Anesthesia was initially
induced by inhaled isoflurane (5% in 100% O2) within an induction chamber and subsequently maintained with
a gas mask (2–3% isoflurane, O 2 flow rate:1 L/min). Following completion of all surgical procedures, the anes-
thesia was transitioned to urethane (initial SQ bolus of 1.2 g/Kg body weight followed by supplemental doses of
0.1–0.2 g/Kg in 1 ml of sterile saline). Body temperature (37–39 °C), heart rate (300–400 beats m in−1), and blood
O2 level (98–100%) were monitored and maintained throughout the experiments.
With the rat in the supine position, a midline ventral incision and blunt dissection of neck muscles provided
access to the trachea immediately below the larynx. Following a lateral incision made between two adjacent rings
of tracheal cartilage, a tube was inserted in the caudal direction (blunt needle, 14G). The proximal end of the
tube was connected to a 3-way stopcock, which was used to create upper airway occlusions. The vagus nerve was
dissected and a tetrapolar nerve cuff electrode (NC-0.5-4-100P-2.5, inner diameter = 500 µm, 4 contacts, 100 µm
wide platinum contact, inter-electrode distance = 2.5 mm, and cuff length = 12 mm, Microprobes Inc. Gaithers-
burg, MD, USA) was implanted (Fig. 9). The electroneurogram (ENG) was measured as 2 independent bipolar
recordings (contacts 1 & 4, contacts 2 & 3) that were subsequently converted to a single tetrapolar ENG signal.
The outer surface of the recording electrode was wrapped with a layer of aluminum foil (thickness = 0.025 mm)
for the purpose of reducing noise artifacts39. The carotid artery was catheterized with PE-50 tubing (Intramedic
Polyethylene Tubing, BD Medical, Canada) to measure blood pressure. The catheter was connected in series with
Scientific Reports | (2021) 11:10682 | https://doi.org/10.1038/s41598-021-89624-3 8
Vol:.(1234567890)www.nature.com/scientificreports/
Figure 9. Overview of experimental setup. (A) Image of rat upper airway instrumented with tracheal tube
along with a schematic of apparatus used to obtain physiological signals. (B) Flow chart that illustrates the
recording protocol from either the left or right vagus nerve, and (C) A tetrapolar nerve cuff electrode implanted
on the left vagus nerve (diameter = 500 µm, inter-electrode distance = 2.5 mm, and total cuff length = 12 mm).
a pressure transducer (Deltran, Model: DPT-100, Utah Med, Midvale, USA) and a syringe filled with heparinized
saline (0.5 IU/ml). The syringe was controlled with an infusion pump (Pump11 Elite Infusion, Harvard Appara-
tus, Holliston, USA). The electrocardiogram (ECG) was obtained by inserting needle electrodes (23G, length = 1″)
in the forepaws and left hind paw. A pair of stainless-steel wires (diameter: 0.003″ Bare, 0.0055″ coated; length:
100 Feet; A-M systems, USA) were desheathed and inserted into the genioglossus muscle to record the electro-
myographic activity of the tongue muscle (GGEMG). All electrical signals were amplified (gain = 1000), filtered
(ENG = 100 Hz to 10 kHz, and EMG = 30 Hz–3 kHz, SR560, Stanford Research Systems, Sunnyvale CA), and
digitally recorded (sampling rate = 40 kHz, Powerlab 16/35, ADInstruments, Colorado Springs, CO). A needle
inserted in the lateral abdominal fat pad served as the electrical ground.
Experimental protocol. Multiple physiological parameters (BP, ECG, and GGEMG) as well as VN activity
were measured continuously throughout each experiment. Following a 1-h acclimation period, the experimental
protocol consisted of (1) a baseline period, (2) series of five obstructive apneas, each with a duration of 15 s and
separated by 1 min, and (3) post obstruction period (refer to Fig. 9B). The protocol was performed with the
VN intact, repeated after transecting the nerve either proximal (i.e., above) or distal to the recording electrode,
and repeated again after transecting the remaining intact end of the nerve. In each animal, this protocol was
performed on both the left and right vagus nerves in randomized order. The animal was euthanized at the end
of each experiment by intra-cardiac injection of 0.3 ml/Kg T-61 (Merck Animal Health, Kirkland, QC, Canada).
Changes in cardiovascular function parameters (e.g., HR and BP) were quantified in 15-s time bins during
the baseline, obstruction and post-obstruction periods. The HR was calculated by averaging the time interval
between successive R-peaks and the BP was obtained by calculating the average pressure (Lab chart Pro v8.1.5,
ADInstruments, Colorado Springs, CO). Processing of the GGEMG data involved signal rectification, filtering
(triangular Bartlett filter, window width = 300 ms) and then applying user-specified adaptive threshold methods
(e.g., findpeaks, threshold = 0.2 mV). The GGEMG signal was quantified by the area under each detected peak.
Signal to noise ratio (SNR) of neural activities was defined by the log ratio of the signal to the baseline noise (1):
Vpp Signal
SNR = 20log (1)
Vpp(Noise)
Signal processing and data analysis. Afferent/efferent spike extraction from ENG signals. The math-
ematical expressions of the three different ENG recording configurations are provided below: tetrapolar (Eq. 2),
(Eqs. 3–4), and bipolar (Eqs. 5–6). We converted the basic definition of the tetrapolar ENG (Eq. 2) into an
algebraic function of two bipolar ENG signals (Eq. 9) by calculating the difference between the two tripolar
expressions (Eq. 7 through 9):
Scientific Reports | (2021) 11:10682 | https://doi.org/10.1038/s41598-021-89624-3 9
Vol.:(0123456789)www.nature.com/scientificreports/
Figure 10. Process of extracting ENG signal. (A) An example of thresholding applied to raw ENG data,
where the dashed lines represent ± 3δ deviation from the mean assuming purely uncorrelated additive white
Gaussian noise sources (absolute value = 2.8 ± 0.3 µV). (B) Zoomed image of a single action potential that
was recorded from the distal nerve stump (i.e., afferent) using a tetrapolar cuff electrode. (C) Steps applied to
all raw data leading to feature extraction. The threshold in ‘Noise Thresholding’ block is constructed using a
global representation of the noise, which was recorded from ENG channels with completely transected vagus
nerve (e.g., absence of neural signal) and averaged across all experiments. The first three blocks (e.g., ‘Artifact
Thresholding’, ‘Frequency Filtering’, and ‘Construct ENG Waveforms’) were applied to signal as well as the noise
that is used for the thresholding process.
Tetrapolar = Tripolar1 − Tripolar2 (2)
V3 + V1
Tripolar1 = V 2 − (3)
2
V2 + V4
Tripolar2 = V 3 − (4)
2
Bipolar1 = V 1 − V 4 (5)
Bipolar2 = V 3 − V 2 (6)
V3 + V1 V2 + V4
Tetrapolar = V 2 − − V3 − (7)
2 2
1 3
Tetrapolar = [V 1 − V 4] + [V 3 − V 2] (8)
2 2
1
3
(9)
Tetrapolar = Bipolar1 − Bipolar2
2 2
Bipolar signals were obtained from animal experiments and initially processed via hard-thresholding (thresh-
old set at 700 µV) to remove any large-amplitude artifacts (‘Artifact Thresholding’, Fig. 10C). An 8th-order Butter-
worth bandpass IIR filter (passband = 250 Hz and 10 kHz,18) was applied to the bipolar signals (‘Frequency Filter-
ing’, Fig. 10C) and then subsequently used to construct the tetrapolar (ENG) signals (‘Construct ENG Waveforms’,
Fig. 10C). The respiratory related nerve profile (RnP) was computed by filtering (bandwidth = 250 Hz–10 kHz)
Scientific Reports | (2021) 11:10682 | https://doi.org/10.1038/s41598-021-89624-3 10
Vol:.(1234567890)www.nature.com/scientificreports/
Proximal transection Distal transection Complete
Pre-obstruction Obstruction Post-obstruction only only transection
Afferent + efferent
Afferent + efferent Afferent + efferent Afferent Efferent Noise
(dominant)
Table 2. Summarizes the efferent or afferent ENG activity associated with different paradigms of ENG
recording.
1. Variance 2. Skewness
3. Kurtosis 4. Entropy
5. Maximum absolute value of Fourier Transform (fft) 6. Root Mean Square value (RMS)
obility41
7. Average m 8. Range defined as maximum subtracted minimum value
9. Average power 10. Average of first derivative
11. Number of zero-crossing 12. Sign of maximum peak
13. Geometric mean 14. Harmonic mean
15. Root mean square level 16. Average integrated rectifier
17. Average power spectrum density 18. Average Welch’s Power
19. Direction of the first slope in the window 20. Number of slope sign changes rectifier in the window
Table 3. List of features that used in training algorithm.
the tetrapolar ENG signal, mathematically squared to obtain the signal power, and then low-pass (2 Hz) filtered14
as shown in panel 2 of Figs. 1A–D.
ENG signals were further processed by limiting the amplitude of the expected neural signal to be less than
or equal to three-times of standard deviation of noise (‘Noise Thresholding’, Fig. 10A,B), which was assumed to
consist of uncorrelated additive white Gaussian n oise40 The actual noise used in this model was obtained from
ENG measurements taken after the vagus nerve was transected both above and below the recording electrode
(refer to Table 1). The formula used to calculate the noise threshold is shown as follows:
Tupper = mean(DataTetra ) + 3std(NoiseTetra ) (9)
Tlower = mean(DataTetra ) − 3std(NoiseTetra ) (10)
Considering the duration of neural signals and data sampling rate (e.g., 40 kHz), the peak value of each
identified ENG signal was centered within a 41 sample (= 1.025 ms) time window and used to capture nerve
action potentials (‘Label ENG Spikes’, Fig. 10C). Each window was labeled in two different categories (e.g., affer-
ent or efferent) depending on its recording category (Table 2) and subsequently used in training the machine
learning algorithm (Feature Extraction, Fig. 10C). All processes were performed in Matlab (Mathworks Inc.,
Natick, MA, USA).
Machine learning. The machine learning framework was designed with the objective of classifying afferent
and efferent ENG signals. Specific data sets were used to build a classifier that could categorize purely efferent
and afferent waveforms (refer to Table 2). The procedure of windowing and labelling of the data was repeated
for multiple obstructions, from which we sampled a total of 380,800 labelled spikes. A total of 190,400 afferent
signals (recorded while only the proximal end of VN was transected) and 190,400 efferent signals (recorded
while only the distal end of VN was transected) were used for machine learning classification. The algorithm was
trained by using 20 different features related to efferent and afferent signals (Table 3).
Training, validation and testing (non‑obstruction). As shown in Fig. 5, two different machine learning models
were used in this study. In model 1, data from every experiment were concatenated and then randomly separated
into two different groups of training (60% of data) and testing (40% of data) sets. The training set was further
divided into training (85%) and validation (15%) sets. In model 2 (Fig. 5B), data from one randomly chosen
experiment was used for testing, while the remaining data was used for training (85%) and validation (15%).
The rationale for using the 2 different machine learning models was to (1) build an acceptable classifier and (2)
confirm the generality of the classifier by testing with a different set of recording data not previously seen by the
training group (i.e., model 2).
Before training the models with data-split as described above, all the training set (not including the 15%
validation data) of model 1 was used to find a suitable classifier. K-nearest neighbors (KNN) with coarse k ernel26,
boosted tree with adaptive ensemble method (adaptive boosting, Adaboost)27, a neural network (NN) with one
hidden layer and 10 units28, and support vector machine (SVM) with Gaussian kernel23 were all used to perform
classification learning. The accuracy of classifiers was compared using the classification accuracy (e.g., confusion
matrix) and F1-score test. The confusion matrix42, also known as an error matrix provided visualization of the
Scientific Reports | (2021) 11:10682 | https://doi.org/10.1038/s41598-021-89624-3 11
Vol.:(0123456789)www.nature.com/scientificreports/
performance of an algorithm. Each row of the matrix represented the instances in a predicted class while each
column represented the instances in an actual class. The F1-score indicated precision and recall of each classifier.
The classifier with the highest accuracy as well as F 1-score was selected as the main classifier for this analysis.
Considering that model 1 and model 2 are similar in training and only different in the test set data, classification
accuracy and F 1 score of this section was only reported for model 1 to avoid redundancy.
As a part of the training process, the validation set was used to modify the cost function of the classifier to
mitigate any imbalances (e.g., hyper-parameter). The cost function describes the penalty of miss-classification
during the optimization/learning process. Due to the asymmetric learned classifier found in this study (i.e., bias
towards one of the two classes most likely caused by variation in SNR of recording), the validation set was used
to define a weight of miss-classification penalty per class. For both models, a receiver operating characteristic
(ROC), the area under the curve (AUC), and a confusion matrix were computed on the test set to analyze the
performance.
The ROC curve illustrates the performance of the classification model for the case of a binary classification
(i.e. afferent vs efferent) by representing the true positive rate vs. false positive rate for the classifier via the AUC
algorithm. The AUC calculates the performance of the classifier across all classification levels (0 ≤ AUC ≤ 1),
where 1 denotes a model with 100% correct classification predictions. In general, applying an AUC is useful in
showing the effect of each classifier among all the classes. All machine learning processes were done in MATLAB
(Mathworks Inc., Natick, MA, USA).
Testing and validation the algorithm using obstruction data. Both model 1 and model 2 were used to perform
hypothesis testing on the tetrapolar electrode. ENG data obtained during obstructions were provided to both
models for prediction and testing of the classifiers which was then compared to the baseline (pre-obstruction)
ENG data. This obstruction data was tested for cases of intact nerve, proximal transection, and distal transection
(Table 1). It is noted that none of the obstruction ENG data was used in the training process of either model 1 or
model 2. Therefore, this data was considered as a secondary method for classifier testing.
Statistical analysis. All experimental data were summarized as the mean ± SE. A non-parametric test
(Wilcoxon rank sum) was applied to determine statistical significance, where p values < 0.05 were considered
significant. This analysis was performed using MATLAB (Mathworks Inc., Natick, MA, USA).
Received: 10 November 2020; Accepted: 19 April 2021
References
1. Haugland, M., Lickel, A., Haase, J. & Sinkjaer, T. Control of FES thumb force using slip information obtained from the cutaneous
electroneurogram in quadriplegic man. IEEE Trans. Rehabil. Eng. 7(2), 215 (1999).
2. Hansen, M., Haugland, M. K. & Sinkjaer, T. Evaluating robustness of gait event detection based on machine learning and natural
sensors. IEEE Trans. Neural Syst. Rehabil. Eng. 12(1), 81–88 (2004).
3. Tan, D. W., Schiefer, M. A., Keith, M. W., Anderson, J. R. & Tyler, D. J. Stability and selectivity of a chronic, multi-contact cuff
electrode for sensory stimulation in human amputees. J. Neural Eng. 12(2), 026002 (2015).
4. Christie, B. P. et al. ‘Long-term stability of stimulating spiral nerve cuff electrodes on human peripheral nerves’. J. Neuroeng. Rehabil.
14(1), 70 (2017).
5. Raspopovic, S. et al. Bioengineering: Restoring natural sensory feedback in real-time bidirectional hand prostheses. Sci. Transl.
Med. 6(222), 222ra19 (2014).
6. Grill, W. M., Norman, S. E. & Bellamkonda, R. V. Implanted neural interfaces: biochallenges and engineered solutions. Ann. Rev.
Biomed. Eng. 11(1), 1–24 (2009).
7. Nikolic, Z. M., Popovic, D. B., Stein, R. B. & Kenwell, Z. Instrumentation for ENG and EMG recordings in FES systems. IEEE
Trans. Biomed. Eng. 41(7), 703–706 (1994).
8. Stein, R. B. et al. Principles underlying new methods for chronic neural recording. Can. J. Neurol. Sci./J. Can. Des. Sci. Neurol.
2(03), 235–244 (1975).
9. Branner, A., Stein, R. B., Fernandez, E., Aoyagi, Y. & Normann, R. A. Long-term stimulation and recording with a penetrating
microelectrode array in cat sciatic nerve. IEEE Trans. Biomed. Eng. 51(1), 146–157 (2004).
10. Mendez, A., Sawan, M., Minagawa, T. & Wyndaele, J.-J. Estimation of bladder volume from afferent neural activity. IEEE Trans.
Neural Syst. Rehabil. Eng. 21(5), 704–715 (2013).
11. Johnson, R. L., & Wilson, C. G. A review of vagus nerve stimulation as a therapeutic intervention. J. Inflamm. Res. 11, 203–213
(2018).
12. Harreby, K. R., Cristian, B., Bullet, S. & Struijk, J. J. Early seizure detection in rats based on vagus nerve activity. Med. Biol. Eng.
Comput. 49(2), 143–151 (2011).
13. Nielsen, T. N., Struijk, J. J., Harreby, K. R. & Sevcencu, C. Early Detection of Epileptic Seizures in Pigs Based on Vagus Nerve Activity
43–47 (Springer, 2013).
14. Sevcencu, C., Nielsen, T. N., Kjaergaard, B. & Struijk, J. J. A Respiratory marker derived from left vagus nerve signals recorded
with implantable cuff electrodes. Neuromodul. Technol. Neural Interface 21(3), 269–275 (2018).
15. Jiman, A. et al. Multi-channel intraneural vagus nerve recordings with a novel high-density carbon fiber microelectrode array. Sci.
Rep. 15501 (2020).
16. Schuettler, M., Donaldson, N., Seetohul, V. & Taylor, J. Fibre-selective recording from the peripheral nerves of frogs using a multi-
electrode cuff. J. Neural Eng. 10(3), 036016 (2013).
17. Schuettler, M., Seetohul, V., Rijkhoff, N. J. M., Moeller, F. V., Donaldson, N. & Taylor, J. Fibre-selective recording from peripheral
nerves using a multiple-contact cuff: Report on pilot pig experiments. In Proceedings of the Annual International Conference of the
IEEE Engineering in Medicine and Biology Society, EMBS 3103–3106 (2011).
18. Metcalfe, B. W. et al. First demonstration of velocity selective recording from the pig vagus using a nerve cuff shows respiration
afferents. Biomed. Eng. Lett. 8(1), 127–136 (2018).
19. Koh, R. G. L., Nachman, A. I. & Zariffa, J. Classification of naturally evoked compound action potentials in peripheral nerve
spatiotemporal recordings. Sci. Rep. 9(1), 1–13 (2019).
Scientific Reports | (2021) 11:10682 | https://doi.org/10.1038/s41598-021-89624-3 12
Vol:.(1234567890)www.nature.com/scientificreports/
20. Koh, R. G. L., Balas, M., Nachman, A. & Zariffa, J. Selective peripheral nerve recordings from nerve cuff electrodes using convo-
lutional neural networks. J. Neural Eng. 17(1), 016042 (2019).
21. Sabetian, P. & Yoo, P. B. Feasibility of differentially measuring afferent and efferent neural activity with a single nerve cuff electrode.
J. Neural Eng. 17(1), 016040 (2019).
22. Tadjalli, A., Duffin, J. & Peever, J. Identification of a novel form of noradrenergic-dependent respiratory motor plasticity triggered
by vagal feedback. J. Neurosci. 30(50), 16886–16895 (2010).
23. Christianini, N. & Shawe-Taylor, J. An introduction to support vector machines and other kernel-based learning methods. Robotica
18(6), 687–689 (2000).
24. Homma, S., Yamazaki, Y. & Karakida, T. Blood pressure and heart rate relationships during cervical sympathetic and vagus nerve
stimulation in streptozotocin diabetic rats. Brain Res. 629(2), 342–344 (1993).
25. de Burgh Daly, M. & Evans, D. H. L. Functional and histological changes in the vagus nerve of the cat after degenerative section
at various levels. J. Physiol. 120(4), 579–595 (1953).
26. Altman, N. S. An introduction to kernel and nearest-neighbor nonparametric regression. Am. Stat. 46(3), 175–185 (1992).
27. Freund, Y. & Schapire, R. E. A decision-theoretic generalization of on-line learning and an application to boosting. J. Comput. Syst.
Sci. 55(1), 119–139 (1997).
28. Ballabio, D. & Vasighi, M. A MATLAB toolbox for self organizing maps and supervised neural network learning strategies.
Chemom. Intell. Lab. Syst. 118, 24–32 (2012).
29. Taylor, J., Donaldson, N. & Winter, J. Multiple-electrode nerve cuffs for low-velocity and velocity-selective neural recording. Med.
Biol. Eng. Comput. 42(5), 634–643 (2004).
30. Zariffa, J. et al. Use of an experimentally derived leadfield in the peripheral nerve pathway discrimination problem. IEEE Trans.
Neural Syst. Rehabil. Eng. 19(2), 147–156 (2011).
31. Garai, P., Koh, R. G. L., Schuettler, M., Stieglitz, T. & Zariffa, J. Influence of anatomical detail and tissue conductivity variations in
simulations of multi-contact nerve cuff recordings. IEEE Trans. Neural Syst. Rehabil. Eng. 25(9), 1653–1662 (2017).
32. Metcalfe, B. W. et al. A new method for spike extraction using velocity selective recording demonstrated with physiological ENG
in Rat”. J. Neurosci. Methods 251, 47–55 (2015).
33. Wodlinger, B. & Durand, D. M. Selective recovery of fascicular activity in peripheral nerves. J. Neural Eng. 8(5), 056005 (2011).
34. Tang, Y., Wodlinger, B. & Durand, D. M. Bayesian spatial filters for source signal extraction: a study in the peripheral nerve. IEEE
Trans. Neural Syst. Rehabil. Eng. 22(2), 302–311 (2014).
35. Dweiri, Y. M. et al. Stable detection of movement intent from peripheral nerves: chronic study in dogs. Proc. IEEE 105(1), 50–65
(2017).
36. Plachta, D. T. T. et al. Blood pressure control with selective vagal nerve stimulation and minimal side effects. J. Neural Eng. 11(3),
036011 (2014).
37. Gierthmuehlen, M. & Plachta, D. T. T. Effect of selective vagal nerve stimulation on blood pressure, heart rate and respiratory rate
in rats under metoprolol medication. Hypertens. Res. 39(2), 79–87 (2016).
38. Sevcencu, C., Nielsen, T. N. & Struijk, J. J. A blood pressure-related profile extracted from pig left vagus nerves using cuff electrodes.
Biosyst. Biorobot. 7, 717–723 (2014).
39. Sabetian, P., Sadeghlo, B., Zhang, C. H. & Yoo, P. B. Characterizing the reduction of stimulation artifact noise in a tripolar nerve
cuff electrode by application of a conductive shield layer. Med. Eng. Phys. 40, 39–46 (2017).
40. Howell, D. C., Rogier, M., Yzerbyt, V. & Bestgen, Y. Statistical methods in human sciences. New York Wadsworth 721 (1998).
41. Caesarendra, W. & Tjahjowidodo, T. A review of feature extraction methods in vibration-based condition monitoring and its
application for degradation trend estimation of low-speed slew bearing. Machines 5(4), 21 (2017).
42. Stehman, S. V. Selecting and interpreting measures of thematic classification accuracy. Remote Sens. Environ. 62 77–89 (1997).
Acknowledgements
Financial support was provided by the Natural Sciences and Engineering Research Council of Canada (NSERC
Discovery Grant, 06519) and the Canadian Foundation for Innovation (John R. Evans Leaders Fund, 31506).
The work presented in this article is based on the PhD dissertation of Dr. Parisa Sabetian titled “Directionally
sensitive low-noise neural recording using tetrapolar nerve cuff electrode”.
Author contributions
P.S. designed the study, conducted experiments, analyzed all data, created all figures, and prepared the manu-
script. Y.S.N. designed the machine learning study, analyzed data, and edited the manuscript. P.B.Y. designed
the study and edited the manuscript. All authors reviewed the manuscript.
Competing interests
The authors declare no competing interests.
Additional information
Correspondence and requests for materials should be addressed to P.B.Y.
Reprints and permissions information is available at www.nature.com/reprints.
Publisher’s note Springer Nature remains neutral with regard to jurisdictional claims in published maps and
institutional affiliations.
Open Access This article is licensed under a Creative Commons Attribution 4.0 International
License, which permits use, sharing, adaptation, distribution and reproduction in any medium or
format, as long as you give appropriate credit to the original author(s) and the source, provide a link to the
Creative Commons licence, and indicate if changes were made. The images or other third party material in this
article are included in the article’s Creative Commons licence, unless indicated otherwise in a credit line to the
material. If material is not included in the article’s Creative Commons licence and your intended use is not
permitted by statutory regulation or exceeds the permitted use, you will need to obtain permission directly from
the copyright holder. To view a copy of this licence, visit http://creativecommons.org/licenses/by/4.0/.
© The Author(s) 2021
Scientific Reports | (2021) 11:10682 | https://doi.org/10.1038/s41598-021-89624-3 13
Vol.:(0123456789)You can also read