Classification Framework for Healthy Hairs and Alopecia Areata: A Machine Learning (ML) Approach
←
→
Page content transcription
If your browser does not render page correctly, please read the page content below
Hindawi
Computational and Mathematical Methods in Medicine
Volume 2021, Article ID 1102083, 10 pages
https://doi.org/10.1155/2021/1102083

Research Article
Classification Framework for Healthy Hairs and Alopecia Areata:
A Machine Learning (ML) Approach

          Choudhary Sobhan Shakeel ,1 Saad Jawaid Khan ,1 Beenish Chaudhry ,2
          Syeda Fatima Aijaz ,1 and Umer Hassan 1
          1
            Department of Biomedical Engineering, Ziauddin University, Faculty of Engineering, Science, Technology and Management,
            Karachi, Pakistan
          2
            School of Computing and Informatics, University of Louisiana at Lafayette, USA

          Correspondence should be addressed to Saad Jawaid Khan; sj.khan@zu.edu.pk

          Received 13 June 2021; Revised 18 July 2021; Accepted 29 July 2021; Published 16 August 2021

          Academic Editor: Iman Yi Liao

          Copyright © 2021 Choudhary Sobhan Shakeel et al. This is an open access article distributed under the Creative Commons
          Attribution License, which permits unrestricted use, distribution, and reproduction in any medium, provided the original work
          is properly cited.

          Alopecia areata is defined as an autoimmune disorder that results in hair loss. The latest worldwide statistics have exhibited
          that alopecia areata has a prevalence of 1 in 1000 and has an incidence of 2%. Machine learning techniques have
          demonstrated potential in different areas of dermatology and may play a significant role in classifying alopecia areata for
          better prediction and diagnosis. We propose a framework pertaining to the classification of healthy hairs and alopecia
          areata. We used 200 images of healthy hairs from the Figaro1k dataset and 68 hair images of alopecia areata from the
          Dermnet dataset to undergo image preprocessing including enhancement and segmentation. This was followed by feature
          extraction including texture, shape, and color. Two classification techniques, i.e., support vector machine (SVM) and k
          -nearest neighbor (KNN), are then applied to train a machine learning model with 70% of the images. The remaining
          image set was used for the testing phase. With a 10-fold cross-validation, the reported accuracies of SVM and KNN are
          91.4% and 88.9%, respectively. Paired sample T-test showed significant differences between the two accuracies with a p <
          0:001. SVM generated higher accuracy (91.4%) as compared to KNN (88.9%). The findings of our study demonstrate
          potential for better prediction in the field of dermatology.

1. Introduction                                                       tions of these diagnostic methods are the uncertainty sur-
                                                                      rounding the number of tests required for adequate
The “falling of scalp hairs in sufficient quantity” is defined as        diagnosis. Hence, there is a vast scope for researching new
hair loss [1]. Alopecia areata is an autoimmune disorder that         techniques pertaining to the classification and diagnosis of
involves nonscarring hair loss in well-defined patches that            alopecia areata [6].
can affect the entire scalp region and, ultimately, lead to bald-          Machine learning (ML) techniques have shown effective-
ness [2, 3]. The disorder impacts millions of people world-           ness in the prediction and classification of various diseases
wide [4], especially those with a family history of alopecia          and disorders. Machine learning encapsulates the study of
areata [5]. It begins when the body’s autoimmune system               different computer algorithms that exhibit the potential to
starts to target the hair follicles, disturbing their normal func-    learn and adapt [7]. Machine learning (ML) algorithms and
tioning and preventing subsequent hair growth. The out-               their advanced versions have been incorporated in various
come is hair loss. Hair loss can be attributed to various             medical disciplines for diagnostic purposes. For instance,
causes, and trichoscopies and biopsies are generally necessary        machine learning (ML) techniques have exhibited accurate
to ensure the cause is alopecia areata. However, the limita-          results using magnetic resonance imaging (MRI) and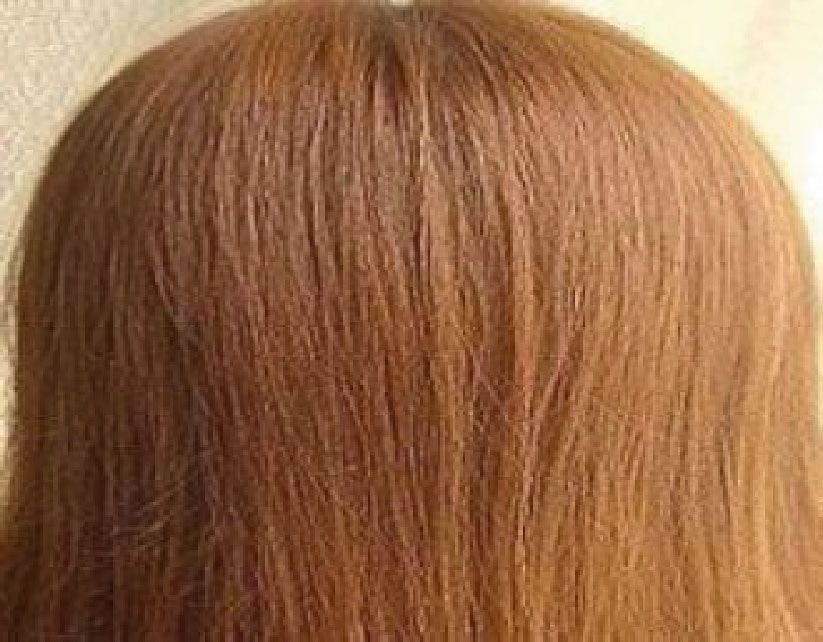
2                                                                     Computational and Mathematical Methods in Medicine

computed tomography (CT) images for the diagnosis of              pants, and the results of the study exhibited that artificial
brain tumors, breast cancer, ovarian cancer, pulmonary dis-       neural networks can be utilized for detecting hair loss [22].
ease, and dermatological diseases [8–12]. Machine learning        Shih [23] captured forty microscopic scalp images with a
(ML) techniques have also shown their credibility during          magnification factor of eighty-five to propose a hair counting
the COVID-19 pandemic and have aided medical profes-              algorithm involving features such as density, diameter,
sionals in identifying the coronavirus disease along with its     length, and hair oiliness level. The algorithm was observed
levels [13].                                                      to be more accurate than the traditional Hough-based one
    In dermatology, effective diagnosis and prediction have        and was more reliable in counting hairs on an individual’s
been achieved by different machine learning methods. Scalp         scalp as compared to manual counting.
analysis systems have been developed utilizing SVM and                Researchers have also used scalp images to develop
KNN to classify scalp images. Scalp images have been used         machine learning models for diagnosing different diseases.
for classification of conditions such as dandruff with the          An intelligent scalp analysis system was proposed employing
employment of machine learning techniques of SVM,                 different machine learning methods such as SVM, linear dis-
KNN, and decision trees [14–20]. All these techniques use         criminant analysis (LDA), KNN, and decision trees. Classifi-
scalp and/or skin images to develop prediction models. To         cation was carried out between two groups, namely, bacteria
the best of our knowledge, so far, none of the machine learn-     1 that pertains to blisters or boils in the scalp and bacteria 2
ing techniques has been applied on human hair images.             that comprises of scalp skin exhibiting red spots. The highest
    In this paper, we propose a framework that encapsulates       accuracy of 80% was achieved with the application of SVM
practical application in effectively classifying alopecia areata   [18]. Another scalp analysis system used optical coherence
and healthy hairs using hair images as previous work has          tomography (OCT) and machine learning to identify fungal
been carried out with scalp and skin images only. Our pro-        infection. A-line features comprising of attenuation coeffi-
posal demonstrates the practical application of machine           cient values and B-scan features involving texture parameters
learning techniques for distinguishing alopecia areata. The       such as energy, kurtosis, and skewness were extracted from
results from our study exhibit the future potential of this       the captured scalp images. Classification was carried out
framework to distinguish hair disorders that cannot be deter-     between nondandruff and dandruff scalps with the applica-
mined by the naked eye.                                           tion of machine learning algorithms including decision tree,
                                                                  SVM, neural network, and extreme learning machine
2. Related Works                                                  (ELM). The highest accuracy of 87.5% was acquired via
                                                                  SVM followed by neural network, decision tree, and ELM
Most researchers have used scalp images to extract skin fea-      with 83.3%, 79.16%, and 75.23% accuracies, respectively
tures characteristic of alopecia areata. A trichoscopy method     [19]. A webcam and microscope camera sensor system was
was proposed that involved extraction of hair loss feature by     proposed for executing a hair and scalp analysis with refer-
processing of scalp images using encapsulated techniques          ence to the Norwood-Hamilton scale. K-means clustering
such as grid line selection and eigenvalue. The system was        was applied, and the level of baldness was determined. The
novel in terms of using a combination of computer vision          results exhibited accuracy in the range of 71% to 84% for dif-
and image processing techniques for alopecia areata diagno-       ferent circumstances such as oily scalp, swollen/red scalp,
sis [14]. In another study, an automated classification            and dry scalp [20].
method for the early diagnosis and treatment of alopecia              The literature review demonstrates that no work has been
was proposed using artificial neural networks (ANN). The           done with hair images for identification of alopecia areata
system used a feedforward artificial neural network, and the       (hair disorder). Previous work has been carried out with der-
results exhibited an accuracy of 91% [15]. In another work,       moscopic and scalp images. Similar image preprocessing
scalp images were classified according to three scalp condi-       steps were used in [16]; however, the study made use of scalp
tions namely, alopecia areata, dandruff, and normal hair.          images and applied only SVM with 85% accuracy. Further-
The classification yielded an accuracy of 85% [16]. In another     more, feature extraction techniques were also different in
study, texture analysis was executed on scalp images using        [16] as compared to our proposed framework. Hence, our
Severity of Alopecia Tool (SALT) score. The proposed system       work demonstrates a novel and innovative framework for
permitted analysis of hair density changes exhibited in alope-    classifying alopecia areata using color, texture, and shape as
cia areata [17].                                                  features and SVM and KNN as classification algorithms.
    Other systems have used scalp images to analyze hair
density and loss that manifest due to various reasons, includ-
ing alopecia areata. A system referred to as TrichoScan was       3. Materials and Methods
developed using epiluminescence microscopy to analyze hair        3.1. Datasets
cover in scalp images of people with androgenic alopecia
(AGA). Four parameters, namely, hair density, hair diameter,      3.1.1. Healthy Hair Image Dataset. A total of 200 healthy hair
hair growth rate, and anagen/telogen ratio, were extracted,       images have been retrieved from the Figaro1k dataset. Fig-
and the results reported a correlation of approximately 91%       aro1k is a publicly available dataset containing different clas-
[21]. In another system, hair loss was diagnosed via the appli-   ses of hair images such as straight, wavy, and curly [24]. A
cation of artificial neural networks (ANNs). Scalp images          normalization procedure has been applied on the dataset to
were acquired from three hundred and forty-eight partici-         ensure that the size and the aspect ratio of every image are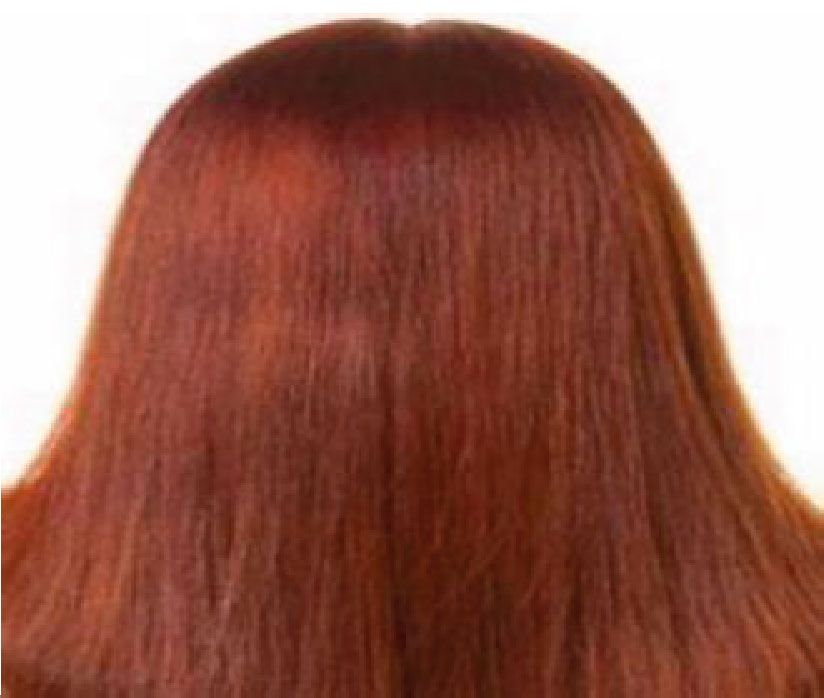
Computational and Mathematical Methods in Medicine                                                        3

                            Table 1: Sample input images of alopecia areata and healthy hairs.

Classes                                                                                          Images

Alopecia areata

Healthy hair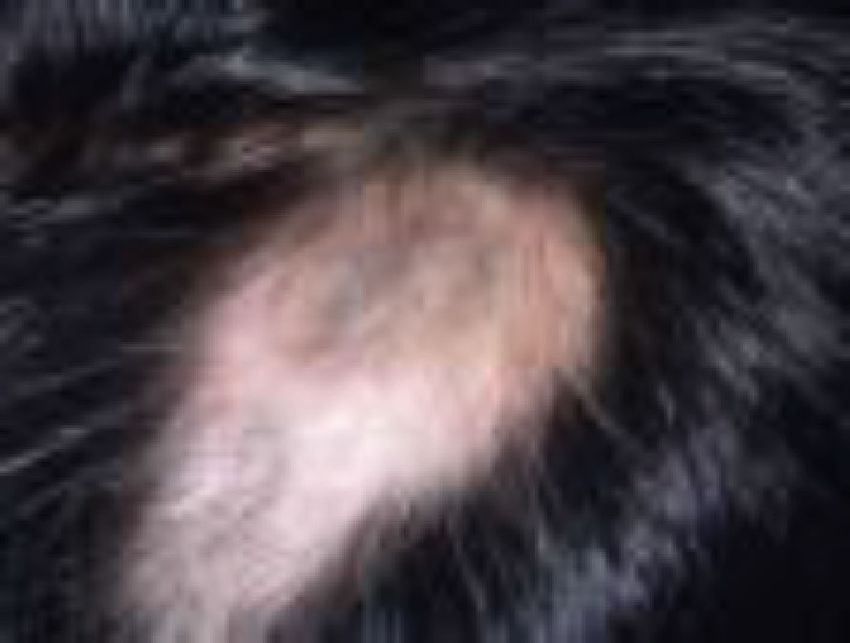
4                                                                      Computational and Mathematical Methods in Medicine

                                                       Table 1: Continued.

Classes                                                                                          Images

the same [24]. Table 1 lists a few healthy hair images from the   3.2. Proposed Framework with SVM and KNN. To ensure that
Figaro1k dataset that have been utilized in this study.           our data comprising the sample input images is organized
                                                                  and error-free, the dataframe function from Pandas Python
3.1.2. Alopecia Areata Image Dataset. A total of 68 hair          Library is utilized to eliminate unwanted rows and columns
images of alopecia areata are retrieved from the Dermnet          and to clean the images. The code is written using Python
dataset. The dataset available on Dermnet comprises of            on a Linux workstation utilizing the TensorFlow package
twenty-three categories of dermatological diseases, including     with NVidia Titan GPU. The classification technique is exe-
alopecia areata [25]. Another type of disease images includes     cuted with the aid of two machine learning methods, support
that of eczema, seborrheic keratoses, tinea ringworm, bullous     vector machine (SVM) and k-nearest neighbor (KNN). The
disease, poison ivy, and psoriasis [25]. Table 1 illustrates a    proposed flow process of the classification framework is
few alopecia areata images that we utilized.                      exhibited in Figure 1. It starts initially with the input sample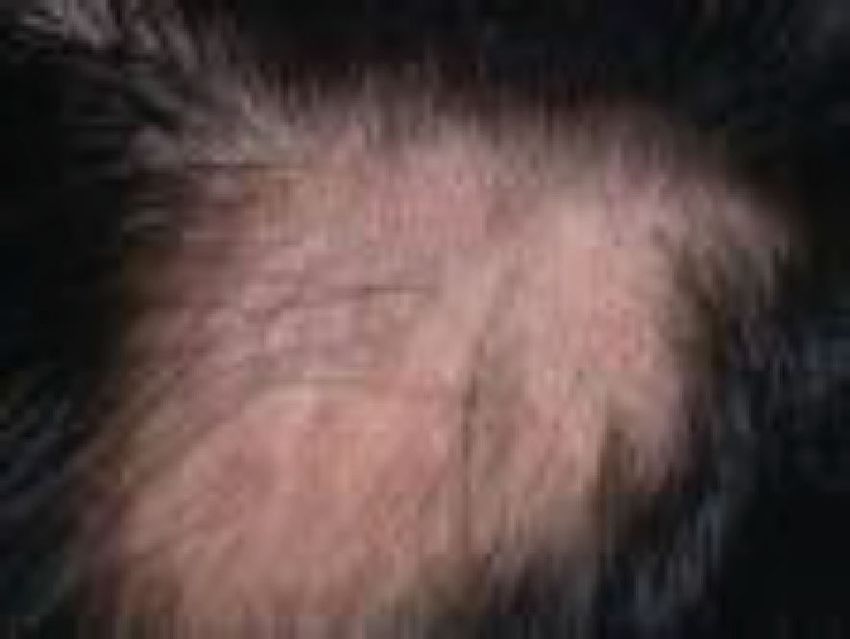
Computational and Mathematical Methods in Medicine                                                                                      5

                                                                   Start

                                                          Healthy hairs image and
                                                           alopecia areata image

                                                            Image enhancement

                                                             Enhanced image

                                                          Image segmentation and
                                                              edge detection

                           Texture feature                      Segmented                       Color feature
                             extraction                           image                          extraction

                                                               Shape feature
                                                                 extraction

                                Texture                             Shape                           Color

                                                                 Classification

                                    Classified alopecia                                    Classified healthy
                                       areata image                                           hairs image

                                                                           End

                                  Figure 1: Proposed flow process of the classification framework.

images of healthy hairs and alopecia areata. This is followed              classification of an image into alopecia areata (class 0) or
by image enhancement process that permits getting rid of                   healthy hairs (class 1).
any unwanted deformation in the images. Following image
enhancement, image segmentation and edge detection are                     3.3. Image Preprocessing
carried out. Furthermore, three features, namely, color, tex-
ture, and shape, are extracted, and the classification process              3.3.1. Image Enhancement. The technique of image enhance-
is executed. Empirical studies represent that more reliable                ment relates to improving the contrast, brightness, and the
results can be acquired if 20-30% of data is used for testing              pixel luminance values [27]. In this study, the sklearn.prepro-
and 70-80% for training [26]. Hence, in this study, 70% of                 cessing library part of scikit-image processing that involves a
the images have been used for model training and the                       vast array of techniques for image enhancement and image
remaining 30% are utilized for testing. The end result is the              segmentation has been employed. The technique pertaining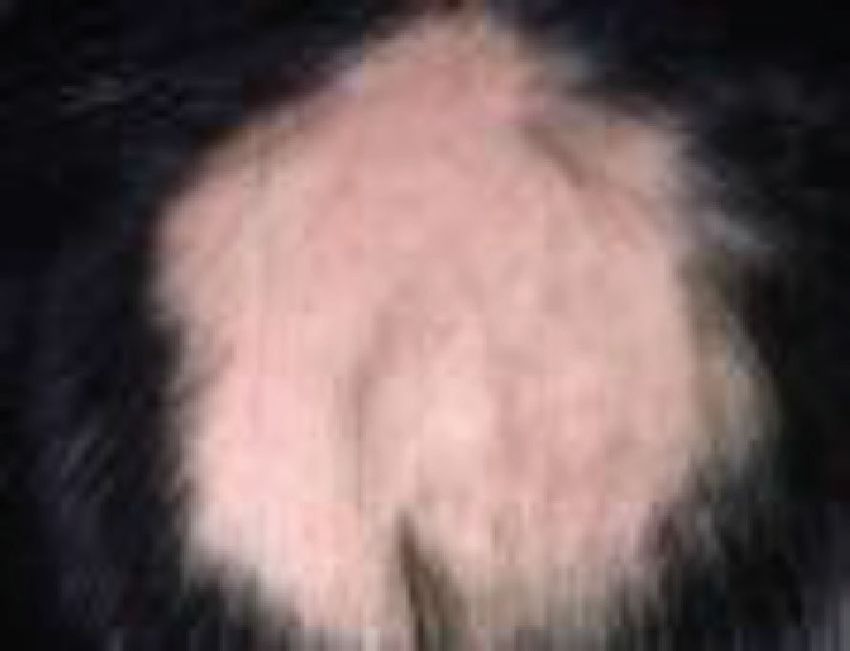
6 Computational and Mathematical Methods in Medicine
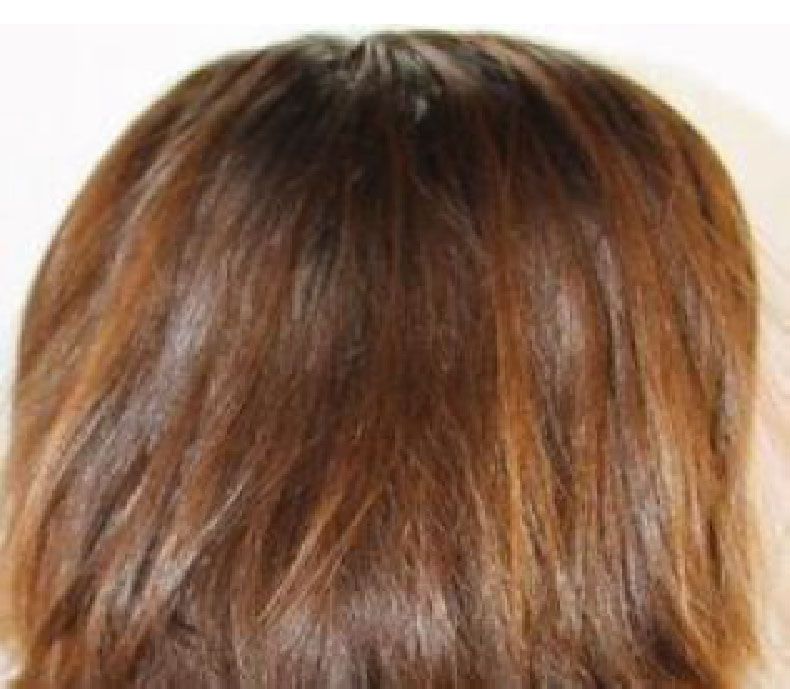
to histogram equalization is used to enhance the sample Before HE After HE
input images. Histogram equalization (HE) tends to improve
areas of lower local contrast and enhances the intensities that
ultimately lead to increase in the global contrast of the sample
input images [28]. In our study, histogram equalization (HE)
is executed by converting the RGB image into an equivalent
hue-saturation-value (HSV) image format. Histogram equal-
ized intensity matrix is produced, and the image is enhanced. Figure 2: Sample outcomes of HE for alopecia areata.
This is exhibited by Figures 2 and 3 demonstrating the sam-
ple image of alopecia areata and healthy hair before and after as specified in the following equation:
histogram equalization, respectively.
p−1
3.3.2. Image Segmentation and Edge Detection. The image LBPðgpx, gpyÞ = 〠 Sðgp − gcÞ × 2p : ð1Þ
p=0
segmentation operation pertains to dividing the constituents
of an image into desired fragments or sections that have sim-
ilar features like texture, intensity, and pixel values [29]. In The function S can be expressed as
this study, image segmentation has been carried out via the ( )
resize operation and edge detection. The resize operation 1 if x ≥ 0
S ðx Þ = : ð2Þ
resizes an image by a given scaling factor or dimension. In 0 if x < 0
this study, the resize dimension was set to 64; hence, a seg-
mented output image with a dimension factor of 64 was gen- 3.4.3. Shape Feature. The OpenCV library of Python that has
erated. A major technique of image segmentation is edge been imported in our study utilizes Hu moment shape
detection. Edge detection is used to identify curves in an descriptor to extract the shape feature, where h denotes the
image that follow a path pertaining to rapid change in the computed Hu moment and η represents the normalized cen-
intensity of the image [30]. In this study, the antialiasing tral moment. The Hu moment shape descriptor is exhibited
technique in relation to edge detection and as part of the in Equation (3) and Equation (4). Central moment is
scikit-image processing library of Python has been utilized. involved in the computation of Hu moments as they shift
The antialiasing operation is set to true to denote that the the center of the image to the centroid region. Furthermore,
rough edges in the images are smoothened. Figures 4 and 5 Hu moments incorporating central moments tend to be
show sample images of alopecia areata and healthy hair invariant to translation, scale, and rotation that help in the
before and after edge detection, respectively. extraction of the shape feature. Hu moments are able to
extract shape features by quantifying the outline of the sam-
3.4. Feature Extraction. Our study involves the extraction of ple input images thus yielding the NumPy array form of the
three features of color, texture, and shape from each input images. Finally, the flatten operation flattens the NumPy
sample image. The libraries of Python used for color, shape, array to produce the shape feature vector.
and texture feature extraction include cv2 and skimage.
hO = η2O + ηO2 , ð3Þ
3.4.1. Color Feature. In this study, the images have been con-
verted to a NumPy array involving a list of color pixel values h1 = ðη2O − ηO2 Þ2 + 4η211 : ð4Þ
of RGB. The cv2 library is used to compute the mean of each
of the three color channels including red, green, and blue. 3.5. Classification. In this study, support vector machine
The first mean value that the cv2 library generates is of the (SVM) and k-nearest neighbor (KNN) have been utilized
blue channel, the second is of the green channel, and the for classifying healthy and alopecia areatahair images into
third relates to the red channel. The cv2 library stores RGB their accurate classes. Figure 6 depicts the architecture of
images as NumPy array in a reverse order; hence, the first our framework, including the training and testing phases.
value corresponds to the blue channel, the second to the The initial steps in the framework are concerned with image
green channel, and the third value to the red channel. preprocessing and feature extraction. This is followed by
model training with machine learning algorithms and then
3.4.2. Texture Feature. As part of this study, the skimage execution of the testing phase.
library and the cv2 library of Python have been imported to 3.6. Mathematical Operations of Classifiers
exploit scikit’s image processing capability. Local Binary Pat-
terns (LBPs) are employed as texture descriptors to compute 3.6.1. Mathematical Operations of SVM. Support vector
the local representation of the texture feature. The local rep- machine (SVM) determines the linear and nonlinear separa-
resentation that aids in extracting the texture feature is con- bility with the aid of a hyperplane [31]. Its kernel method
structed by comparing each pixel of the image with its transforms two-dimensional nonlinearly separable data into
surrounding neighborhood of pixels. The texture is extracted higher dimensions that yield the optimal hyperplane to sep-
using LBPs, where gc is the intensity value of the central pixel arate the data [32]. The kernel trick employs the multiplica-
and gp is the intensity of the neighboring pixel with index p tion of a kernel function k with the dot product xi · x j as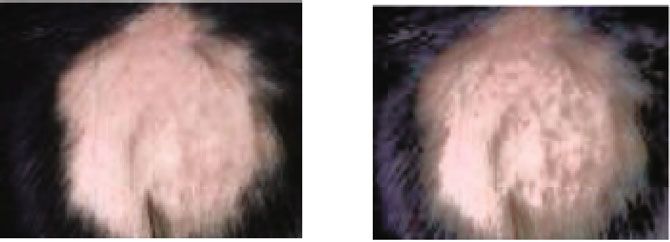
Computational and Mathematical Methods in Medicine                                                                                              7

            Before HE                                 After HE                  via Statistical Package for Social Sciences (SPSS), IBM SPSS
                                                                                Statistics for Windows, Version 22.0. Armonk, NY: IBM
                                                                                Corp., on the accuracies generated from both SVM and
                                                                                KNN. The number of accuracy samples for both the algo-
                                                                                rithms was thirty.

                                                                                4. Results and Evaluation
       Figure 3: Sample outcomes of HE for healthy hair.                        4.1. Performance Evaluation. The performance evaluation of
                                                                                support vector machine (SVM) and k-nearest neighbor
          Original image                          Edge detection                (KNN) is evaluated using confusion matrices. The confusion
                                                                                matrix exhibited in Figure 7 demonstrates the predicted out-
                                                                                comes for the two classes. The two classes, alopecia areata
                                                                                and healthy hairs, have been denoted by 0 and 1, respectively.
                                                                                When the actual value is 1 and the predicted value is also 1,
                                                                                then the outcome is true positive (TP); otherwise, the out-
                                                                                come is false negative (FN). On the contrary, when the actual
Figure 4: Sample outcomes of edge detection for alopecia areata.                value is 0 and the predicted value is also 0, then the outcome
                                                                                is true negative (TN); otherwise, false positive (FP) is
        Original image                             Edge detection               generated.
                                                                                    Figure 8 exhibits the confusion matrix formulated after
                                                                                application of support vector machine (SVM) and represents
                                                                                that out of the 81 images tested, 74 images were classified
                                                                                accurately, thus yielding an accuracy of 91.4%. 22 images
                                                                                were classified as alopecia areata, and 52 images were classi-
                                                                                fied as healthy hairs.
                                                                                    Figure 9 exhibits the confusion matrix generated after the
  Figure 5: Sample outcomes of edge detection for healthy hair.                 application of k-nearest neighbor (KNN) and shows that out
                                                                                of the total 81 images tested, 72 images were classified accu-
represented by                                                                  rately, thus yielding an accuracy of 88.9%. 24 images were
                                                                                classified as alopecia areata, and 48 images were classified
                 m
                           1m m                                               as healthy hairs. The reported accuracies were achieved after
           max 〠 ∝i −        〠 〠 ∝i ∝ j y i y j K x i · x j :             ð5Þ   10-fold cross-validation.
            ∝              2 i=1 j=1
                 i=1                                                                The performance and classification results for SVM and
                                                                                KNN are shown in Table 2. The accuracy for both SVM
    In this study, the radial basis function (RBF) has been                     and KNN can be calculated by dividing the number of truly
used as the kernel function. It is also referred to as the Gauss-               classified images by the total number of test images and mul-
ian kernel and contains a parameter γ as shown in the follow-                   tiplying the result with 100 as expressed in the following
ing equation:                                                                   equation:
                                         2
                K xi :x j = exp −γkxi − x j  :                           ð6Þ             Accuracy =
                                                                                                             TP + TN
                                                                                                                          × 100%:             ð8Þ
                                                                                                        FP + FN + TP + TN
3.6.2. Mathematical Operations of KNN. The k-nearest                               Equation (9) demonstrates the results obtained via SPSS
neighbor algorithm pertains to finding the nearest neighbors.                    analysis.
The process involves finding the nearest point that lies close
to the input point in a given dataset [33]. In this study, the                                         t ð29Þ = 4:744,
neighbors are specified as three which denotes that for every                                                                                  ð9Þ
new input data, the three closest neighbors will be evaluated                                             p < 0:001:
for classification. The algorithm initially analyzes the Euclid-
ean distance that transforms data points into mathematical                      4.2. Performance Metrics. The sklearn library in Python helps
values.                                                                         to compute the true positives and false positives and true neg-
    The Euclidean distance formula in Equation (7) finds the                     atives and false negatives [34]. Classification techniques
distance between two points in a plane with coordinates (x, y)                  encapsulate classification metrics, namely, precision, recall,
and (a, b).                                                                     and F1 score. Precision relates to the ability of a classifier to
                                                                                be precise, i.e., its capacity to not to mark a positive circum-
                                   qffiffiffiffiffiffiffiffiffiffiffiffiffiffiffiffiffiffiffiffiffiffiffiffiffiffiffiffiffiffiffiffiffiffiffi         stance that is actually negative. Recall is the ability of a clas-
          distððx, yÞ, ða, bÞÞ =    ðx − aÞ2 + ðy − bÞ2 :                 ð7Þ   sifier to identify all the true positives. Recall can be defined
                                                                                for each class as the ratio of true positives to the summation
3.7. SPSS Analysis. The paired sample T-test was performed                      of true positives and false negatives [35]. F1 score can be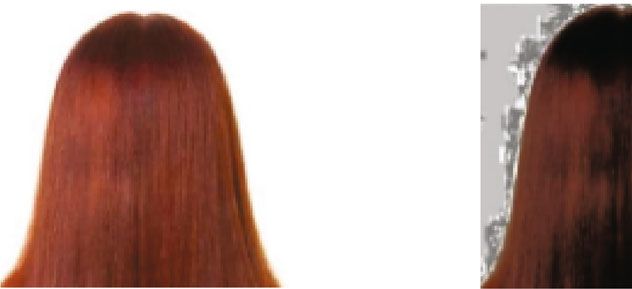
8 Computational and Mathematical Methods in Medicine
Hair image
(Alopecia areata)
Image ML
Color, texture
enhancement, algorithms Training Testing phase
Image Feature and shape Trained
segmentation applied phase with with 30% of
preprocessing extraction features model
Hair image and edge including SVM 70% of data data
extracted
(Healthy hair) detection and KNN
Alopecia Output:
Healthy hair
areata classified
(Class 1)
(Class 0) image
Figure 6: Architecture of the proposed framework. Top left: sample input images of alopecia areata and healthy hairs. Turquoise block: image
preprocessing. Orange block: color, texture, and shape feature extraction. Purple block: SVM and KNN application. Green block: training
phase. Pink block: testing phase.
and are represented in Table 3.
TP
TN FN Precision = × 100%, ð10Þ
0
TP + FP
Actual
TP
Recall = × 100%, ð11Þ
TP + FN
FP TP
2 ∗ precision ∗ recall
1
F1 score = × 100%: ð12Þ
precision + recall
0 1 5. Discussion
Predicted
5.1. Principal Findings. The objectives of this study were to
Figure 7: Confusion matrix. extract the color, texture, and shape features from healthy
and alopecia areata hair images and apply machine learning
Confusion MATRIX-SVM algorithms including support vector machine (SVM) and k
-nearest neighbor (KNN) to execute classification of the
images. SVM can classify linear and nonlinear data by gener-
ating a line or a hyperplane [31]. The RBF kernel method
22 2
0
employed in our study aids to transform the data that yields
the optimal hyperplane and in turn generates higher accu-
Actual
racy. On the contrary, KNN uses the Euclidean distance
function to compute the probability of the test inputs that
are closer to the data points [36]. Our study demonstrates
5 52 better performance of SVM as compared to KNN when clas-
1
sifying hair images into healthy versus alopecia areata.
Other systems that have used the same machine learning
0 1 techniques have also shown higher accuracies. For example, a
Predicted skin lesion classification system based on support vector
machine (SVM) and k-nearest neighbor (KNN) resulted in
Figure 8: Confusion matrix of SVM illustrating the classified the accuracies of 89.50% and 82.00% for support vector
images of both alopecia areata (class 0) and healthy hairs (class 1). machine (SVM) and k-nearest neighbor, respectively [37].
In another study, dermoscopic images were utilized for the
classification of skin cancer using support vector machine
defined as a score that exhibits the relationship between pre- (SVM), k-nearest neighbor (KNN), and random forest. The
cision and recall [35]. In order to evaluate and analyze the results demonstrated that support vector machine (SVM)
effectiveness of the classification framework, the perfor- performed better than the other two classifiers [38]. Better
mance metrics shown in Equations (10), (11), and (12) performance of support vector machine (SVM) lies in its
including precision, recall, and F1 score were employed, mathematical operations. Hence, it can be deduced that the
where TP is true positive, TN is true negative, FP is false pos- higher accuracy of 91.4% by support vector machine (SVM)
itive, and FN is false negative. The values of these perfor- is due to the use of kernel function that transforms the data
mance metrics have been computed as per their formulas into higher dimensions and yields the optimal hyperplane.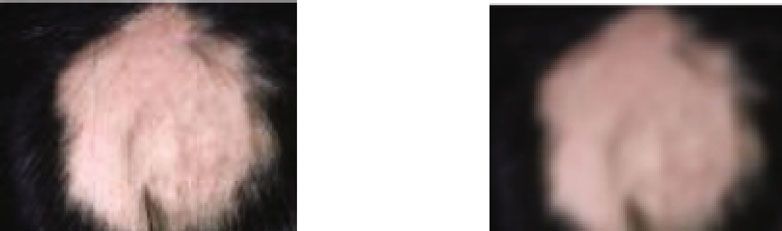
Computational and Mathematical Methods in Medicine                                                                                                      9

                               Confusion MATRIX-KNN                                 (SVM) and k-nearest neighbor (KNN) presented an accuracy
                                                                                    of 91.4% and 88.9%, respectively. These accuracies exhibit
                                                                                    that the proposed classification framework has been found
                       0         24                    0
                                                                                    to be successful and robust in classifying two different sets
                                                                                    of hair images. However, future work with deep learning
                                                                                    techniques such as convolutional neural networks (CNN)
              Actual

                                                                                    can also be carried out and integrated with the existing
                                                                                    system.

                                 9                    48                            Data Availability
                       1

                                                                                    The datasets used are available at the following links: (1)
                                 0                     1                            http://projects.i-ctm.eu/it/progetto/figaro-1k and (2) https://
                                        Predicted                                   www.kaggle.com/shubhamgoel27/dermnet.
Figure 9: Confusion matrix of KNN illustrating the classified
images of both alopecia areata (class 0) and healthy hairs (class 1).
                                                                                    Conflicts of Interest
                                                                                    The authors have no conflict of interest in this study.
         Table 2: Classification results of SVM and KNN.
                                                                                    References
ML                  Test             TRUE                                  %
                                                       Validation
algorithm          images         classification                         accuracy     [1] N. S. Sadick, “New-generation therapies for the treatment of
SVM                    81                74                10-fold        91.4           hair loss in men,” Dermatologic Clinics, vol. 36, no. 1,
                                                                                         pp. 63–67, 2018.
KNN                    81                72                10-fold        88.9
                                                                                     [2] C. H. Pratt, L. E. King, A. G. Messenger, A. M. Christiano, and
                                                                                         J. P. Sundberg, “Alopecia areata,” Nature Reviews Disease
Table 3: Values of performance metrics including precision, recall,                      Primers, vol. 3, no. 1, pp. 1–17, 2017.
and F1 score for both alopecia areata (class 0) and healthy hair (class              [3] A. A. Alshahrani, R. Al-Tuwaijri, Z. A. Abuoliat, M. Alyabsi,
1).                                                                                      M. I. AlJasser, and R. Alkhodair, “Prevalence and clinical char-
                                                                                         acteristics of alopecia areata at a tertiary care center in Saudi
ML algorithm           Class   Precision (%)        Recall (%)       F1 score (%)        Arabia,” Dermatology Research and Practice, vol. 2020, Article
                                                                                         ID 7194270, 4 pages, 2020.
SVM                     0             81.5            91.7               86.3
                                                                                     [4] A. Sterkens, J. Lambert, and A. Bervoets, “Alopecia areata: a
SVM                     1             96.3            91.2               93.7
                                                                                         review on diagnosis, immunological etiopathogenesis and
KNN                     0             72.7            100                84.2            treatment options,” Clinical and Experimental Medicine,
KNN                     1             100             84.2               91.4            vol. 21, no. 2, pp. 215–230, 2021.
                                                                                     [5] T. Simakou, J. P. Butcher, S. Reid, and F. L. Henriquez, “Alope-
                                                                                         cia areata: a multifactorial autoimmune condition,” Journal of
    The strength of our proposed framework lies in being the                             Autoimmunity, vol. 98, pp. 74–85, 2019.
first of its kind to classify alopecia areata and healthy hairs                       [6] N. Meah, D. Wall, K. York et al., “The alopecia areata consen-
using hair images. The limitation of this study includes                                 sus of experts (ACE) study part II: results of an international
applying machine learning (ML) techniques on a limited                                   expert opinion on diagnosis and laboratory evaluation for alo-
dataset with no clinical data being collected. Nevertheless, it                          pecia areata,” Journal of the American Academy of Dermatol-
has been widely observed that deep learning techniques such                              ogy, vol. 84, no. 6, pp. 1594–1601, 2021.
as convolutional neural network (CNN) tend to generate                               [7] H. Sahli, “An introduction to machine learning,” in TORUS 1–
high accuracies [39]. Furthermore, deep learning applica-                                Toward an Open Resource Using Services: Cloud Computing for
tions do not involve image preprocessing and feature extrac-                             Environmental Data, pp. 61–74, Wiley Online Library, 2020.
tion [39, 40]. An intelligent scalp analysis system was                              [8] G. Mathiyalagan and D. Devaraj, “A machine learning classifi-
proposed employing convolutional neural network (CNN),                                   cation approach based glioma brain tumor detection,” Interna-
                                                                                         tional Journal of Imaging Systems and Technology, vol. 31,
and results exhibited accuracy of 89.77% [18]. Hence, future
                                                                                         pp. 1424–1436, 2021.
work can be carried out using CNN so that even better clas-
                                                                                     [9] A. Saber, M. Sakr, O. M. Abo-Seida, A. Keshk, and H. Chen, “A
sification performance can be achieved.
                                                                                         novel deep-learning model for automatic detection and classi-
                                                                                         fication of breast cancer using the transfer-learning tech-
6. Conclusion                                                                            nique,” IEEE Access, vol. 9, pp. 71194–71209, 2021.
                                                                                    [10] Z. Yue, C. Sun, F. Chen et al., “Machine learning-based LIBS
This study proposed a classification framework for healthy                                spectrum analysis of human blood plasma allows ovarian can-
hairs and alopecia areata using hair images with features                                cer diagnosis,” Biomedical Optics Express, vol. 12, no. 5,
including color, texture, and shape being extracted and sup-                             pp. 2559–2574, 2021.
port vector machine (SVM) and k-nearest neighbor (KNN)                              [11] S. Zhao, P. Wang, A. A. Heidari et al., “Multilevel threshold
being applied. The application of support vector machine                                 image segmentation with diffusion association slime mould
10                                                                           Computational and Mathematical Methods in Medicine

       algorithm and Renyi's entropy for chronic obstructive pulmo-      [26] A. Gholamy, V. Kreinovich, and O. Kosheleva, “Why 70/30 or
       nary disease,” Computers in Biology and Medicine, vol. 134,            80/20 relation between training and testing sets: a pedagogical
       article 104427, 2021.                                                  explanation,” Technical Report: UTEP-CS-18-09, 2018.
[12]   R. Pangti, J. Mathur, V. Chouhan et al., “A machine learning-     [27] P. K. Verma, N. P. Singh, and D. Yadav, “Image enhancement:
       based, decision support, mobile phone application for diagno-          a review,” in Ambient Communications and Computer Sys-
       sis of common dermatological diseases,” Journal of the Euro-           tems, pp. 347–355, Springer, 2020.
       pean Academy of Dermatology and Venereology, vol. 35,             [28] H. Singh, Practical Machine Learning and Image Processing,
       no. 2, pp. 536–545, 2021.                                              Springer, 2019.
[13]   P. Wu, H. Ye, X. Cai et al., “An effective machine learning        [29] A. Bali and S. N. Singh, “A review on the strategies and tech-
       approach for identifying non-severe and severe coronavirus             niques of image segmentation,” in 2015 Fifth International
       disease 2019 patients in a rural Chinese population: the Wen-          Conference on Advanced Computing & Communication Tech-
       zhou retrospective study,” IEEE Access, vol. 9, pp. 45486–             nologies, pp. 113–120, Haryana, India, 2015.
       45503, 2021.
                                                                         [30] S. C. Shekar and D. Ravi, “Image enhancement and compres-
[14]   S. Seo and J. Park, “Trichoscopy of alopecia areata: hair loss         sion using edge detection technique,” International Research
       feature extraction and computation using grid line selection           Journal of Engineering and Technology (IRJET), vol. 4, no. 5,
       and eigenvalue,” Computational and Mathematical Methods                2017.
       in Medicine, vol. 2020, Article ID 6908018, 9 pages, 2020.
                                                                         [31] R. Liao, Support Vector Machines, CSC, 2015.
[15]   I. Kapoor and A. Mishra, “Automated classification method
                                                                         [32] K. Tajima, Y. Hirohashi, E. R. R. Zara, and T. Kato, “Frank-
       for early diagnosis of alopecia using machine learning,” Proce-
                                                                              Wolfe algorithm for learning SVM-type multi-category classi-
       dia Computer Science, vol. 132, pp. 437–443, 2018.
                                                                              fiers,” in Proceedings of the 2021 SIAM International Confer-
[16]   S. Ibrahim, Z. A. Noor Azmy, N. N. Abu Mangshor, N. Sabri,             ence on Data Mining (SDM), pp. 432–440, Philadelphia, PA,
       A. F. Ahmad Fadzil, and Z. Ahmad, “Pre-trained classification           USA, 2021.
       of scalp conditions using image processing,” Indonesian Jour-
                                                                         [33] L.-Y. Hu, M.-W. Huang, S.-W. Ke, and C.-F. Tsai, “The dis-
       nal of Electrical Engineering and Computer Science, vol. 20,
                                                                              tance function effect on k-nearest neighbor classification for
       no. 1, pp. 138–144, 2020.
                                                                              medical datasets,” Springerplus, vol. 5, no. 1, pp. 1–9, 2016.
[17]   E. Bernardis and L. Castelo-Soccio, “Quantifying alopecia
                                                                         [34] R. Garreta and G. Moncecchi, Learning Scikit-Learn: Machine
       areata via texture analysis to automate the salt score computa-
                                                                              Learning in Python, Packt Publishing Ltd, 2013.
       tion,” Journal of Investigative Dermatology Symposium Pro-
       ceedings, vol. 19, no. 1, pp. S34–S40, 2018.                      [35] J. Brownlee, Machine Learning Mastery with Python: Under-
                                                                              stand your Data, Create Accurate Models, and Work Projects
[18]   W.-C. Wang, L.-B. Chen, and W.-J. Chang, “Development and
                                                                              End-to-End, Machine Learning Mastery, 2016.
       experimental evaluation of machine-learning techniques for
       an intelligent hairy scalp detection system,” Applied Sciences,   [36] S. Zhang, “Challenges in KNN classification,” IEEE Transac-
       vol. 8, no. 6, 2018.                                                   tions on Knowledge and Data Engineering, vol. 33, 2021.
[19]   K. Dubey, V. Srivastava, and D. S. Mehta,                         [37] M. Koklu and I. A. Ozkan, “Skin lesion classification using
       “Automatedin vivoidentification of fungal infection on human            machine learning algorithms,” International Journal of Intelli-
       scalp using optical coherence tomography and machine learn-            gent Systems and Applications in Engineering, vol. 4, no. 5,
       ing,” Laser Physics, vol. 28, no. 4, article 045602, 2018.             pp. 285–289, 2017.
[20]   S.-H. Lee and C.-S. Yang, “An intelligent hair and scalp analy-   [38] A. Murugan, S. A. H. Nair, and K. S. Kumar, “Detection of skin
       sis system using camera sensors and Norwood-Hamilton                   cancer using SVM, random forest and kNN classifiers,” Jour-
       model,” International Journal of Innovative Computing Infor-           nal of Medical Systems, vol. 43, no. 8, pp. 1–9, 2019.
       mation and Control, vol. 14, no. 2, pp. 503–518, 2018.            [39] J. Ahmad, H. Farman, and Z. Jan, “Deep learning methods and
[21]   R. Hoffmann, “TrichoScan: a novel tool for the analysis of hair         applications,” in Deep Learning: Convergence to Big Data Ana-
       growth in vivo,” Journal of Investigative Dermatology Sympo-           lytics, pp. 31–42, Springer, 2019.
       sium Proceedings, vol. 8, no. 1, pp. 109–115, 2003.               [40] L. Peng, M. Peng, B. Liao, G. Huang, W. Li, and D. Xie, “The
[22]   A. Esfandiari, K. R. Kalantari, and A. Babaei, “Hair loss diag-        advances and challenges of deep learning application in bio-
       nosis using artificial neural networks,” International Journal          logical big data processing,” Current Bioinformatics, vol. 13,
       of Computer Science Issues (IJCSI), vol. 9, no. 5, 2012.               no. 4, pp. 352–359, 2018.
[23]   H. Shih, “A precise automatic system for the hair assessment in
       hair-care diagnosis applications,” Skin Research and Technol-
       ogy, vol. 21, no. 4, pp. 500–507, 2015.
[24]   M. Svanera, U. R. Muhammad, R. Leonardi, and S. Benini,
       “Figaro, hair detection and segmentation in the wild,” in
       2016 IEEE International Conference on Image Processing
       (ICIP), pp. 933–937, Phoenix, AZ, USA, 2016.
[25]   T. A. Rimi, N. Sultana, and M. F. A. Foysal, “Derm-NN: skin
       diseases detection using convolutional neural network,” in
       2020 4th International Conference on Intelligent Computing
       and Control Systems (ICICCS), pp. 1205–1209, Madurai, India,
       2020.
You can also read