Effect of Gluten Ingestion and FODMAP Restriction on Intestinal Epithelial Integrity in Patients with Irritable Bowel Syndrome and Self-Reported ...
←
→
Page content transcription
If your browser does not render page correctly, please read the page content below
RESEARCH ARTICLE
 www.mnf-journal.com

Effect of Gluten Ingestion and FODMAP Restriction on
Intestinal Epithelial Integrity in Patients with Irritable Bowel
Syndrome and Self-Reported Non-Coeliac Gluten Sensitivity
Mary Ajamian, Gennaro Rosella, Evan D. Newnham, Jessica R. Biesiekierski, Jane G. Muir,
and Peter R. Gibson*

 lack the genetic, immune, and serologi-
 Scope: Since epithelial barrier dysfunction has been associated with gluten cal biomarkers of coeliac disease or wheat
 and fermentable oligosaccharide, disaccharide, monosaccharide, and polyols protein allergy, yet present with similar
 (FODMAPs), the effect of alterations in FODMAP a gluten intake on epithelial symptoms that appear to resolve when
 barrier function in patients with irritable bowel syndrome (IBS) who following a gluten-free diet.[1] In the
 available literature, NCGS is defined by
 self-reported gluten sensitivity. improvement in gastrointestinal symp-
 Methods and results: Circulating concentrations of markers of epithelial toms on a gluten-free diet followed by in-
 injury (syndecan-1 and intestinal fatty acid-binding protein) and bacterial duction of symptoms by gluten when re-
 translocation (lipopolysaccharide-binding protein and soluble CD14) are challenged. Unfortunately, the interpre-
 measured while consuming habitual gluten-free diet and during blinded tation of such studies has been hampered
 by nocebo effects, whereby the frequency,
 challenges with gluten or placebo on a background of low FODMAP intake. In
 and severity of gluten-specific effects in
 33 patients, only syndecan-1 concentrations during their habitual diet are some individuals have been matched
 elevated (median 43 ng mL−1 ) compared with 23 ng mL−1 in 49 healthy by placebo-specific effects in others.[2–6]
 subjects (p < 0.001). On a low FODMAP diet, symptoms are reduced and Whilst there are currently no established
 levels of syndecan-1 (but not other markers) fell by a median 3335% (p < biomarkers of disease, some pathophys-
 0.001) irrespective of whether gluten is present or not. iological insights have been obtained in
 recent studies. A study of an Italian
 Conclusion: Gluten ingestion has no specific effect on epithelial integrity or cohort of patients who fulfilled criteria
 symptoms in this cohort, but reducing FODMAP intake concomitantly for NCGS reported a pattern of elevated
 reduces symptoms and reverses apparent colonic epithelial injury. These markers associated with intestinal bar-
 findings highlight the heterogeneity of populations self-reporting gluten rier dysfunction and microbial transloca-
 sensitivity and implicate FODMAPs in colonic injury in IBS. tion that were distinctive from those as-
 sociated with treated or untreated coeliac
 disease and healthy controls.[7] More-
 over, those with NCGS had a significant
1. Introduction decline in levels in these markers in conjunction with symptom
Non-coeliac gluten sensitivity (NCGS), also called non-coeliac improvement when gluten-containing foods were omitted from
wheat sensitivity, is a controversial diagnosis in which individuals their diet. The results implicated dysregulation at the intestinal
 barrier that may provide clues into pathogenic mechanisms
 underlying NCGS and potential biomarker utility. However,
Dr. M. Ajamian, Dr. G. Rosella, Dr. J. G. Muir, Prof. P. R. Gibson such findings are yet to be reproduced.
Department of Gastroenterology
 In the first randomized controlled re-challenge clinical trial
Monash University and Alfred Health
Melbourne, Victoria 3004, Australia that investigated the effects of carbohydrate-depleted gluten in
E-mail: peter.gibson@monash.edu patients with irritable bowel syndrome (IBS) with self-reported
Dr. E. D. Newnham, Dr. J. R. Biesiekierski[+] , Dr. J. G. Muir, gluten sensitivity, subjects showed no difference in symptom
Prof. P. R. Gibson responses to 7-day dietary challenges featuring high gluten (16 g
Department of Gastroenterology and Hepatology per day), low gluten (2 g per day), or placebo (whey protein
Eastern Health
Victoria 3128, Australia isolate).[8] All participants were adherent to a gluten-free diet
 prior to entering the study, but they were instructed during a
 The ORCID identification number(s) for the author(s) of this article run-in period to reduce the intake of fermentable oligosaccha-
 can be found under https://doi.org/10.1002/mnfr.201901275 rides, disaccharides, monosaccharides and polyols (FODMAPs).
[+] Current address: Department of Dietetics, Nutrition and Sport, La Trobe This measure aimed to avoid the confounding effects of altering
University, Bundoora 3086, Australia FODMAP intake during the challenge periods. All patients im-
DOI: 10.1002/mnfr.201901275 proved their overall symptom level during the run-in period. As

Mol. Nutr. Food Res. 2021, 65, 1901275 1901275 (1 of 8) © 2020 Wiley-VCH GmbH
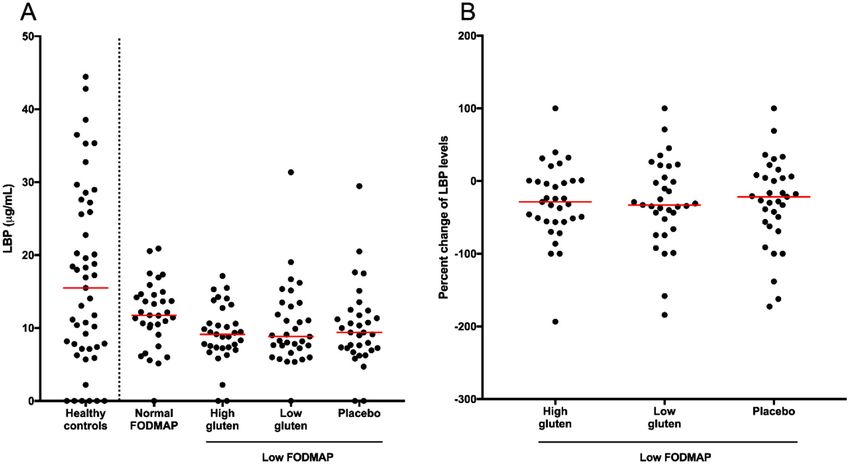
www.advancedsciencenews.com www.mnf-journal.com

Figure 1. Absolute and percent changes of serum syndecan-1 levels in healthy controls and in individuals with IBS and self-reported gluten sensitivity
during the baseline, or normal-FODMAP period, and subsequent high-gluten, low-gluten, and placebo dietary interventions on a background low-
FODMAP diet. A) Serum syndecan-1 levels. Outliers comprising ≈400 ng mL−1 in one subject during the normal-FODMAP intervention, one during the
high-gluten intervention, and two during the low-gluten intervention have been omitted. Significant pairwise comparisons (Wilcoxon test) were found
between normal-FODMAP and high-gluten (p < 0.0001), normal-FODMAP and low-gluten (p = 0.0006), and normal-FODMAP and placebo (p = 0.0001)
interventions. Levels in healthy controls were different from study participants in the normal-FODMAP dietary intervention (p = 0.012; Mann–Whitney
test). B) Percent change in syndecan-1 levels relative to normal-FODMAP period after omitting two outliers showing >300% reduction in the placebo
group; no significant differences were detected in pairwise comparisons. Red bars represent medians. The vertical broken line separates healthy controls
from the experimental cohort.

additional dietary control, patients were provided all their food injury and barrier function in patients with self-reported NCGS
during the interventional periods. Peripheral blood was collected who partook in a randomized, double-blinded, placebo-control,
prior to the run-in period (i.e., after the 1-week observation dose-ranging gluten re-challenge study in which FODMAP in-
period on a gluten-free diet) and during each high gluten, low take was reduced prior to the re-challenges.
gluten, or placebo intervention. Analysis of this cohort provided
an opportunity to assess the biomarkers shown to be abnormal in
the other cohort of patients with NCGS and the effects of gluten. 2. Results
 While reduction of dietary intake of FODMAPs is associated
with alleviation of gastrointestinal symptoms in patients with IBS 2.1. Participants
and in those with self-reported NCGS,[6] there is a body of data
that indicates high intake of non-digestible FODMAPs might 37 subjects completed the interventions. As outlined
have deleterious effects that include impairment of barrier func- elsewhere,[8] the mean age was 45 years (range 24–61 years),
tion, epithelial injury and induction of mucosal inflammation, 31 were female. All fulfilled Rome 3 criteria for IBS. 57% were
and heightening of visceral sensitivity.[9–15] While much of the HLA-DQ2 or DQ8 positive. All were also negative for coeliac
information has been generated from the intake of high doses serology. A complete set of 4 sera were available for 33 patients
in experimental animals, there are also data implicating simi- and these were evaluated in the present study. 49 healthy controls
lar effects in humans. The gluten re-challenge study outlined were recruited. The mean age of this cohort was 39 years (range
above provided the opportunity to determine whether reducing 22–64 years) and 32 were female.
FODMAP intake might influence epithelial integrity and barrier
function using circulating markers associated with epithelial in-
jury in general (syndecan-1),[16] small intestinal epithelial injury 2.2. Syndecan-1
(intestinal fatty acid-binding protein or I-FABP),[17] and bacterial
translocation (human lipopolysaccharide binding protein or LBP, As shown in Figure 1A, healthy controls had a median syndecan-
and human soluble CD14 or sCD14).[7,18] 1 level of 23 ng mL−1 , which was lower than that of the par-
 Hence, we aimed to assess the effect of reducing FODMAP in- ticipants with IBS in the baseline (normal-FODMAP) condition
take and reintroducing gluten on markers of intestinal epithelial at 43 ng mL−1 (p = 0.018; Mann–Whitney test), but similar to

Mol. Nutr. Food Res. 2021, 65, 1901275 1901275 (2 of 8) © 2020 Wiley-VCH GmbH
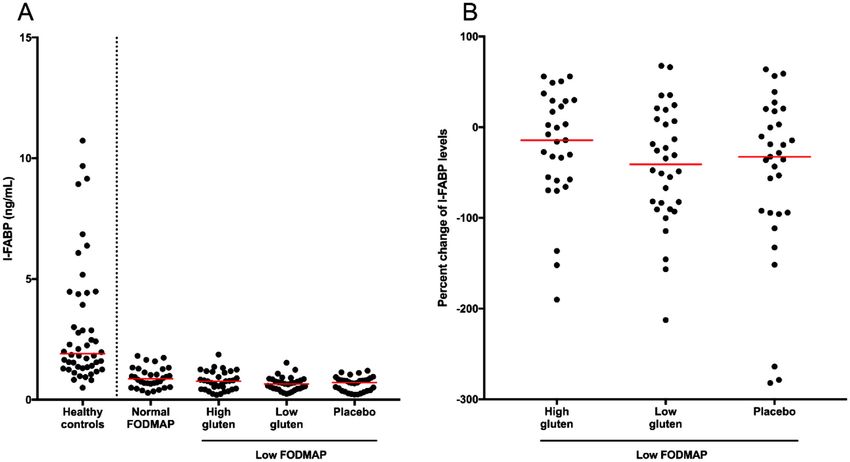
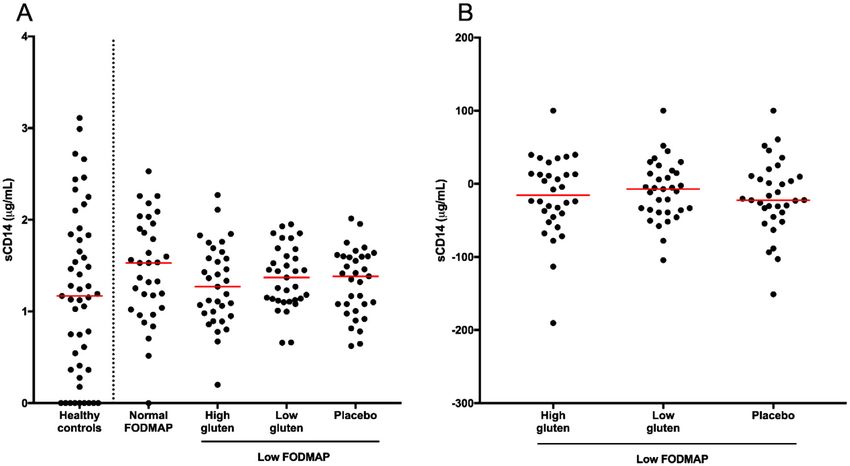
www.advancedsciencenews.com www.mnf-journal.com

Figure 2. Absolute and percent changes of serum intestinal fatty acid binding protein (I-FABP) levels in healthy controls and in individuals with IBS
and self-reported gluten sensitivity during the normal-FODMAP period and subsequent high-gluten, low-gluten and placebo dietary interventions on
a background low-FODMAP diet. A) Serum levels of I-FABP. An outlier (>30 ng mL−1 ) was omitted from the healthy control cohort. There was a
significant difference between levels in the normal-FODMAP dietary intervention from the low-gluten (p = 0.008) and placebo interventions (p = 0.015),
as determined by Wilcoxon tests. Levels in healthy controls were different from those in the participants in every dietary intervention arm (p < 0.0001;
Mann–Whitney tests). B) Percent change in I-FABP levels relative to normal-FODMAP period after omitting outliers showing >300% reduction in the
high- and low-gluten groups (n = 1 each) and 2 in the placebo group. No significant pairwise comparisons were observed in absolute or percent change
levels after correction for multiple comparisons. Red bars represent medians. The vertical broken line separates healthy controls from the experimental
cohort.

that during the low-gluten intervention at 28 ng mL−1 , the high- with IBS, 0.8 ng mL−1 for the high-gluten intervention, and
gluten intervention at 25 ng mL−1 , and the placebo intervention at 0.7 ng mL−1 for the low-gluten and placebo interventions. There
24 ng mL−1 . There was a significant difference across the paired was a significant difference across the paired interventions in
interventions in the IBS cohort ( 2 F (3) = 24.82, p < 0.0001; Fried- the IBS cohort ( 2 F (3) = 9.982, p = 0.019). Significant pairwise
man’s test). Significant pairwise comparisons, as indicated by comparisons, as indicated by Wilcoxon tests, were observed
Wilcoxon tests, were observed between normal-FODMAP and between normal-FODMAP and low-gluten (p = 0.008), and
high-gluten (p < 0.0001), normal-FODMAP and low-gluten (p = normal-FODMAP and placebo interventions (p = 0.015). Addi-
0.0006), and normal-FODMAP and placebo (p = 0.0001) inter- tional significant pairwise comparisons, determined by Mann–
ventions. A significant pairwise comparison was also found by Whitney tests, were observed between healthy controls and study
Mann–Whitney test between healthy controls and study partici- participants in every dietary intervention arm (p < 0.0001).
pants in the normal-FODMAP dietary intervention (p = 0.0123). The percentage changes in I-FABP levels from the normal- to
 The changes in syndecan-1 levels from the normal to low low-FODMAP dietary periods are shown in Figure 2B. While I-
FODMAP dietary periods (expressed as percentage change) are FABP levels fell across the three dietary interventions, the differ-
shown in Figure 1B. The levels were significantly reduced in all ences were not statistically significant.
interventions being by a median of 33% for the high-gluten in-
tervention, 33% for the low-gluten intervention, and 35% for the
placebo intervention. No difference was observed in the changes 2.4. LBP
across the three interventions.
 As shown in Figure 3A, median levels of LBP in healthy controls
 was 16 µg mL−1 , which was similar to 12 µg mL−1 in the normal-
2.3. I-FABP FODMAP intervention, but greater than 7 µg mL−1 that was ob-
 served in the high-gluten, low-gluten, and placebo interventions.
As shown in Figure 2A, the median I-FABP level in healthy These differences were significant discoveries when the false dis-
controls was 2.0 ng mL−1 , which was higher than 0.9 ng mL−1 covery rate (FDR) was controlled (q = 0.0240 for all p-values). In
in the baseline (normal-FODMAP) condition in the participants the participants with IBS, LBP concentrations differed across the

Mol. Nutr. Food Res. 2021, 65, 1901275 1901275 (3 of 8) © 2020 Wiley-VCH GmbH
www.advancedsciencenews.com www.mnf-journal.com

Figure 3. Absolute and percent changes of serum lipopolysaccharide-binding protein (LBP) levels in healthy controls and in individuals with IBS and self-
reported gluten sensitivity during the normal-FODMAP period and subsequent high-gluten, low-gluten and placebo dietary interventions on a background
low-FODMAP diet. A) Serum LBP levels. Levels during the normal-FODMAP period were different to those in during the high-gluten intervention (p =
0.0017; paired t-test). Levels in healthy controls were different from those in IBS study participants during the high-gluten (p = 0.006), low-gluten
(p = 0.017), and placebo (p = 0.018) dietary interventions (Mann–Whitney test). B) Percent change in LBP levels relative to normal-FODMAP period.
No significant differences were observed across the dietary intervention groups. Red bars represent medians. The vertical broken line separates healthy
controls from the experimental cohort.

dietary periods ( 2 F (3) = 10.25, p = 0.017). There was a significant 2.6. Correlations between Biomarkers and their Change
difference between the normal-FODMAP arm and high-gluten
arms (p = 0.002; paired t-test), which was a significant discovery A positive, significant correlation was found between LBP and
when the FDR was controlled (q = 0.0102). Significant pairwise sCD14 levels (p = 0.020, r = 0.403) in the normal-FODMAP
comparisons, as indicated by Wilcoxon tests, were also found be- condition. However, no significant correlations were observed
tween normal-FODMAP intake and low-gluten (p = 0.02) and between LBP and sCD14 in any low-FODMAP dietary period.
placebo interventions (p = 0.05), though these were not signif- There were no significant correlations evident between syndecan-
icant discoveries when the FDR was controlled (q = 0.0690 and q 1 and I-FABP levels in any dietary period. There were also no
= 0.0996, respectively). Significant differences were observed in correlations evident between change in syndecan-1 (normal-
pairwise comparisons by Mann–Whitney tests between healthy FODMAP to any of the interventions) with changes in I-FABP
individuals and study participants in the high-gluten (p = 0.006), and LBP.
low-gluten (p = 0.017), and placebo (p = 0.018) intervention arms.
These were significant discoveries when the FDR was controlled 3. Discussion
(q = 0.0240).
 The change in LBP concentrations from those in the FODMAP Non-coeliac gluten or wheat sensitivity is controversial since the
arm are shown in Figure 3B. No significant differences were ob- diagnostic criteria depend largely upon self-reported responses
served in pairwise comparisons. of symptoms to gluten withdrawal and subsequent re-challenge
 in those where coeliac disease and wheat allergy have been
 excluded.[1] Several randomized controlled re-challenge studies
2.5. sCD14 in adults and children with self-reported NCGS have largely
 failed to define a sub-group with gluten-specific induction of
As shown in Figure 4A, sCD14 levels were similar across healthy symptoms.[2–6] The strong nocebo effect in the cohorts in these
controls and participants with IBS irrespective of the dietary pe- studies led to similar proportions having marked responses to
riod when blood was drawn. The percentage change in sCD14 placebo or to gluten. The findings of a unique combination of
levels from normal-FODMAP arm to the intervention arms biomarkers indicating systemic immune activation and compro-
are shown in Figure 4B and no significant alterations were mised intestinal barrier integrity in an Italian cohort that ful-
observed. filled criteria for NCGS raised hope that a pattern of biomarkers

Mol. Nutr. Food Res. 2021, 65, 1901275 1901275 (4 of 8) © 2020 Wiley-VCH GmbH
www.advancedsciencenews.com www.mnf-journal.com

Figure 4. Absolute and percent changes of serum soluble CD14 (sCD14) levels in healthy controls and in individuals with IBS and self-reported gluten
sensitivity during the normal-FODMAP period and subsequent high-gluten, low-gluten, and placebo dietary interventions on a background low-FODMAP
diet. A) Serum sCD14 levels. B) Percent change in sCD14 levels relative to normal-FODMAP period after omitting one outlier showing >300% reduction
in the high-gluten group. No significant pairwise comparisons between means or medians were observed in absolute or percent change levels (analysis
performed on complete datasets). Red bars represent medians. The vertical broken line separates healthy controls from the experimental cohort.

that identify the condition pathophysiologically was emerging.[7] fulfilling similar clinical criteria. This idea has been previously
However, we were not able to confirm similar abnormalities in raised.[19] Italian cohorts in whom intestinal histopathology has
these biomarkers nor their induction by the ingestion of gluten. been reported seem to have a high prevalence of intraepithelial
in this cohort of patients with IBS who fulfill the criteria for lymphocytosis and eosinophilic infiltration,[20] but whether they
NCGS. Indeed, the findings have highlighted the potential role are representative of the patients utilized in the biomarker study
of FODMAPs in the pathophysiology of IBS and self-reported is not known. In our cohort, about one half had duodenal histol-
gluten sensitivity with the reduction of a marker of intestinal ep- ogy performed (those who were HLA-DQ2 or DQ8 positive) and
ithelial injury on reducing FODMAP intake in association with none had such abnormalities.
improved symptoms. If the change observed is a FODMAP- Both I-FABP and syndecan-1 are markers of intestinal ep-
specific effect, then it supports findings of a blinded triple-arm ithelial injury. I-FABP (also known as fatty acid-binding protein
re-challenge study that implicated fructans, a FODMAP that is 2) is expressed throughout the small and large intestines,[21,22]
generally rich in gluten-containing cereals, as the culprit food but tissue concentrations are more than tenfold greater in the
component.[6] This was also consistent with improved symptoms proximal small intestine compared with those in the colon.[23]
in our cohort of patients when these were markedly reduced in Upon damage of the enterocyte, I-FABP is released into the
their diet as part of the trial, albeit in unblinded observations. circulation. Several studies have observed increased circulating
 We found that circulating concentrations of the biomarkers of I-FABP levels in patients with coeliac disease compared with
intestinal injury in the subjects with IBS were abnormal when those in normal healthy controls [7,24–29] and has been used as a
compared with those of a local population of healthy controls. marker of responsiveness to gluten in a study involving adults
Analysis of blood taken while the subjects were consuming their with coeliac disease undergoing a gluten challenge.[30] Levels of
habitual gluten-free diet revealed concentrations of syndecan-1 I-FABP may be increased in Crohn’s disease, but not in active
to be elevated and I-FABP reduced. In contrast, markers of ulcerative colitis, consistent with its being a marker of small
bacterial translocation were not different. This was in contrast to rather than large intestinal epithelial injury.[31,32] Syndecan-1
elevated I-FABP and markers of bacterial translocation observed or CD138, is a transmembrane proteoglycan of epithelial cells
in the Italian cohort, although syndecan-1 was not measured. involved in adhesion between cells and extracellular matrices
This was unlikely to be due to technical issues as the same and has been implicated to play a key role in maintenance of
assays were applied and the same scientist (M.A.) performed the intestinal epithelial barrier.[33–35] For example, the loss of
most of them. These observations indicate that the Australian syndecan-1 core protein and ectodomain components in an ani-
and Italian cohorts have very different pathophysiology despite mal study has been shown to increase protein efflux into the gut

Mol. Nutr. Food Res. 2021, 65, 1901275 1901275 (5 of 8) © 2020 Wiley-VCH GmbH
www.advancedsciencenews.com www.mnf-journal.com

lumen,[35] and its overexpression in cell culture prevented bac- that exists as a membrane-associated form (mCD14) primar-
terial translocation and promoted maintenance of the intestinal ily on monocytes/macrophages (considered CD14-positive cells)
barrier.[33] Soluble ectodomains of syndecan-1 are constituently and as a soluble, extracellular form (sCD14) released from the
shed and able to migrate into the circulation. The local release of membrane.[44,45] Both forms of CD14 are upregulated by the
inflammatory cytokines, including tumor necrosis factor alpha presence of LPS and other bacterial wall components.[46] Us-
and interleukin-1 , enhances such shedding.[36–38] Consistent age of these markers to indicate microbial translocation across
with such concepts, circulating syndecan-1 levels increase in the gut barrier have described in diverse settings such as in-
patients with active Crohn’s disease and ulcerative colitis[38,39] testinal disease activity in patients with human immunodefi-
and fall in response to anti-tumor necrosis factor therapy.[40,41] ciency virus infection, active inflammatory bowel disease,[47]
Heightened levels of syndecan-1 correlated to mucosal damage and following the ingestion of apparently pro-inflammatory di-
in pediatric patients with coeliac disease and not in in children ets in healthy subjects.[7,48] Both LBP and sCD14 had signifi-
with non-specific abdominal pain.[38] cant, positive correlations with I-FABP in the Italian cohort with
 In light of what is known about these two markers, the low to NCGS,[7] and heightened levels of sCD14 along with I-FABP have
normal levels of I-FABP in association with the habitual diet of been described in both treated and newly diagnosed, untreated
the patients with IBS and self-reported gluten sensitivity in our patients with coeliac disease compared with those in healthy
cohort indicate a low likelihood that small intestinal injury is individuals.[25] Thus, our negative findings indicate that exces-
occurring, but the elevated levels of syndecan-1 suggest injury to sive systemic exposure to LPS was unlikely to be occurring in the
large intestinal epithelium. Furthermore, the normalization of patients with IBS.
the syndecan-1 (reducing by about 30%), and lack of significant In conclusion, using biomarkers of intestinal epithelial injury
change in I-FABP during the gluten and placebo challenge peri- and microbial translocation, we have clearly demonstrated the
ods indicated that gluten was not injurious and that something heterogeneity of populations self-reporting gluten sensitivity
had changed between habitual and challenge dietary periods. when defined by symptomatic criteria. Gluten is unlikely to be in-
The main difference in food composition between the habitual ducing intestinal injury or inflammation in patients who believe
and challenge periods was the reduction of FODMAP intake, they are gluten sensitive when their small intestinal histology
suggesting that the FODMAPs might potentially have been the is normal or when they are HLA DQ2 or DQ8 negative. These
injurious factors. Such a notion is not new. Ingestion of high objective findings support the lack of symptomatic responses
doses of fructo-oligosaccharide or lactulose in murine studies specifically to blinded gluten challenge in this cohort with nor-
is associated with increased epithelial permeability, increased mal duodenal histology and/or not carrying HLA-D haplotypes
susceptibility to and severity of Salmonella infection, and in- associated with coeliac disease. The correction of objective of
creased mucus production (assumed a response to epithelial evidence of epithelial injury as shown by normalization of cir-
injury).[10–13] In rats, ingestion of a high FODMAP diet induced culating syndecan-1 concentrations with reduction of FODMAP
increased colonic epithelial permeability and mucosal inflam- intake supports the clinical observations that FODMAPs play
mation with heightened visceral sensitivity.[14] When fecal water a key role in symptom generation in this cohort. The findings
from patients with IBS on their habitual diet was placed into the are attributed speculatively to a protective effect on the colonic
colonic lumen in that rat model, similar effects were observed. epithelium of reducing dietary FODMAP intake supporting
Moreover, those effects were abolished when the patients were other data for the concept that symptomatic improvement on
consuming a diet low in FODMAPs. Mechanistically, these a diet low in FODMAPs may be attributed to more than just
deleterious effects could be blocked by the use of antibodies that the reduced stimulation of mechanoreceptors via osmotic and
bind lipopolysaccharide (LPS), giving rise to the concept that fermentative distension of the intestinal lumen.
the reduced absolute abundance of bacteria (specifically those
bearing LPS) that has been consistently documented in patients
consuming a low FODMAP diet may be causally related to 4. Experimental Section
reduced visceral sensitivity and improved longer term symptom
 Study Participants: Study participants were fully described in the
severity. Hence, our findings, in which likely large intestine- published report of the interventional study.[8] Briefly, subjects, recruited
specific epithelial injury present in the patients with IBS while by advertising, had chronic abdominal symptoms that fitted the Rome
consuming their habitual diet reversed when FODMAP intake 3 criteria for IBS, believed themselves to be sensitive to gluten and were
was reduced, suggest a causal relationship. Only further studies adherent to a gluten-free diet as assessed by a nutritionist at the time of re-
could define whether this association is indeed causal. cruitment. They were above 16 years of age, none had antibodies to wheat
 No abnormality in the degree of bacterial translocation could antigens, and coeliac disease had been excluded by the absence of HLA-
 DQ2 or 8 or by normal duodenal histology when on a gluten-containing
be detected under any of the dietary conditions in our study, diet. They were not taking any drugs or had other illness that was known
in contrast to that observed in the Italian cohort. sCD14 and to compromise intestinal mucosal integrity. Subjects 16–70 years old who
LBP are two endogenous proteins commonly studied together believed themselves to be healthy with no known gastrointestinal illness
to assess levels of circulating bacterial products, namely LPS were also recruited by advertising and word-of-mouth. Subjects were se-
(i.e., endotoxin) from gram-negative bacteria and, in this way, lected on the basis of exclusion criteria; they were excluded if consuming
act as surrogate markers to identify bacterial translocation. Pri- a restrictive diet (e.g., gluten free) or if taking any medication or comple-
 mentary medicine that might potentially affect intestinal barrier function.
marily produced in hepatocytes, LBP has a high affinity for
 They were also excluded if they had pre-existing liver disease, diabetes,
circulating LPS, and is typically upregulated in response to and autoimmune disorders or evidence of ongoing, active infection.
increased concentrations.[42,43] The presence of LBP is neces- Protocol: The study protocol of the placebo-controlled, randomized,
sary to facilitate the binding of LPS to CD14, a glycoprotein double-blind crossover intervention was previously described in the

Mol. Nutr. Food Res. 2021, 65, 1901275 1901275 (6 of 8) © 2020 Wiley-VCH GmbH
www.advancedsciencenews.com www.mnf-journal.com

published report.[8] Briefly, participants remained on a gluten-free, Data Availability Statement
normal FODMAP diet, and their intake (via a food diary) and symptoms
were documented for 1 week. They were then instructed on reducing The data that support the findings of this study are available from the cor-
FODMAPs in addition to remaining gluten-free for a 2-week run-in period. responding author upon reasonable request.
Patients then received one of the three diets (i.e., low gluten, high gluten,
and placebo) on a background low FODMAP diet for 1 week followed by
a minimum 2-week washout before the second diet was commenced for Author Contributions
1 week. The same process was followed for the third diet. All food was
provided during the interventions and neither the assessing investigator M.A. devised the study, performed assays, interpreted the data, wrote
nor the subjects knew the nature of the interventional diets, which differed the manuscript, and edited the manuscript. G.R. devised the study, in-
only in the protein composition—16 g/d gluten/d versus 2 g/d gluten terpreted the data, and edited the manuscript. E.D.N. and J.R.B. devised
plus 14 g/d whey protein versus 16 g/d whey protein (placebo). Severity and performed the original study, and edited the manuscript. J.G.M. de-
of gastrointestinal symptoms were assessed using daily visual analogue vised and performed the original study, interpreted the data, and edited
scales. Peripheral blood was taken at the end of the 1-week observation the manuscript. P.R.G. devised the original study and current analysis, in-
period on a gluten-free diet without restriction of FODMAPs after enrol- terpreted the data, wrote the manuscript, and edited the manuscript
ment in the study as well as on day 6 of each dietary intervention. Blood
was also collected when a particular dietary intervention was discontinued
due to intolerable symptoms if these occurred later than day 6. A single Conflict of Interest
sample of 40 mL of peripheral blood was also taken from the healthy
controls. Serum was extracted, placed in aliquots, and stored at −80 °C M.A., G.R., E.D.N., and J.R.B. declare no conflict of interest. J.G.M. and
until used for assays. Thus, serum was available for four dietary regimens: P.R.G. declare that Monash University financially benefits from the sales
gluten-free, normal-FODMAP; gluten-free low-FODMAP (placebo); low- of a digital application, booklets, and an online course regarding the
gluten, low-FODMAP; and high-gluten, low-FODMAP, in addition to the FODMAP diet. P.R.G. has published a recipe and an educational book on
healthy controls who provided normal ranges. the FODMAP diet.
 The nutritional composition was evaluated by food diary input and anal-
ysis using FoodWorks (Xyris Software, Australia) and, for the provided di-
ets, food content, and laboratory food analysis for FODMAPs as previously Keywords
detailed.[8] This and food diaries enabled adherence to the diets to be eval-
uated and has been previously reported. No dietary intake was assessed bacterial translocation, functional bowel disorders, gluten-free diet, in-
in the healthy controls. testinal epithelium
 The modification of the protocol to measure the biomarkers in this
study and the taking of blood from healthy controls were approved by the Received: December 2, 2020
Monash University Human Research Ethics Committee (Approval number Revised: August 21, 2020
7102). Patients or the public were not involved in the design, or conduct, Published online: October 21, 2020
or reporting, or dissemination of this research
 Biomarker Assay Methodology: Concentrations of the biomarkers (be-
low) were measured by commercially available ELISAs, which were all per-
formed according to manufacturers’ protocols. The assay kits were for hu-
man I-FABP (also known as fatty acid-binding protein 2) (R&D Systems, [1] C. Catassi, L. Elli, B. Bonaz, G. Bouma, A. Carroccio, G. Castillejo, C.
USA), LBP (Hycult Biotech, The Netherlands), human sCD14 (R&D Sys- Cellier, F. Cristofori, L. de Magistris, J. Dolinsek, W. Dieterich, R. Fran-
tems, USA), and human syndecan-1 (CD138) (Diaclone, France). The aver- cavilla, M. Hadjivassiliou, W. Holtmeier, U. Körner, D. A. Leffler, K. E.
age coefficient of variation between duplicates was below 10%. Averages A. Lundin, G. Mazzarella, C. J. Mulder, N. Pellegrini, K. Rostami, D.
of duplicates were determined and absolute values are expressed in the Sanders, G. I. Skodje, D. Schuppan, R. Ullrich, U. Volta, M. Williams,
following units: ng mL−1 for I-FABP and syndecan-1, and µg mL−1 for LBP V. F. Zevallos, Y. Zopf, A. Fasano, Nutrients 2015, 7, 4966.
and sCD14. [2] A. Di Sabatino, U. Volta, C. Salvatore, P. Biancheri, G. Caio, R. De
 Statistical Analyses: Statistical analyses were performed on complete Giorgio, M. Di Stefano, G. R. Corazza, Clin. Gastroenterol. Hepatol.
datasets by IBM SPSS Statistics Version 24 (IBM Corp., USA) and Graph- 2015, 13, 1604.
Pad Prism 6 (GraphPad Software, USA). Figures were generated with [3] L. Elli, C. Tomba, F. Branchi, L. Roncoroni, V. Lombardo, M. T.
GraphPad Prism 6, outliers being omitted from some graphs for illus- Bardella, F. Ferretti, D. Conte, F. Valiante, L. Fini, E. Forti, R. Can-
trative purposes. Normality of distribution with regards to marker levels nizzaro, S. Maiero, C. Londoni, A. Lauri, G. Fornaciari, N. Lenoci,
and clinical indicators in study cohorts were determined by Shapiro–Wilk R. Spagnuolo, G. Basilisco, F. Somalvico, B. Borgatta, G. Leandro, S.
tests. For repeated-measures pairwise comparisons, repeated-measures Segato, D. Barisani, G. Morreale, E. Buscarini, Nutrients 2016, 8, 84.
t-tests were used for normally distributed marker levels or Wilcoxon tests
 [4] B. Zanini, R. Baschè, A. Ferraresi, C. Ricci, F. Lanzarotto, M. Marullo,
for nonparametric marker distributions. Friedman’s tests were used for
 V. Villanacci, A. Hidalgo, A. Lanzini, Aliment. Pharmacol. Ther. 2015,
repeated-measures comparisons between marker levels with at least one
 42, 968.
or more nonparametric distributions. All multiple pairwise comparisons,
including those featured in figures, met criteria for statistical significance [5] R. Francavilla, F. Cristofori, L. Verzillo, A. Gentile, S. Castellaneta, C.
after controlling the FDR at 5% unless otherwise stated.[49] p-values of Polloni, V. Giorgio, E. Verduci, E. DʼAngelo, S. Dellatte, F. Indrio, Am.
false discoveries are not included in figures. Pearson’s r correlations J. Gastroenterol. 2018, 113, 421.
between marker data were performed when both variables had normal [6] G. I. Skodje, V. K. Sarna, I. H. Minelle, K. L. Rolfsen, J. G. Muir, P. R.
distributions, whereas Spearman’s r correlations were performed when Gibson, M. B. Veierød, C. Henriksen, K. E. A. Lundin, Gastroenterology
either or both variables had nonparametric distributions. All p-values 2018, 154, 529.
were two sided and determined to be statistically significant at p ≤ 0.05. [7] M. Uhde, M. Ajamian, G. Caio, R. De Giorgio, A. Indart, P. H. Green,
 E. C. Verna, U. Volta, A. Alaedini, Gut 2016, 65, 1930.
 [8] J. R. Biesiekierski, S. L. Peters, E. D. Newnham, O. Rosella, J. G. Muir,
Acknowledgements
 P. R. Gibson, Gastroenterology 2013, 145, 320.
M.A. was in receipt of a Postgraduate Scholarship from the Faculty of [9] P. R. Gibson, E. P. Halmos, J. G. Muir, Aliment. Pharmacol. Ther. 2020,
Medicine, Nursing and Health Sciences, Monash University. 52, 233.

Mol. Nutr. Food Res. 2021, 65, 1901275 1901275 (7 of 8) © 2020 Wiley-VCH GmbH
www.advancedsciencenews.com www.mnf-journal.com

[10] R. A. Argenzio, D. J. Meuten, Dig. Dis. Sci. 1991, 36, 1459. [29] I. B. Oldenburger, V. M. Wolters, T. Kardol-Hoefnagel, R. H. J.
[11] I. M. Bovee-Oudenhoven, S. J. Ten Bruggencate, M. L. Lettink- Houwen, H. G. Otten, APMIS 2018, 126, 186.
 Wissink, R. Van der Meer, J. Nutr. 2005, 135, 837. [30] M. P. Adriaanse, D. A. Leffler, C. P. Kelly, D. Schuppan, R. M. Na-
[12] S. J. Ten Bruggencate, I. M. Bovee-Oudenhoven, M. L. Lettink- jarian, J. D. Goldsmith, W. A. Buurman, A. C. E. Vreugdenhil, Am. J.
 Wissink, R. Van der Meer, J. Nutr. 2006, 136, 70. Gastroenterol. 2016, 111, 1014.
[13] A. Petersen, P. M. Heegaard, A. L. Pedersen, J. B. Andersen, R. B. [31] A. G. Bodelier, M. J. Pierik, K. Lenaerts, E. de Boer, S. W. O. Damink,
 Sørensen, H. Frøkiaer, S. J. Lahtinen, A. C. Ouwehand, M. Poulsen, W. M. Hameeteman, A. A. M. Masclee, D. M. Jonkers, Eur. J. Gas-
 T. R. Licht, BMC Microbiol. 2009, 9, 245. troenterol. Hepatol. 2016, 28, 807.
[14] S. Y. Zhou, M. Gillilland 3rd, X. Wu, P. Leelasinjaroen, G. Zhang, H. [32] A. Wiercinska-Drapalo, J. Jaroszewicz, E. Siwak, J. Pogorzelska, D.
 Zhou, B. Ye, Y. Lu, C. Owyang, J. Clin. Invest. 2017, 128, 267. Prokopowicz, Regul. Pept. 2008, 147, 25.
[15] B. R. Chen, L. J. Du, H. Q. He, J. J. Kim, Y. Yan Zhao, Y. Zhang, L. Luo, [33] Z. Wang, R. Li, J. Tan, L. Peng, P. Wang, J. Liu, H. Xiong, B. Jiang, Y.
 N. Dai, World J. Gastroenterol. 2017, 23, 8321. Chen, Inflammatory Bowel Dis. 2015, 21, 1894.
[16] M. Palaiologou, I. Delladetsima, D. Tiniakos, Histol. Histopathol. [34] A. N. Alexopoulou, H. A. Multhaupt, J. R. Couchman, Int. J. Biochem.
 2014, 29, 177. Cell Biol. 2007, 39, 505.
[17] H. Xu, A. Diolintzi, J. Storch, Curr. Opin. Clin. Nutr. Metab. Care 2019, [35] L. Bode, C. Salvestrini, P. W. Park, J.-P. Li, J. D. Esko, Y. Yamaguchi, S.
 22, 407. Murch, H. H. Freeze, J. Clin. Invest. 2008, 118, 229.
[18] A. Alexopoulou, D. Agiasotelli, L. E. Vasilieva, S. P. Dourakis, Ann. [36] X. Gan, B. Wong, S. D. Wright, T. Q. Cai, J. Interferon Cytokine Res.
 Gastroenterol. 2017, 30, 4864. 2001, 21, 93.
[19] P. R. Gibson, G. I. Skodje, K. E. Lundin, J. Gastroenterol. Hepatol. 2017, [37] R. D. Klein, A. H. Borchers, P. Sundareshan, C. Bougelet, M. R.
 32, 86. Berkman, R. B. Nagle, G. T. Bowden, J. Biol. Chem. 1997, 272,
[20] A. Carroccio, G. Giannone, P. Mansueto, M. Soresi, F. La Blasca, F. 14188.
 Fayer, R. Iacobucci, R. Porcasi, T. Catalano, G. Geraci, A. Arini, A. [38] D. Yablecovitch, A. Stein, M. Shabat-Simon, T. Naftali, G. Gabay,
 D’Alcamo, V. Villanacci, A. M. Florena, Clin. Gastroenterol. Hepatol. I. Laish, A. Oren, F. M. Konikoff, Dig. Dis. Sci. 2015, 60,
 2019, 17, 682. 2419.
[21] M. Furuhashi, G. S. Hotamisligil, Nat. Rev. Drug Discovery 2008, 7, [39] C. Cekic, A. Kirci, S. Vatansever, F. Aslan, H. E. Yılmaz, E. Alper, M.
 489. Arabul, E. S. Yüksel, B. Ünsal, Gastroenterol. Res. Pract. 2015, 2015,
[22] J. P. Derikx, D. H. Schellekens, S. Acosta, Best Pract. Res. Clin. Gas- 850351.
 troenterol. 2017, 31, 69. [40] E. Ierardi, F. Giorgio, M. Zotti, R. Rosania, M. Principi, S. Marangi, N.
[23] J. P. Derikx, A. C. Vreugdenhil, A. M. Van den Neucker, J. Groot- D. Valle, V. De Francesco, A. Di Leo, M. Ingrosso, C. Panella, J. Clin.
 jans, A. A. van Bijnen, J. G. M. C. Damoiseaux, L. W. E. van Pathol. 2011, 64, 968.
 Heurn, E. Heineman, W. A. Buurman, J. Clin. Gastroenterol. 2009, 43, [41] A. Tursi, W. Elisei, M. Principi, D. D. Inchingolo, R. Nenna, M. Picchio,
 727. F. Giorgio, E. Ierardi, G. Brandimarte, J. Gastrointest. Liver Dis. 2014,
[24] M. P. Adriaanse, G. J. Tack, V. L. Passos, J. G. M. C. Damoiseaux, 23, 261.
 M. W. J. Schreurs, K. van Wijck, R. G. Riedl, A. A. M. Masclee, W. A. [42] B. J. Grube, C. G. Cochane, R. D. Ye, M. E. McPhail, R. J. Ulevitch, P.
 Buurman, C. J. J. Mulder, A. C. E. Vreugdenhil, Aliment. Pharmacol. S. Tobias, J. Biol. Chem. 1994, 269, 8477.
 Ther. 2013, 37, 482. [43] R. D. Klein, G. L. Su, A. Aminlari, W. H. Alarcon, S. C. Wang, J. Surg.
[25] I. Hoffmanova, D. Sanchez, V. Habova, M. Anděl, L. Tučková, H. Res. 1998, 78, 42.
 Tlaskalová-Hogenová, Physiol. Res. 2015, 64, 537. [44] S. D. Wright, R. A. Ramos, P. S. Tobias, R. J. Ulevitch, J. C. Mathison,
[26] N. M. B. Arias, M. Garcia, C. Bondar, L. Guzman, A. Redondo, N. Science 1990, 249, 1431.
 Chopita, B. Córsico, F. G. Chirdo, Mediators Inflammation 2015, 2015, [45] R. I. Tapping, P. S. Tobias, J. Biol. Chem. 1997, 272, 23157.
 738563. [46] R. Landmann, H. P. Knopf, S. Link, S. Sansano, R. Schumann, W. Zim-
[27] A. C. Vreugdenhil, V. M. Wolters, M. P. Adriaanse, A. M. Van den merli, Infect. Immun. 1996, 64, 1762.
 Neucker, A. A. van Bijnen, R. Houwen, W. A. Buurman, Scand. J. Gas- [47] O. P. Rojo, A. Lopez San Roman, E. A. Arbizu, A. de la Hera Martínez,
 troenterol. 2011, 46, 1435. E. R. Sevillano, A. A. Martínez, Inflammatory Bowel Dis. 2007, 13,
[28] M. P. M. Adriaanse, A. Mubarak, R. G. Riedl, F. J. W. Ten Kate, J. G. M. 269.
 C. Damoiseaux, W. A. Buurman, R. H. J. Houwen, A. C. E. Vreugden- [48] N. G. Sandler, D. C. Douek, Nat. Rev. Microbiol. 2012, 10, 655.
 hil, Sci. Rep. 2017, 7, 8671. [49] Y. Benjamini, Y. Hochberg, J. R. Stat. Soc., Ser. B 1995, 57, 289.

Mol. Nutr. Food Res. 2021, 65, 1901275 1901275 (8 of 8) © 2020 Wiley-VCH GmbH
You can also read