City of Newton Climate Vulnerability Assessment and Adaptation and Resiliency Action Plan - Mass.gov
←
→
Page content transcription
If your browser does not render page correctly, please read the page content below
City of Newton
Climate Vulnerability Assessment and
Adaptation and Resiliency Action Plan

First Edition, April 2018

                            Prepared for
                            City of Newton
                            1000 Commonwealth Avenue
                            Newton, Massachusetts 02459
                            www.newtonma.gov
                            Ruthanne Fuller, Mayor

                             Prepared by
                             Metropolitan Area Planning Council
                             60 Temple Place, 6th Floor
                             Boston, Massachusetts 02111
                             www.mapc.org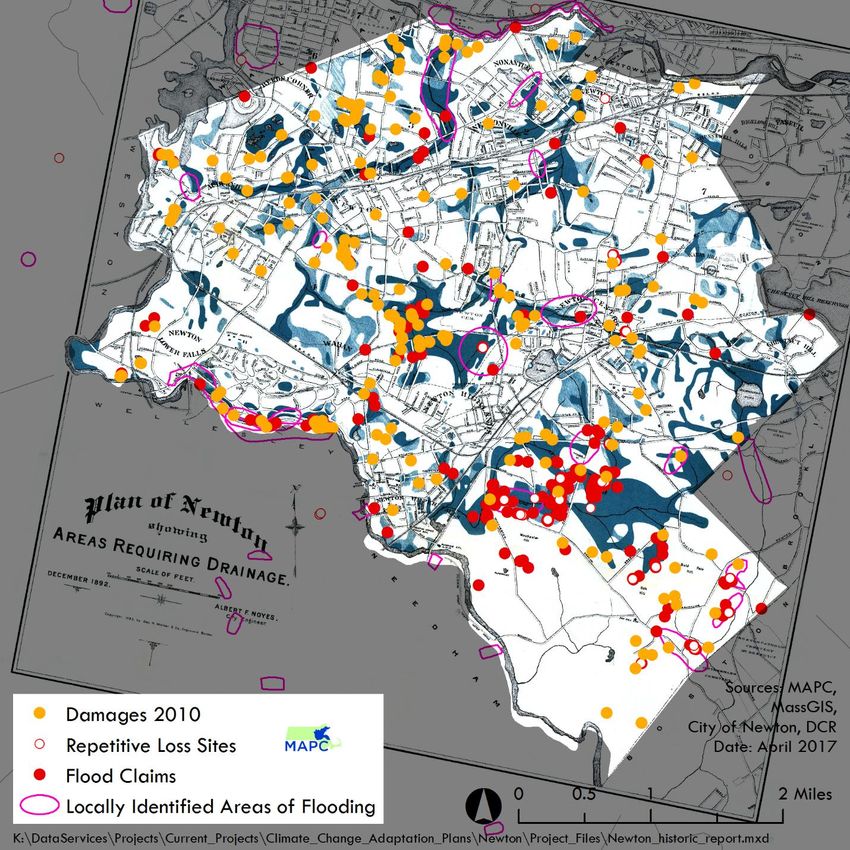
ACKNOWLEDGEMENTS
The project was conducted by the Metropolitan Area Planning Council (MAPC) with funding from
MAPC’s Planning for MetroFuture Technical Assistance program, the Barr Foundation, the
Commonwealth of Massachusetts Community Compact program, and the City of Newton.

METROPOLITAN AREA PLANNING COUNCIL

Officers
       President                                          Keith Bergman
       Vice President                                     Erin Wortman
       Secretary                                          Sandra Hackman
       Treasurer                                          Taber Keally
       Executive Director                                 Marc D. Draisen

       Project Manager/Senior Environmental Planner       Anne Herbst
       Regional Planner                                   Genea Foster
       GIS/Data Analysis                                  Eliza Wallace
                                                          Ryan Melendez
                                                          Emily Long

CITY OF NEWTON

Mayor                                                     Ruthanne Fuller
Planning Department Director                              Barney Heath
Chief Environmental Planner                               Jennifer Steel

Steering Committee Members

Alexandra Ananth, Ann Berwick, Jennifer Caira, Robert J. Derubeis, William Ferguson, James
Freas, Dennis Geary, Barney Heath, Theodore Jerdee, David MacDonald, Shane Mark, James
McGonagle, Joshua Morse, Bruce Proia, Kimberly Ritcey, Maria Rose, Andy Savitz, Jennifer Steel,
Lou Taverna, Linda Walsh, Marc Welch, Jonathan Yeo, Deborah Youngblood, Dori Zaleznik
TABLE OF CONTENTS
CLIMATE CHANGE BACKGROUND ..................................................................................................... 1
   Climate Change: Observations, Projections, Impacts.................................................................................. 3
WHY UNDERTAKE A CLIMATE VULNERABILITY ASSESSMENT FOR NEWTON? .............................................. 9
SOCIOECONOMIC VULNERABILITY ................................................................................................... 10
SOCIOECONOMIC CONDITIONS IN NEWTON ...................................................................................... 11
CLIMATE IMPACTS ON PUBLIC HEALTH ............................................................................................. 17
   Extreme Heat ........................................................................................................................................... 18
   Increased Precipitation & Flooding .......................................................................................................... 24
   Vector Borne-Illnesses .............................................................................................................................. 24
NATURAL RESOURCES AND CLIMATE RESILIENCE ............................................................................... 26
   Mitigation ................................................................................................................................................ 26
   Protection ................................................................................................................................................. 26
CLIMATE IMPACTS ON NATURAL RESOURCES .................................................................................... 27
   Aquatic and Wetland Resources .............................................................................................................. 27
   Forests and Trees ..................................................................................................................................... 29
CLIMATE IMPACTS ON THE BUILT ENVIRONMENT ................................................................................ 31
   Flooding and the Built Environment .......................................................................................................... 31
   Sea Level Rise and the Built Environment ................................................................................................. 45
   Temperature and the Built Environment.................................................................................................... 47
CLIMATE IMPACTS ON THE LOCAL ECONOMY .................................................................................... 47
CLIMATE IMPACTS ON STATE-OWNED INFRASTRUCTURE ...................................................................... 48
CLIMATE IMPACTS ON UTILITIES ...................................................................................................... 50
VULNERABILITY ASSESSMENT SUMMARY .......................................................................................... 53
ADAPTATION AND RESILIENCY ACTION PLAN ........................................... Error! Bookmark not defined.

TABLES
Table 1. Design Storm Estimates .................................................................................................................... 8
Table 2. 10-year 24-hour Design Storm Projections ................................................................................. 9
Table 3. Critical Facilities in Temperature Hot Spots............................................................................ 223
Table 4. Water Quality Impairments ......................................................................................................... 28
Table 5. Tree Canopy and Land Use ......................................................................................................... 30
Table 6. Critical Facilities and Potential Flooding Indicators ................................................................. 40
Table 7. Department of Conservation and Recreation Dam Status ...................................................... 45
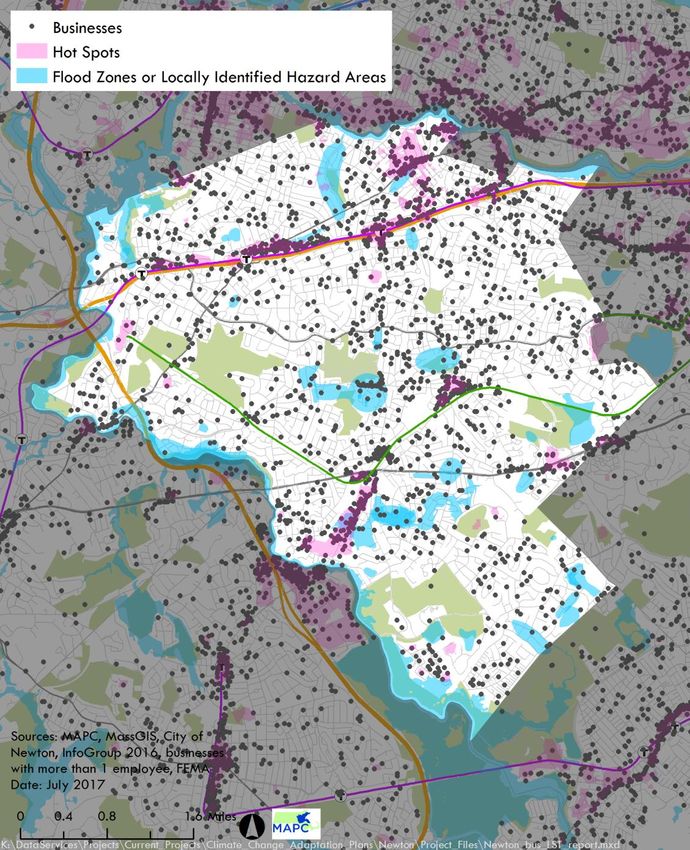
FIGURES
Figure 1. Global Temperature and CO2 Trends ........................................................................................ 3
Figure 2. Observed Temperature Change .................................................................................................. 4
Figure 3. Projected Temperature Change ................................................................................................... 5
Figure 4. Observed Sea Level Rise ............................................................................................................... 6
Figure 5. Projected Sea Level Rise ................................................................................................................ 7
Figure 6. Observed Precipitation Change ................................................................................................... 8
Figure 7. Projected Precipitation Change .................................................................................................... 9
Figure 8. Risk Analysis ................................................................................................................................... 10
Figure 9. Current Population and Projections ............................................................................................ 12
Figure 10. Senior Population by Block Group .......................................................................................... 13
Figure 11. Median Household Income by Census Tract ........................................................................... 14
Figure 12. Percentage of People of Color by Block Group .................................................................. 15
Figure 13. Country of Origin for Asian Residents .................................................................................... 16
Figure 14. Language and Linguistic Isolation ............................................................................................ 17
Figure 15. United States Weather Fatalities ............................................................................................ 18
Figure 16. Asthma Hospitalization .............................................................................................................. 19
Figure 17. Hypertension Hospitalization .................................................................................................... 19
Figure 18. Heat Impacts ................................................................................................................................ 21
Figure 19. Critical Facilities in Temperature Hot Spots ........................................................................... 22
Figure 20. Lyme Disease Incidence ............................................................................................................. 25
Figure 21. Natural Resources and Level of Protection for Open Space.............................................. 27
Figure 22. Tree Canopy ................................................................................................................................ 30
Figure 23. March 2010 USGS Charles River Gage ................................................................................ 32
Figure 24. Selwyn Road, Hurricane Diane 1955 ..................................................................................... 33
Figure 25. Newton Flood Damage Claims ................................................................................................ 34
Figure 26. Development and Rainfall......................................................................................................... 35
Figure 27. Development and Stormwater ................................................................................................. 35
Figure 28. Newton 1892 with Flood Claims ............................................................................................. 36
Figure 29. Newton 2017 with Flood Claims ............................................................................................. 37
Figure 30. Critical Facilities, Flood Zones, Identified Flooding Areas, and Historic Wetlands ........ 39
Figure 31. Projected Sea Level Rise 2070 ................................................................................................ 46
Figure 32. Businesses Locations and Climate Impacts .............................................................................. 48
INTRODUCTION
The devastating effects of Hurricanes Harvey, Irma, and Maria highlight the imperative to plan
now for future storms. As detailed in the Climate Change Background section of this report, we are
already experiencing warmer temperatures, increased precipitation, and rising seas. Precipitation
in the Boston area has increased by 10% in the past fifty years. Recently released design storm
figures (NOAA 14) for the 10-year, 24-hour storm are 15% higher than those issued in 1961.
Climate projections for this century include increased frequency and intensity of rain storms, and
more frequent days with extreme heat.

The March 2010 rains caused millions of dollars in damages in Newton and disrupted service on
the Green Line. As rainfall amounts increase, rain events similar to 2010 will become more
frequent. A one-thousand-year event would nearly double the rainfall experienced over three
days in March 2010. As is evident from Hurricane Harvey, damage and suffering from such an
extreme event is inevitable. Indeed, flooding or extreme heat, and the resultant potential for
power outages can have severe and cascading effects during far lesser storms than a one-in-one-
thousand-year occurrence.

Yet we can take steps to increase community resilience and limit future damages. Many of today’s
municipal investments and decisions have long legacies that will influence future vulnerabilities.
Advanced planning can save money, while inaction, or actions that don’t anticipate future
conditions, may lead to higher costs in the future. An example of effective planning comes from
the reports that Florida properties experienced much less damage from Hurricane Irma than from
Hurricane Andrew in 1992. This is attributed to critical improvements made to the building code
because of lessons learned from Hurricane Andrew. This report identifies future climate
vulnerabilities and suggests strategies that can reduce the risk of harm to people and properties
and help speed recovery when inevitable future storms occur.

CLIMATE CHANGE BACKGROUND
Climate Change Processes
Our climate has always been regulated by gases, including carbon dioxide, methane, and nitrous
oxide, that blanket the earth. These gases trap heat that would otherwise be reflected out to
space; without them our planet would be too cold to support life. We refer to these gases as
“greenhouse gases” (GHGs) for their heat trapping capacity. Changes in GHG concentrations
occur naturally, due to such events as volcanic eruptions, and variations in solar energy entering
the atmosphere.

                                                1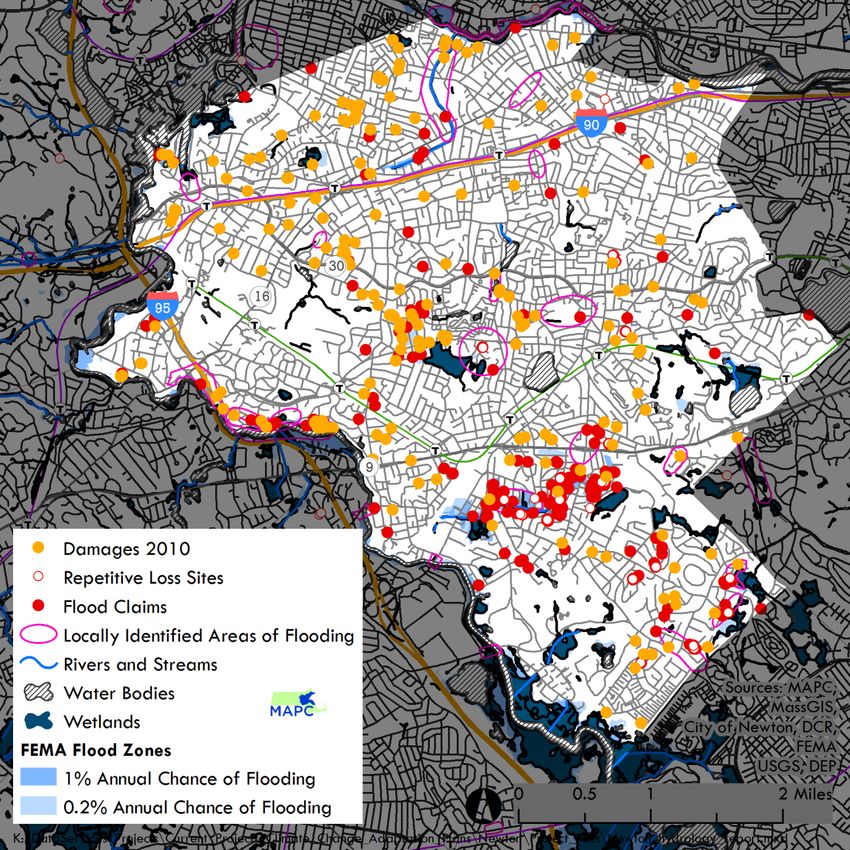
In the past century, human activity associated with industrialization has contributed to a growing
concentration of GHGs in our atmosphere. The combustion of fossil fuels, our primary energy
source in the age of industrialization, releases GHGs into the atmosphere. As shown in Figure
1, there is a correlation between increases in carbon dioxide concentrations and global
temperature. There is by now widespread consensus among scientists regarding the warming of
our climate and its causes. As stated in the Third United States Climate Report (2014): “Global
climate is changing and this change is apparent across a wide range of observations. The global
warming of the past 50 years is primarily due to human activities.” (Chapter 2, page 12)

The following sections will review climate changes that have been observed to date, and
projections of future changes. Climate change impacts are not evenly distributed across the globe.
The focus of this report is on impacts relevant to Newton. We utilize data for the Northeast United
States and, where possible, the Boston region. For those interested in more background on climate
science, the U. S. National Climate Assessment 2014 provides a very readable review. It can be
downloaded at: http://nca2014.globalchange.gov/downloads.

                                                 2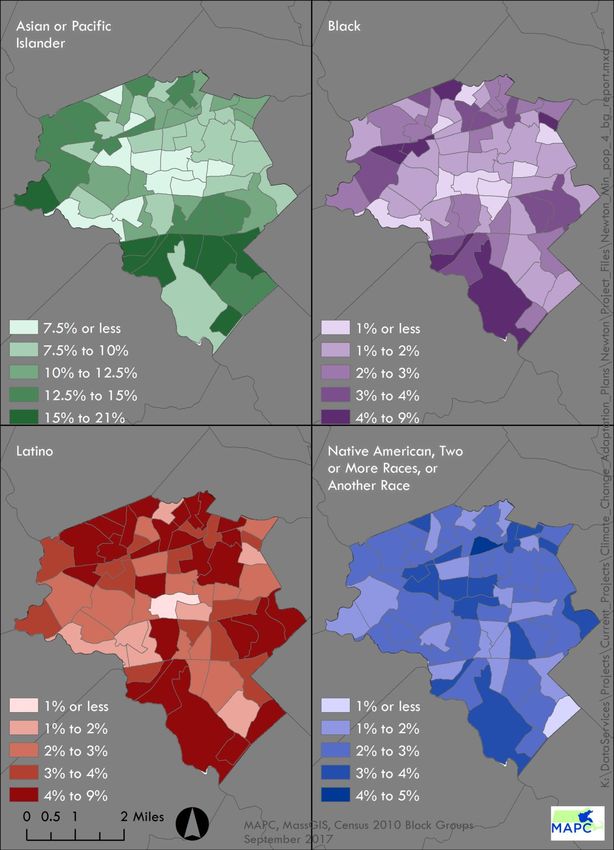
Figure 1. Global Temperature and CO2 Trends

                           Source: MA Climate Change Adaptation Report 2011

Climate Change: Observations, Projections, Impacts
Climate change observations come from a variety of data sources that have measured and
recorded changes in recent decades and centuries. Climate change projections, however, predict
future climate impacts and by their nature cannot be observed or measured. As a result of the
inherent uncertainty in predicting future conditions, climate projections are generally expressed as
a range of possible impacts. There are two primary sources of uncertainty. Scientists project future
impacts by developing models; the range of projected impacts will be smaller or larger
depending on the level of confidence in a given climate model. The other source of uncertainty is
that our future GHG emission levels are unknown. GHG levels reflect global emissions. While the
international community is investing substantial efforts in reducing GHG emissions, it is not possible
to predict future emissions levels with any certainty. As a result, climate projections often include
multiple scenarios, or a range of results, reflecting a range of future GHG levels in the
atmosphere.

Temperature
Temperature has been increasing along with GHG concentrations in the past century. According to
the US National Climate Assessment 2014, temperatures in the Northeast United States have

                                                  3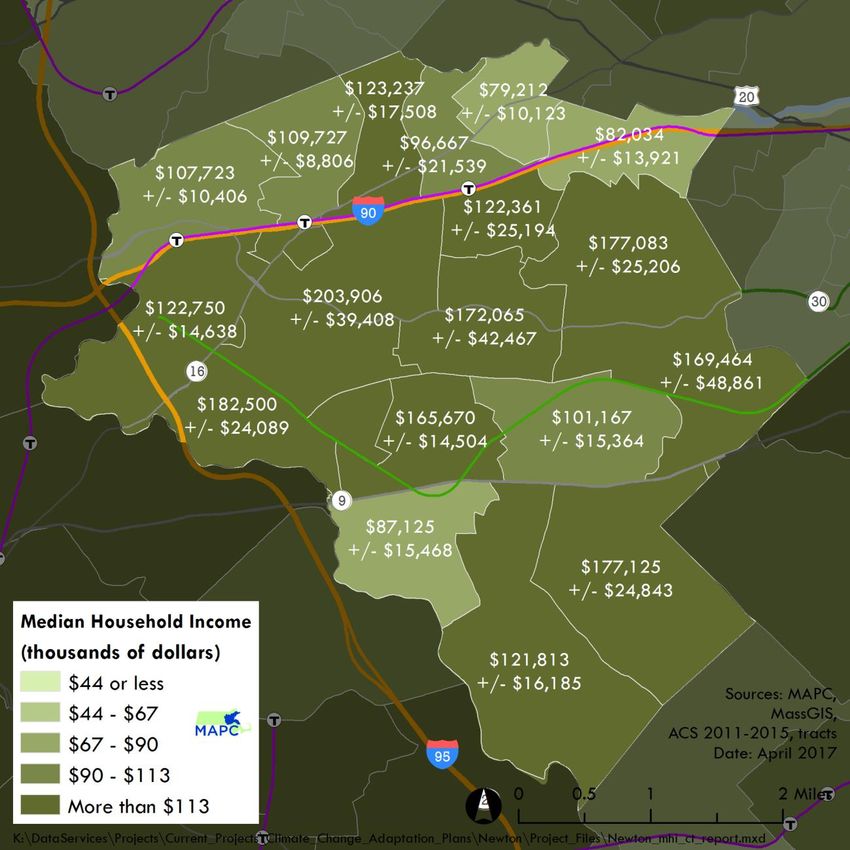
increased by almost two degrees Fahrenheit between 1895 and 2011. Data from the Blue Hill
Observatory in Milton (Figure 2) located less than ten miles from Newton, reflects this trend.

                           Figure 2. Observed Temperature Change
  For the Northeast United States: temperature increased by almost 2
    degrees, between 1895 and 2011 (US National Climate Assessment 2014)

     Blue Hill Observatory Annual Temperature, 1831-2008
            Source: Michael J. Iacono (from MA Climate Change Adaptation Report 2011

Future temperature projections for the Charles River Basin, (Figure 3) are shown below. The
projections show an increase in average temperatures and an increasing likelihood of heat waves,
as indicated by the increased number of days over 90 and 100 degrees each year. Increasing
temperatures will have important impacts on human health. Heat is the number one cause of U.S.
weather fatalities over the past decade (EPA/NOAA). Heat waves are often accompanied by
poor air quality, exacerbating chronic respiratory and cardiovascular conditions.

Rising temperatures will impact natural systems; expected impacts include changes in species and
the composition of forest and wetland habitats, an increase in invasive species and pests, and a
longer growing season. Rising temperatures also drive other impacts including changes in
precipitation patterns, and sea level rise.

                                                4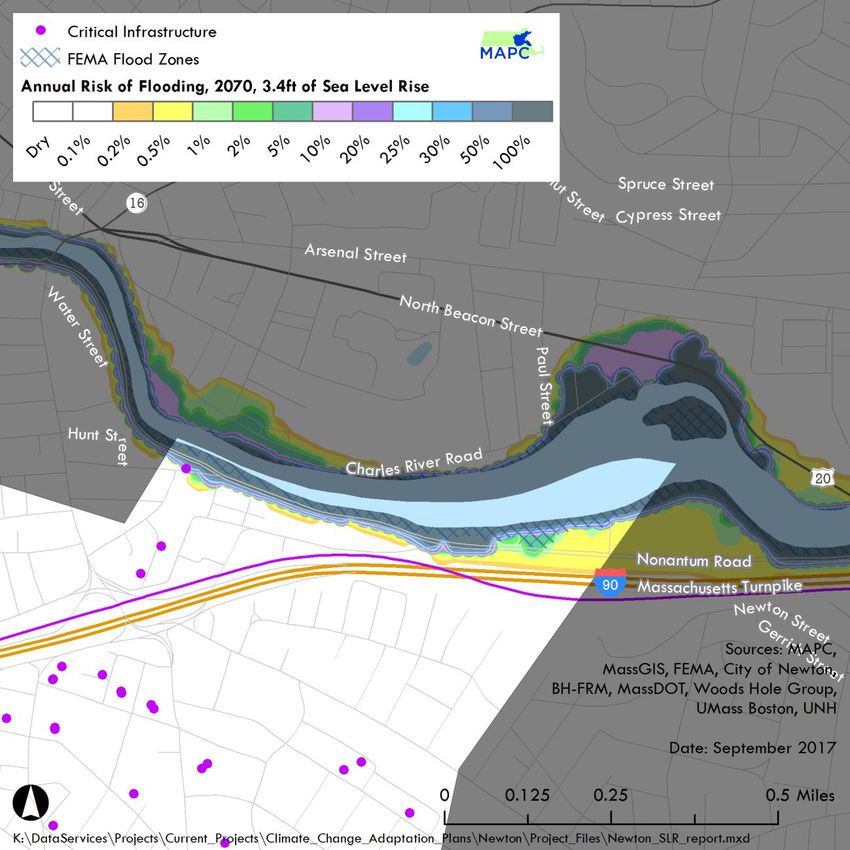
Figure 3. Projected Temperature Change for the Charles River Basin.

                        Observed
    Parameter                    Predicted Predicted Predicted Predicted
                        Baseline
  (Temperature                    2020-     2040-     2060-     2080-
                         (1971-
       F°)                         2049      2069      2089      2099
                          2000)
 Annual
                             49°            51-53°          52-55°         52-58°       52-60°
 temperature
 Winter
                             29°            31-33°          32-35°          32-37°      33-39°
 temperature
 Spring
                             47°            48-50°          49-52°         49-55°       50-60°
 Temperature
 Summer
                             70°            72-74°          73-77°         73-80°       74-83°
 temperature
 Fall
                             52°            54-57°          56-58°         55-61°       56-64°
 Temperature
 Days over 90
                               9             16-29          19-44           22-66       24-85
 (days/year)
 Days over 100
                             0.05            .29-2           .45-5          .58-11      .84-21
 (days/year)
                     Source: Northeast Climate Science Center, UMass-Amherst, 2017

Sea Level Rise
Records from the Boston Tide Station show nearly one foot of sea level rise in the past century
(Figure 4). Warming temperatures contribute to sea level rise in two ways. First, warm water
expands to take up more space. Second, rising temperatures are melting land-based ice which
enters the oceans as meltwater. The third, quite minor, contributor to sea level rise in New England
is not related to climate change. New England is still experiencing a small amount of land
subsidence (drop in elevation) in response to the last glacial period.

                                                  5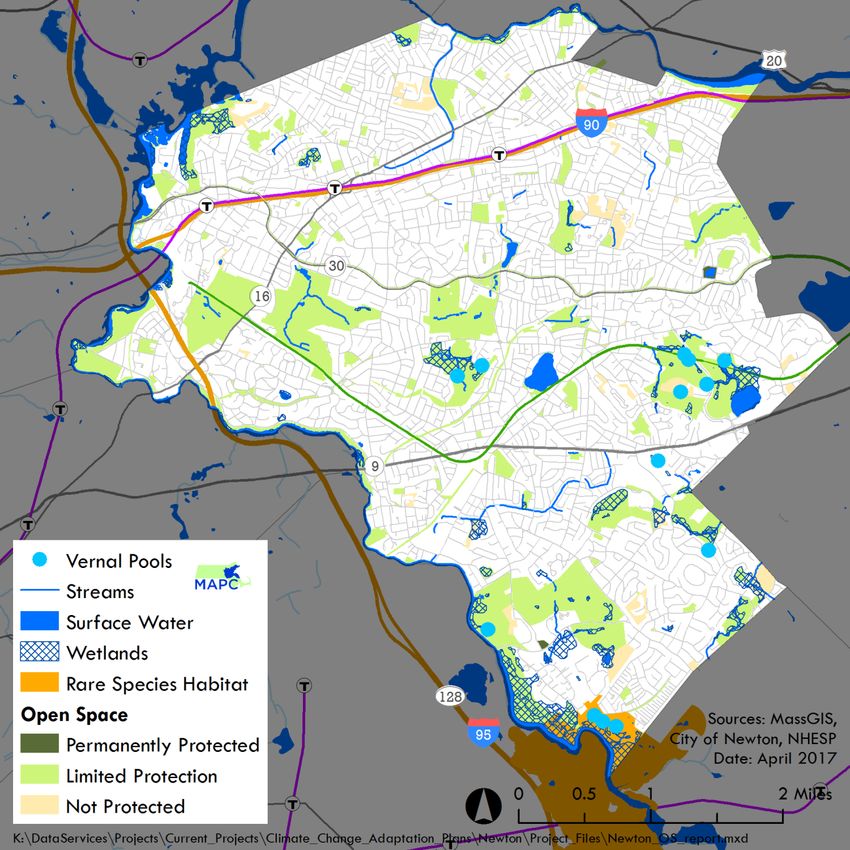
Figure 4. Observed Sea Level Rise

                              Boston Tide Station
   • Record from 1921-2016
   • Equivalent to 11 inches in 100 years

                                            Source: NOAA

The Massachusetts Office of Coastal Zone Management (CZM) adjusted global predictions for
future sea level rise, taking into account local subsidence. As is evident in Figure 5, the range of
projections for the future is quite wide, particularly approaching the end of this century. The High
scenario includes ocean warming and a calculation of maximum glacier and ice sheet melt. The
Intermediate High scenario averages higher predictions but includes lesser ice sheet melting. The
Intermediate Low considers lower sea level rise scenarios and limited ice melt. The Historic Trend
reflects a continuation of the current rate of sea level rise.

The CZM estimate for the Boston Harbor does not take into account more recent research that
suggests the Boston Harbor is included in a region that may experience greater than average sea
level rise. CZM cautions that the Historic and Intermediate Low scenarios may “considerably
underestimate actual sea level rise,” particularly for time horizons beyond 25 years. Although
Newton has no coastal shoreline, modeling utilized in this study projects that later in the century,
storm surge could travel up the Charles River and impact the Newton shoreline.

                                                  6
Figure 5. Projected Sea Level Rise
Source: Sea Level Rise: Understanding and Applying Trends and Future Scenarios for Analysis and Planning,
Massachusetts Office of Coastal Zone Management, December 2013.
Precipitation
Precipitation in Massachusetts has increased by approximately 10% in the fifty-year period from
1960 to 2010 (Figure 6). Moreover, for the Northeast US, according to the US National Climate
Assessment, 2014, in the past fifty years there has been a 71% increase in the amount of rain
that falls in the top 1% of storm events. As the atmosphere warms, it can hold more water; this
leads to an increase in large rainfall events.
Projections for future precipitation suggest an increase in total precipitation, but also changes in
precipitation patterns. Rain amounts are projected to increase in the winter and spring, but
decrease in the summer (Figure 7). As a result, despite overall increasing precipitation levels,
summer droughts may be a consequence of climate change. In addition, as noted, it is expected
that we will experience a greater number of large rain events. Another potential source of
uncommon, but significant, rain events is hurricanes. According to the National Oceanic and
Atmospheric Administration (NOAA), hurricanes may become but more intense with a projected
10-15% increase in rainfall by the end of the century.
As we experienced in 2016, drought can strain water supplies and stress plant and aquatic
communities. Increasing winter/spring precipitation, along with warmer weather resulting in more
7rain rather than snow, is expected to create additional flooding early in the year, and low-flow in
rivers and streams in the summer.
Figure 6. Observed Precipitation Change
For the Northeast United States:
• 71% increase in the amount of
rain that falls in the top 1%
events from 1958 – 2012.
Source: US National Climate Assessment 2014
For the Boston area:
10% increase over
The past 50 years
Source: MA Climate Change Adaptation
Report 2011
The observed changes in precipitation are also reflected in changing precipitation frequency
estimates. Precipitation frequency estimates, used to derive design storm standards, were
published in 196l by the U.S. Commerce Department in a document known as TP-40 (Technical
Paper 40). The National Oceanic and Atmospheric Administration (NOAA Atlas 14) and the
Northeast Regional Climate Center (NRCC) at Cornell University have recently published updated
estimates. The TP-40 100-year storm calculated in 1961 is now approximately equal to a 30-
year storm as calculated by NRCC and NOAA Atlas 14 (MWRA). TP-40 figures are less precise,
reflecting data available at the time. The NOAA 14 and NRCC figures are specific to Newton.
Table 1. Design Storm Estimates
Newton TP-40 NRCC
10-year, 24-hour storm 4.5” 5.13”
100-year, 24-hour storm 6.5” 8.88”
8Figure 7. Projected Precipitation Change
Current
Predicted Change Predicted Change
Parameter Conditions
by 2050 by 2100
(1961-1990)
Low High Low High
Annual
41 inches + 5% + 8% + 7% + 14%
precipitation
Winter
precipitation 8 inches + 6% + 16% + 12% + 30%
Summer
11 inches - 3% -1% 0% -1%
precipitation
Source: MA Climate Adaptation Report 2011
The cities of Boston and Cambridge projected future conditions for the 10-year, 24-hour design
storm as part of their climate vulnerability assessments. Their projections for increased
precipitation are shown in Table 2.
Table 2. 10-year 24-hour Design Storm Projections
Boston Water and Sewer Baseline Precipitation (inches)
Commission (1948-2012) 2035 2060 2100
Medium emission scenario 5.55” 5.76” 6.08”
5.24”
High emission scenario 5.6” 6.03” 6.65”
(1971-2000) 2015-2044 2055-2084
Cambridge
4.9” 5.6” 6.4”
Source: Climate Ready Boston, Boston Research Advisory Group Report, 2016
WHY UNDERTAKE A CLIMATE VULNERABILITY ASSESSMENT FOR NEWTON?
This climate vulnerability assessment is an effort to determine which Newton community assets –
people, natural resources, and physical infrastructure – may be susceptible to harm from climate
change. Climate vulnerability assessments generally consider:
Exposure – whether climate changes will have a negative effect on various assets in the
community.
Sensitivity – if affected by climate change, how much damage, or loss of function will
occur.
9 Adaptive Capacity – sensitivity will be lessened, or heightened, by the degree to which
there may be ways for the community asset to cope, compensate, or be modified, to
adjust to climate changes.
Once vulnerabilities are identified, they can be prioritized according to the perceived risk they
present. Generally, this involves considering the probability of damage to an asset and the
consequences of damage. As an example, flooding to a sewer pump station and open space
might be equally likely, but the pump station would presumably have higher priority as the
consequence of failure is more severe. This strategy for considering risk is shown in Figure 8.
Figure 8. Risk Analysis
For the most part, projected climate impacts do not create brand new concerns, rather they are
an intensification, increased frequency, or geographic expansion, of existing challenges including
flooding, heat waves and drought. As a result, Newton already has significant experience and
expertise to bring to these challenges. Further, many initiatives to address climate impacts provide
benefits to the City (tree planting, open space preservation), can help address City obligations
(MS4 permit compliance), or combat already identified problems (flooding). Although disruptive
storms may occur at any time, most of the predicted climate changes are happening relatively
slowly over time. Identifying future vulnerabilities now gives the City of Newton time to plan for
and enact projects and policy changes that will make for a more resilient community in the future.
SOCIOECONOMIC VULNERABILITY
Just as some locations in Newton will be more vulnerable to climate impacts than others, it is also
the case that climate change will not affect all residents of Newton equally. In the context of
climate change, vulnerable populations include those who may be more susceptible to climate
impacts, and those who will have more difficulty adapting to, preparing for, and recovering from
extreme weather events. Our demographic analysis indicates that a number of identified
vulnerable populations have been growing or are projected to grow over time. These include
seniors, individuals living alone, people of color, young children, and people with limited English
proficiency. Socioeconomic vulnerability influences susceptibility to illness or injury and capacity to
10meet ones basic needs following extreme weather. Individuals can simultaneously experience
multiple socioeconomic vulnerabilities that can magnify the extent to which they are affected by
climate change.
Socioeconomic vulnerability refers to socioeconomic characteristics, such as income and
race/ethnicity that influence vulnerability to climate change. Low-income communities often have
limited access to healthcare services and have higher rates of uninsured people. Low-income
people are often more susceptible to financial shocks, which can occur after extreme weather,
and which can have long-lasting impacts on financial security and the ability to secure safe shelter
and meet medical needs. Furthermore, people who lack financial resources may have limited
access to transportation. This can impair their ability to relocate to emergency shelters or away
from areas susceptible to climate impacts. Social isolation can also influence vulnerability, as it
limits access to critical information, municipal resources, and social support systems that can bolster
emergency response. People at the most risk for social isolation include those living alone, people
of color, and people with limited English language proficiency. People of color and undocumented
immigrants may also experience social isolation due to historically strained or tenuous
relationships with government officials and first responders.
Environmental conditions can also exacerbate the impact of severe weather. Neighborhood
environmental quality has been found to be strongly associated with socioeconomic composition.
Environmental justice communities – neighborhoods with a high concentration of low-income
people, people of color, and people with limited English language proficiency – are often more
vulnerable to climate impacts. This is because of the higher prevalence of environmental burdens
(i.e., noxious and industrial land uses), which lead to worsened environmental quality and higher
incidence of chronic diseases. Housing conditions are also an important facet of environmental
vulnerability. Not only are low-income people more likely to live in substandard housing, it is more
financially challenging for them to make their homes more resilient to climate change and to fix
damage caused by extreme weather.
SOCIOECONOMIC CONDITIONS IN NEWTON
Demographic information helps identify populations that may be particularly affected by climate
change. It can also provide opportunities to build upon existing strengths in order to enhance
resiliency. Understanding a community’s character, socioeconomic makeup, and environmental
features is important to fully understanding the implications of climate impacts on the cities’
population.
Age
Newton’s population has been growing since 1990 and will continue to grow over the coming
decades. In 2010, Newton’s population was just over 85,000, with approximately 5% children
below the age of five, and 15% of residents over 65 years of age (Census 2010). The villages of
Thompsonville, Waban, Nonantum, and Newton Corner contain block groups with over 30%
seniors. According to the MAPC “Stronger Region” scenario, in which Metro Boston will retain a
vibrant economy even as baby boomers retire, MAPC projects that by 2030, Newton’s total
11population will grow modestly by 5% to over 89,000 people. Over the same period, Newton’s
population will age. MAPC projects that by 2030, the senior population will increase by 63%
(Figure 9).
Figure 9. Current Population and Projections
As of 2010, approximately 26% of Newton’s households consisted of people living alone (Census
2010). People 65 years of age and older were disproportionately represented in this population,
accounting for more than 51% ± 3% of residents living alone (ACS 2011-2015). Currently,
several block groups in Newton have more than 25% of their population over the age of 65.
These areas are in the Chestnut Hill Village and Waban neighborhoods (Figure 10). Two block
groups nearest to Boston College have the lowest percentage of population over the age of 65.
12Figure 10. Senior Population by Block Group
Income
The median household income in Newton is $122,080 +/- $4,102 as compared with $75,389
+/- $428 for Metro Boston (ACS 2011-2015). While Newton as a whole is wealthier than Metro
Boston, segments of the population still struggle to meet their basic needs. According to the US
Census (2015), a household income of $24,257 or less for a family of four is considered living in
poverty. According to the ACS, 6% (±1%) of Newton households are living in poverty. In Newton,
Black residents are more likely to live in poverty than White residents (23% ± 14%, and 4% ±
1%, respectively, ACS 2011-2015). Differences in poverty rates between residents of other races
are not statistically significant. It is not reliable to map poverty at the census tract or block group
level due to high margins of error, but it is possible to identify areas where income is lower than
13the city average. As shown in Figure 11, relatively lower income areas of the city include
Nonantum, Newton Corner, and Newton Upper Falls.
Figure 11. Median Household Income by Census Tract
Race and Ethnicity
Newton is becoming more diverse. In 2000, people of color were 14% of the total population. By
2010, that number had grown to 20%. The percentage of Asian residents increased the most,
going from 8% to 12%. In 2010, 4% of the population was Latino, 2% percent was Black, and
the remaining 2% was Native American, multi-racial, or other races. Figure 12 shows the
14Figure 12. Percentage of People of Color by Block Group
15percentage of people of color by 2010 census block group. Figure 13 displays the country of
origin for residents from Asia.
Figure 13. Country of Origin for Asian Residents
Language and Linguistic Isolation
The percentage of Newton households that speak a language other than English in the home has
increased over time. According to the 2000 Census, 23% of households spoke a language other
than English; by 2011-2015 (ACS) that proportion increased to 31%. As the percent of
households speaking another language at home has increased, the proportion of limited English
speaking households has increased as well. “Limited English speaking households,” formerly known
as “Linguistically isolated households”, have no household members age 14 or older who speak
English very well. Other languages spoken at home include: Chinese languages (5,470 ± 660),
Spanish or Spanish Creole (3,153 ± 245), Russian (2,963 +/- 493), and Korean (1,193 +/-219).
In Newton, Asian and Latino residents are much less likely to speak English very well than residents
of any other race (29% ± 3% and 14% ± 4% respectively, ACS 2011-2015). City records for
households with flood damage in 2010 indicated that 2.5% of respondents of Asian background
and 2.5% of respondents of Russian background had difficulty communicating in English. Reliable
data regarding geographic distribution of residents based on language and linguistic isolation
are not available.
16Figure 14. Language and Linguistic Isolation
Language spoken at home Language spoken at home
and limited English and limited English
speaking households in speaking households in
Newton Newton
Census 2000 ACS 2011-2015
19%
4% 5%
26%
69%
77%
English speaking households English speaking households
Households speaking another Households speaking another
language language
The demographic analysis provides indications of where higher concentrations of vulnerable
residents may be located. Yet it is important to recognize that residents with heightened
vulnerability to climate impacts reside throughout the City.
CLIMATE IMPACTS ON PUBLIC HEALTH
Climate change is expected to have an impact on public health across socioeconomic status and
geography. Extreme weather events can increase stress, which can worsen or cause new physical
and mental health conditions. An individual’s vulnerability to the public health impacts of climate
change is influenced by personal behaviors, environmental quality, housing quality, social
connectivity, and access to resources. Socioeconomic characteristics may limit access to information,
medical equipment, and healthcare. Low-income people and linguistically-isolated households are
most vulnerable to this threat.
Seniors, young children, people with disabilities, and people with pre-existing health conditions,
are most physically vulnerable to the health impacts of climate change. Individuals with physical
17mobility constraints, such as people with disabilities and seniors, may need additional assistance
with emergency response. In Newton, approximately 8% ± 1% of the civilian non-institutionalized
population has a disability (ACS 2011-2015). As the population in Newton ages, it is likely that
the percentage of the population with a disability will rise. In Massachusetts, over 20% of the age
65 to 74 population has a disability, that figure jumps to nearly 50% for those 75 and older. By
comparison, just over 10% of adults aged 35 to 64 have a disability. Reliable data regarding
the geographic distribution of residents with disabilities is not available.
Extreme Heat
The projected increase in extreme heat and heat waves is the source of one of the key health
concerns related to climate change. Heat was the leading cause of weather fatalities in the United
States over the past decade (Figure 15). As noted earlier, the Northeast Climate Science Center
projects 24 to 85 days over 90°F, and .84 to 21 days over 100°F annually, by the end of this
century.
Figure 15. United States Weather Fatalities
Source: EPA and NOAA
Prolonged exposure to high temperatures can cause heat-related illnesses, such as heat cramps,
heat exhaustion, heat stroke, and death. Heat exhaustion is the most common heat-related illness
and if untreated, it may progress to heat stroke. People who perform manual labor, particularly
those who work outdoors, are at increased risk for heat-related illnesses. Prolonged heat
exposure can also exacerbate pre-existing conditions, including respiratory illnesses,
cardiovascular disease, and mental illnesses. The senior population is often at elevated risk due to
a high prevalence of pre-existing and chronic conditions. People who live in older housing stock
(as is often the case with public housing), and in housing without air conditioning have increased
vulnerability to heat-related illnesses. Power failures are more likely to occur during heat waves,
affecting the ability of residents to remain cool during extreme heat. Individuals with pre-existing
conditions and those who require electric medical equipment may be at increased risk during a
18power outage. Loss of refrigeration can result in food-borne illnesses if contaminated food is
ingested.
Figure 16. Asthma Hospitalization
Figure 17. Hypertension Hospitalization
19Extreme heat can contribute to greater levels of ground level air pollution and allergens. The
poor air quality and high humidity that often accompany heat waves can aggravate asthma and
other pre-existing cardiovascular conditions. Anyone who does outdoor physical activity during
hot days with poor air quality is at increased risk for respiratory illness. Low-income people and
people of color may also be at increased risk because these populations have a higher
prevalence of chronic disease. While Newton residents are hospitalized for asthma at a lower
rate than are Massachusetts residents as a whole, hospitalizations for Black and Latino residents
are higher than for White and Asian/Pacific Islanders in Newton (Figure 16). Data for Native
Americans, two or more races, and other races were not available. Similarly, Newton residents
have a lower rate of hypertension hospitalization than the Massachusetts average, but residents
of color are hospitalized for hypertension at a higher rate than white residents (Figure 17). Data
for hypertension hospitalization rates for Latinos, Native Americans, two or more races, or other
races were not available.
Due to what is termed the “heat island effect,” areas with less shade and more dark surfaces
(pavement and roofs) will experience even hotter temperatures: these surfaces absorb heat
during the day and release it in the evening, keeping nighttime temperatures warmer as well.
Figure 18 displays land surface temperature derived from satellite imagery on July 13, 2016,
when the high temperature at Logan Airport was 92°F. It is important to note that air temperature
just several feet above the ground differs from ground temperature. The range of land surface
temperatures is much greater than that of air temperatures. Black pavements can attain
temperatures far higher than the air temperature several feet above the ground. In contrast,
vegetation or water can be much cooler than air temperatures. Thus, the air temperature people
experience will not be as hot as the hottest temperatures shown, nor as cool as the coolest areas
shown.
The temperature display reveals that the hottest areas in Newton coincide, for the most part, with
locations that are zoned for commercial and industrial use. Given the generally suburban nature
of the residential areas in Newton, this is not surprising. There are, however, some residential
locations, particularly the multi-residence-zoned areas in Nonantum that are identified as “hot
spots”: part of the hottest 5% of land area in the MAPC region. Residential locations adjacent to
business or industrial areas along the Mass Pike and elsewhere are included in the identified hot
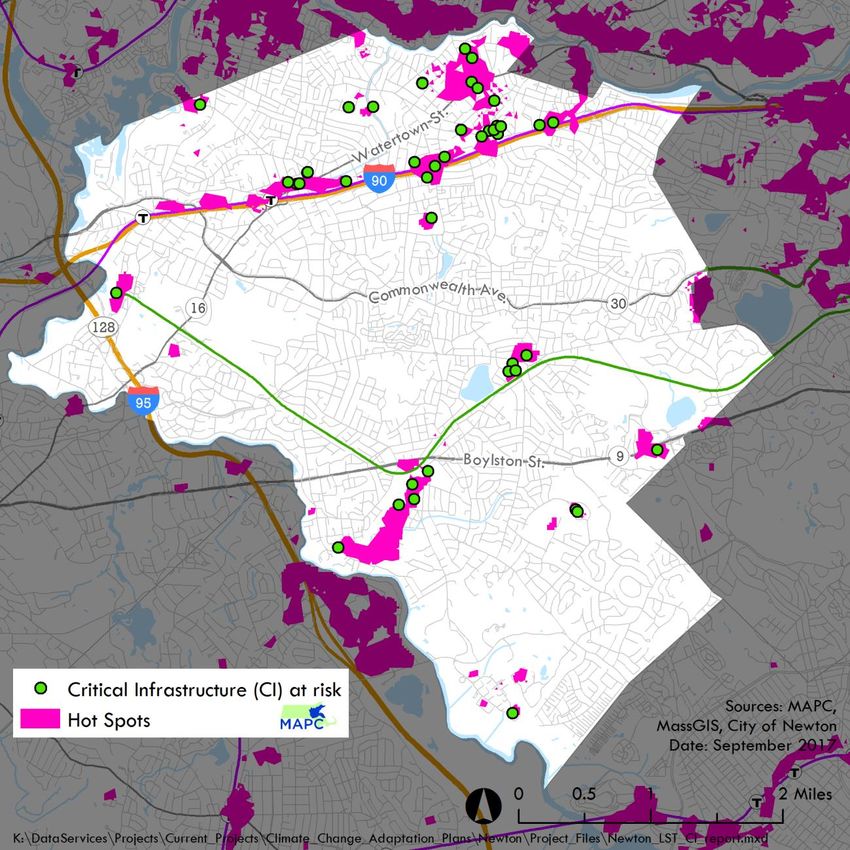
spots. Figure 19 and the accompanying Table 3 identify critical facilities in hot spot locations.
20Figure 18. Heat Impacts
Land Surface Temperature on July 13th, 2016, when high temperature at Logan Airport was
92 degrees Fahrenheit.
21Figure 19. Critical Facilities in Temperature Hot Spots
Hot spots identify the hottest 5% of land area in the MAPC region.
22Table 3. Critical Facilities in Temperature Hot Spots
Facility Location Type
Avalon at Upper Falls 99 Needham Street Affordable Housing
Avalon at Chestnut Hill 160 Boylston Street Affordable Housing
Chestnut Street 1202 Chestnut Street Affordable Housing
West Street 19 West Street Affordable Housing
Newton Homebuyer Assistance Program 12 Green Court Affordable Housing
Scattered Sites 457 Washington Street Affordable Housing
Genesis House (Genesis II) 295 Adams Street Affordable Housing
Army National Guard Armory 1137 Washington Street Armory
Activity Academy Inc./ West Newton School 25 Lenglen Road Child Care
Close To Home Children's Center, Inc. 144 Bridge Street Child Care
Little Red Wagon Playschool 56 Winchester Street Child Care
Newton Community Service Centers 492 Waltham Street Child Care
Golden Days Children's Center 66 Needham Street Child Care
The Evan Baptist Church 23 Chapel Street Church
Italian Pentecostal Christian Church 150 Lowell Avenue Church
First Baptist Church in Newton 1299 Centre Street Church
Sacred Heart Church 1321 Centre Street Church
Lutheran Church of the Newtons 1310 Centre Street Church
Verizon Telephone Building 787 Washington Street Communication Tower
NEW TV 23 Needham Street Communication Tower
Newtonville MBTA stop Commuter Rail Station
Newton Center Municipal Lot 797 Beacon Street Distribution Site
Austin Street Municipal Lot 34 Austin Street Distribution Site
Our Lady Parish Parking Lot 573 Washington Street Distribution Site
Newton Police Headquarters 1321 Washington Street Emergency Operations Center
Rumford Avenue Recycling Center 125 Rumford Avenue Hazardous Material Site
Silent Spring Information Center 29 Crafts Street Library
Newton History Museum Library 527 Washington Street Library
Higher Education Center Library 55 Chapel Street Library
Crafts Street DPW Yard 90 Crafts Street Municipal
Newton District Court 1309 Washington St Municipal
Albemarle Field House 250 Albermarle Road Municipal Facilities
Newton Community Service Center 492 Waltham Street Municipal Facilities
Carr School 225 Nevada Street Municipal Facilities
MBTA Riverside Line Electric Station 1 389 Grove Street Power Substation
Burr School 171 Pine Street School
EDCO Collaborative - N.E.W. Academy 429 Cherry Street School
Fessenden School 246 Waltham Street School
Trinity Catholic High School 575 Washington Street School
Newton South High School 140 Brandeis Road School/Shelter
Solomon Schecter Upper School 125 Wells Avenue School
Jewish Community Day School 25 Lenglen Road School
Angier Elementary School 225 Nevada Street School
Newton North High School 457 Walnut Street School
*Items shown in bold are also listed in Table 6 as potential flooding locations.
23Increased Precipitation & Flooding
As previously noted, climate change is expected to bring increased precipitation and changing
precipitation patterns to Massachusetts. Heavier winter and spring storms can cause localized
flooding and water damage to buildings – and the formation of mold. Chronic mold is an existing
problem in Newton, particularly in public housing, senior housing, and in buildings built before the
1980s. Mold triggers allergies and respiratory illnesses, such as asthma. Some strains of mold
release airborne toxins, called mycotoxins, which can cause mold toxicity. Mold toxicity can
influence the function of internal organs, the nervous system, and the immune system.
Heavy precipitation and flooding can also lead to health-threatening water contamination,
including bacteria, viruses, and chemicals that cause gastrointestinal diseases, dermatological
conditions, toxicity/poisoning, and other illnesses. Heavy precipitation can cause pollutants to be
washed into water bodies and can also overwhelm infrastructure, leading to sewage back-ups
and overflows. Often people come into contact with contaminated water when it floods onto their
property, but contact with contaminated water through recreation can be dangerous too. In recent
years, Crystal Lake has experienced closures due to high E. coli and cyanobacteria levels. If
water damage results in a loss of power, residents could be disconnected from telecommunications
during a medical emergency, putting at risk residents reliant on electric medical equipment.
Vector Borne-Illnesses
Vector-borne illnesses are those that stem from contact with vectors such as mosquitos and ticks.
The spread of vector-borne illnesses is influenced by vector type, weather conditions, built
environment conditions, and human behavioral factors. The two most common mosquito-borne
illnesses in Massachusetts are eastern equine encephalitis (EEE) and West Nile virus (WNV).
Mosquito species present in Newton have been found to carry WNV. As climate change is
expected to bring heavy precipitation events (which increase areas of standing water) and
warmer temperatures, it is expected that mosquito populations will grow and that the transmission
season will extend beyond its traditional late spring through early fall. Warmer temperatures
also accelerate a mosquito’s lifecycle and increase their biting rates.
Tick-borne illnesses, particularly Lyme disease, babesiosis, and anaplasmosis have been on the
rise in Massachusetts. From 1991-2014, there has been an average increase of 59 cases of Lyme
disease per 100,000 people (Figure 20). Winter frost plays an important role in limiting tick
populations; warmer winter may lead to more nymphs surviving into the spring months. As with
mosquitos, warmer temperatures can lead to longer transmission seasons as ticks begin to seek
hosts earlier in the season. Tick populations thrive with increased precipitation and humidity and
may be more susceptible to annual fluctuations in precipitation than mosquitos.
Forecasting the spread of vector-borne illnesses and estimating risk due to climate change is very
challenging, due to multiple factors at play. For example, research suggests that heavy
precipitation in urbanized areas could actually reduce mosquito populations by flushing
underground breeding habitat. Further, vector populations’ size and range is dependent on the
size and range of their host species (i.e., migratory birds, mice, and deer), which may shift as the
24climate changes. As the climate gets warmer, tropical vector species may expand their ranges
north, which could bring with them vector-borne illnesses not typically found in the Northeast (i.e.,
dengue fever or chikungunya). As vector-borne disease outbreaks occur globally, residents may
import vector-borne illnesses acquired during trips to other countries.
People who spend a lot of time outdoors, or live close to vector habitats, are at greatest risk of
exposure to vector-borne illnesses. The ability to protect oneself from mosquito-borne illnesses has
been associated with socioeconomic status via housing conditions. Households that can afford air-
conditioning and maintenance of windows/screens are less likely to come into contact with
mosquitos in their home. Those most likely to experience severe vector-borne illnesses are children,
people over the age of 50, and people with compromised immune systems.
Figure 20. Lyme Disease Incidence
25NATURAL RESOURCES AND CLIMATE RESILIENCE
Newton’s natural resources lessen climate impacts by absorbing and storing carbon dioxide and
by serving vital protective functions. Many natural resources will be challenged by heat, droughts,
and storms. Forests, open space, wetlands, rivers, and streams serve important functions, from
providing clean drinking water, to flood control, to giving relief from extreme heat. Healthy
ecosystems will be more resistant to stresses a changing climate may bring, including disease,
invasive plants, and storm damage. Healthy ecosystems will also be better able to protect against
heat and flooding. Natural resource conservation and preservation can provide economic
benefits, for individuals and the City, by reducing the costs associated with addressing damage
from climate impacts. As an example, utilizing natural areas to absorb stormwater can reduce the
need for costly pollution abatement and for stormwater infrastructure.
Mitigation
Climate mitigation refers to efforts to reduce or prevent the emission of GHGs. Newton’s forested
areas and trees provide significant mitigation. Trees help reduce the amount of carbon dioxide in
the atmosphere because they absorb carbon dioxide from the air and convert it into carbon that
is stored in their trunks, roots, and foliage. In 2005, forests throughout Massachusetts were
estimated to sequester nearly 85 million metric tons of carbon, or about 13.3% of all carbon
emissions in the region. Trees also reduce energy demand from air conditioners when they directly
shade buildings.
Protection
Heat
Our natural resources provide protection from climate threats in a wide variety of ways. Trees
are important in mitigating the impact of heat waves. According to the EPA, suburban areas with
mature trees are 4-6 degrees cooler than new suburbs without trees. Shaded surfaces can be 25-
40 degrees cooler than the peak temperatures of unshaded surfaces. Vegetated surfaces of all
types are cooler than pavement and rooftops.
Flooding
As will be detailed in following sections, flooding is already a significant issue in Newton, and one
that is projected to worsen with climate change. Existing wetlands, as well as forests and other
open lands, soak up and store rain waters, reducing flooding to streets and homes. Maintaining
open space in floodplains allows the land to absorb the brunt of flooding without impact to homes
and infrastructure.
Trees also absorb remarkable quantities of precipitation. Research has shown that a typical
medium-sized tree can intercept as much as 2,380 gallons of rain per year (USDA Forest Service).
Intercepted rainfall lands on tree leaves and is stored or evaporated back into the atmosphere.
This reduces the stormwater runoff and flooding.
26CLIMATE IMPACTS ON NATURAL RESOURCES
Aquatic and Wetland Resources
Aquatic resources will be affected by warmer temperatures and by changes in the timing and
amount of precipitation. Rain has a negative effect on water quality, because it flushes ground
pollutants – everything from dog waste, to oils on the road, to sand – into rivers, streams, and
ponds. Large rain events can also cause sewage overflow into waterways when sewer systems
become inundated with rainwater and unable to handle the flow. Finally, large rain events can
increase erosion and scour stream beds.
Figure 21. Natural Resources and Level of Protection for Open Space
27The combined effects of washing nutrients into lakes and ponds and warmer summer temperatures
may lead to an increase in the growth of aquatic vegetation. Such growth can deplete dissolved
oxygen and lead to die-offs of aquatic animals. Additionally, excessive aquatic vegetation can
make water bodies unpleasant for recreational use. Algae blooms can also lead to growth in
toxic bacteria that makes water bodies unsafe for use by humans and pets.
An increase in summer heat and drought, combined with earlier spring run-off due to warmer
temperatures and a shift from snow to rain, can lead to warmer waters and seasonal low-flow or
no-flow events in rivers and streams. Shallower waters and warmer temperatures also lead to low
levels of dissolved oxygen, with negative effects on fish species. If dry conditions persist, wetlands
could shrink in area or lose some of their absorptive capacity and be more prone to runoff and
erosion.
According to the Open Space and Recreation plan, Newton’s aquatic resources include 14 lakes
and ponds, 22 streams and brooks, and the Charles River, amounting to 276 acres or 2.4% of
Newton’s total area. Wetlands total 258 acres for an additional 2.3% of Newton’s land area.
These resources have been heavily affected by development. Wetland acreage has been
reduced to less than 20% of the approximately 1,470 acres existing in 1897, and water quality
has been compromised by stormwater runoff.
As part of compliance with the federal Clean Water Act, Massachusetts must evaluate whether
water bodies meet water quality standards. As shown in Table 4, in the 2014 “Final Listing of the
Condition of Massachusetts’ Waters Pursuant to Sections 305(b), 314 and 303(d) of the Clean
Water Act,” most of the assessed water bodies in Newton do not meet water quality standards
for E. coli, phosphorous, and other impairments. Hammond Pond has not been assessed for all
uses, but was identified as attaining uses including: Aesthetic, Fish Aquatic and Wildlife, and
Secondary Contact Recreation. Crystal Lake was not assessed. Newton’s other streams and ponds
are not included in the assessment.
Many of these impairments may be further exacerbated by climate changes. Newton has made
significant investments in water quality. In particular, through elimination of illicit and indirect
connections, the City estimates it has reduced 4,500 gallons per day of sewage that previously
entered storm drains. Wetlands and their buffer areas are protected under the Wetland
Protection Act as well as by City ordinance. Approximately 77 acres of wetlands are located in
protected open space.
Table 4. Water Quality Impairments
Waterbody Impairment
Cheese Cake Brook dissolved oxygen saturation, E. coli, phosphorous, excess algal growth
South Meadow Brook dissolved oxygen, E. coli, phosphorous, turbidity
Bullough’s Pond excess algal growth, nutrient/eutrophication
Sawmill Brook dissolved oxygen, E. coli, organic enrichment (sewage), phosphorous,
chloride, turbidity
Charles River E. coli, nutrient/eutrophication, phosphorous, DDT, PCB in fish tissue,
28Forests and Trees
Warming temperatures are expected to change the composition of forests as trees adapted to
more northern climates decline and those adapted to warmer climates increase in abundance. As
an example, maples are expected to decline, while oaks become more abundant. Increasing
intensity and frequency of weather events, including ice storms, drought and wildfire, can weaken
and damage trees. Forests may also be subject to new pests and diseases brought by warmer
climates.
The City estimates that approximately 20% of its land is Open Space. This includes protected and
unprotected private and public land (Figure 21). The Recreation/Open Space Plan (ROSP)
identifies larger wooded areas, including the Webster Conservation, Hammond Woods and
Temple Mishkan Tefila land in Chestnut Hill; East and West Kessler Woods, the Saw Mill Brook
Conservation Area and Bald Pate Meadows in Oak Hill; Auburndale Park and Flowed Meadow
in Auburndale; and Dolan Pond Conservation Area in West Newton. These larger and connected
areas are valuable as they provide greater resilience and protection for plant and animal
species impacted by climate changes.
The ROSP indicates that there are approximately 1,200 acres of forested land, but notes that this
acreage has declined by over 20% in the last 25 years. The ROSP cites an even steeper decline
in street trees, down 35% to approximately 26,000 trees from 40,000 in the early 1970’s. City
officials estimate Newton is currently losing street trees at the rate of 800 per year.
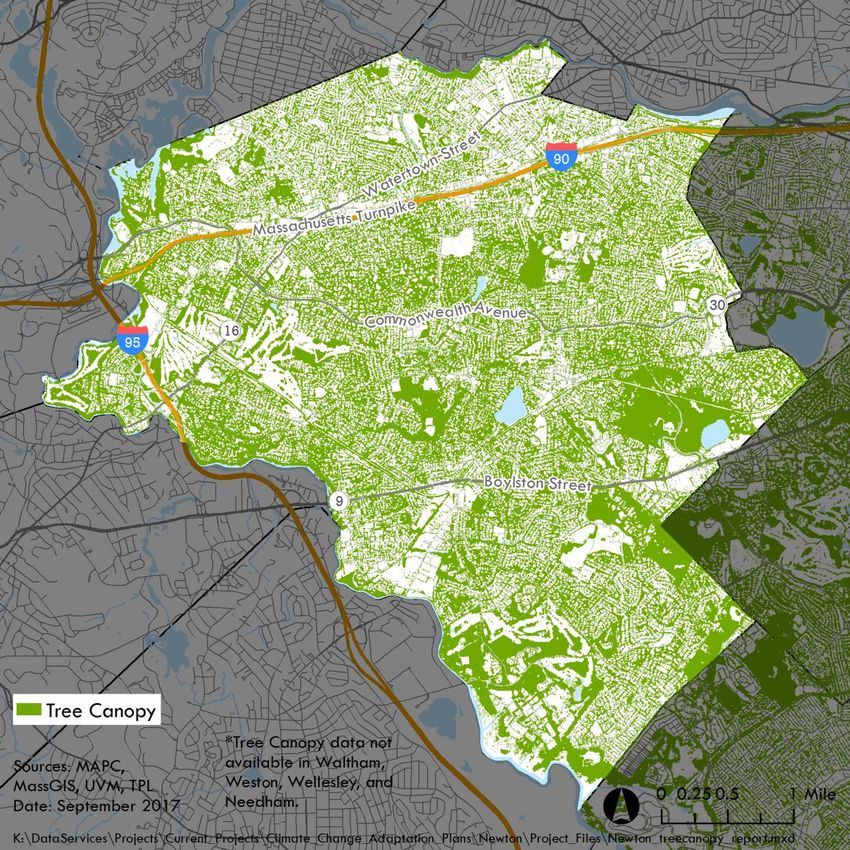
Using tree canopy data create by the University of Vermont based on remote sensing data, we
estimate that tree canopy covers 48% of total land in Newton (Figure 22). Table 5 provides tree
canopy data by land use category.
The USDA Forest Service has created a peer-reviewed web based software tool called i-Tree
that quantifies the value of ecological services trees provide. The i-Tree software estimates the
value of carbon storage, air pollution removal, and stormwater runoff reduction provided by
trees. Their estimates underscore the value and importance of forests and street trees in providing
climate mitigation and resilience. The estimated value of carbon storage in Newton’s tree canopy
exceeds $22 million, while the estimated value of annual carbon sequestration (tree growth minus
loss due to decomposition and mortality) is over $600,000. Estimates of annual air pollution
removal include 2,848 pounds of carbon monoxide, 73,467 pounds of nitrogen dioxide, 208,445
pounds of ozone, 15,158 pounds of sulfur dioxide, and 36,881 pounds of particulate matter. For
stormwater runoff i-Tree estimates that 90 million gallons per year is avoided due to transpiration
and interception of rainfall. The value of the reduced runoff is estimated at over $800,000
annually. Information on the methodology for these estimate is available at
https://landscape.itreetools.org/references/.
29You can also read