CIO Strategy Bulletin | July 11, 2021 - Citi Private Bank
←
→
Page content transcription
If your browser does not render page correctly, please read the page content below

Citi Global Wealth Investments

CIO Strategy Bulletin | July 11, 2021
Learning to Appreciate Dividends Again
David Bailin, Chief Investment Officer and Global Head of Investments
Steven Wieting, Chief Investment Strategist & Chief Economist
Joseph Fiorica, Head – Global Equity Strategy
Mark Mitchell, Citi Investment Management

Summary

    •   The strongest annual returns for this new economic cycle may be behind us. This is in no way a bearish
        view on the future, but it does speak to a new reality for investors and their portfolios.
    •   We are returning rapidly to a new normal. We expect growth to moderate further as peaking demand for
        consumer goods and the end of inventory replenishment are upon us. We also remind readers that the
        pandemic is not over yet.
    •   We think that most investors and market prognosticators undervalue dividends and the role they play in
        determining total investor returns.
    •   Given that the 38% return for global equities is behind us, we have reduced weightings to some cyclical
        assets and are beginning to shift portfolios towards higher quality assets. One way to convince investors
        of a company’s growth prospects is growth in cash distributions.
    •   Growth in dividends is consistent with management activities that are focused on the long-term health
        and competitive position of these companies. A firm’s capacity to grow dividends demonstrates their
        fortitude and commitment to shareholders.
    •   Cash generators have beaten the S&P 500 return by 60 percentage points over the past 30 years.

The New Normal Begins Now
As we have discussed in our Mid-Year Outlook, the strongest annual returns for this new economic cycle may be behind
us. Expectations of a strong economic recovery have been priced into most financial markets. US economists are no
longer raising forecasts given that 2021’s GDP growth rate to June averages 7%. This is in no way a bearish view on the
future, but it does speak to a new reality for investors and their portfolios. By our estimates, positive returns are earned in
equities slightly more than 5 times more frequently than losses, matching the ratio of expansions/contractions. But where
should one find those returns?
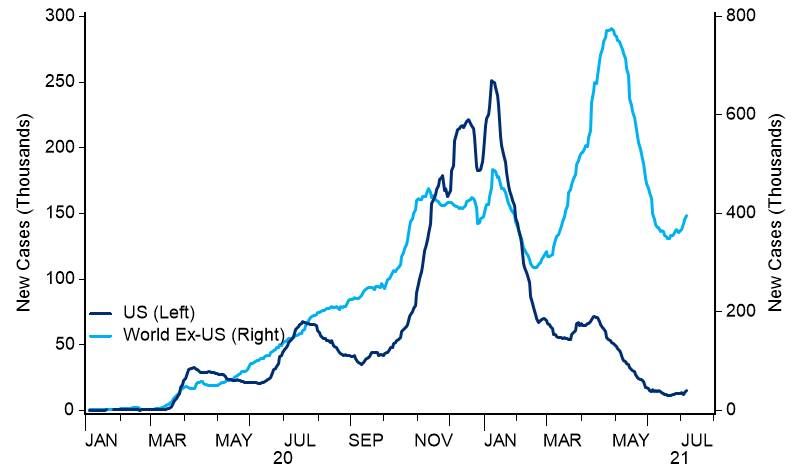
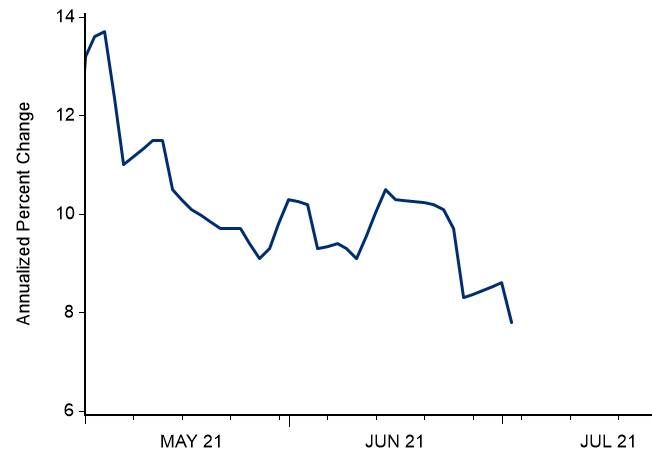
An Abundance of Anxiety
Global equities are just 1% below their record highs. Investors have shaken off fears that surging inflation and interest
rates would crush the bull market and budding economic recovery. Their newest anxiety is reflected in a rallying bond
market that expresses the exact opposite view, a fear that growth will slow quickly. The drop in 10-year US yields from
1.75% at the end of the first quarter to a low near 1.30% last week is indicative.
There are many reasons for the anxiety. One is the instability of consumer prices. Seasonal travel budgets will be sorely
stretched as the hospitality sector reopens with a surge in demand. A second is the increase in equity market volatility
around the early July US holiday and bond-bearish positioning that have exaggerated the US rate moves.
Yet, the truth is that we are returning rapidly to a new normal. The post-pandemic “rocket” recovery (hat tip to Richard
Branson here) is coming back to Earth. Estimates for US economic growth are slowing. Over the past two weeks, the
Atlanta’s Fed’s tracking estimate for 2Q real GDP fell from a previously unprecedented +10.2% to +7.8% (see figure 1).
We expect growth to moderate further as peaking demand for consumer goods and the end of inventory replenishment
are upon us. We also remind readers that the pandemic is not over yet. As figure 2 shows, new infections in the US are
lower, but the disease remains prevalent. Among the willing adult population, it is no longer easy to find unvaccinated
arms to jab. Outside the US, infections are rising again due to slow vaccination rated and the fast spreading Delta variant.
Stark actions in Japan and other Asian economies limit social interactions and a return to full economic activity. We
therefore expect US growth to moderate to 4%-5% level even as service activity booms.

Figure 1: Tracking Estimate for 2Q Real US GDP Growth:                              Figure 2: New COVID Infections: US vs World Ex-US
Atlanta Fed

Source: Haver Analytics as of July 9, 2021. All forecasts are expressions of opinion and are subject to change without notice and are not intended to be a guarantee of future
events.

We Do Expect Rates to Rise From Here, But Modestly
From an investor point of view, bond market valuations are atrocious. It is possible that US investors will earn real negative
rates of return for several years to come. We do think rates are too low given our economic growth expectations. Yet,
looking at precedent, treasury yields haven’t moved up more than 50 basis points in the second year of an economic
recovery since 1981. Signs that economic growth and inflation are now at peak rates has historically checked a material
rise in yields. And the quiet, steady drumbeats of a gradual move by the Fed to a more conventional monetary policy
approach in coming years has calmed inflation concerns.

A Shift in Portfolios toward Dividends and “Quality” Growers
Given that the 38% return for global equities is behind us, we have reduced weightings to some cyclical assets that have
priced in most of the current economic recovery. And we also beginning to shift portfolios towards higher quality assets
with the most convincing growth prospects beyond the COVID rebound.
One way to convince investors of a company’s growth prospects is growth in cash distributions. While some firms have
internal growth opportunities in which to reinvest, a firm’s capacity to grow dividends (and cut if absolutely necessary)
demonstrates their fortitude and commitment to shareholders.
We think that most investors and market prognosticators undervalue dividends and the role they play in
 determining total investor returns. As figure 3 shows, a whopping 52% of the total return in the S&P 500 has been
 earned by receiving and reinvesting dividends, even over the tech-dominated past three decades.
 If that result isn’t convincing enough, the vast difference in total return for US and European shares over the past 20 years
 largely is largely explained by their differences in payout growth rates. US dividends compounded at a 6% growth rate,
 Europe’s is just 3% (see figures 4-5).

   Figure 3: S&P 500 Total Return Index and Price-Only Return

   Source: Bloomberg as of July 9, 2021. Indices are unmanaged. An investor cannot invest directly
   in an index. They are shown for illustrative purposes only and do not represent the performance
   of any specific investment. Past performance is no guarantee of future results. Real results may
   vary.

Figure 4: S&P 500 Index and S&P 500 Dividends Per Share:                                Figure 5: MSCI Europe Index and MSCI Europe Dividends Per
Compounded Dividend Growth Rate 6%                                                      Share: Compounded Dividend Growth Rate 3%

Source: Bloomberg as of July 9, 2021. Indices are unmanaged. An investor cannot invest directly in an index. They are shown for illustrative purposes only and do not represent
the performance of any specific investment. Past performance is no guarantee of future results. Real results may vary.

 Aristocracy in Action
 If we define Dividend Aristocrats as an index of US equities that has grown dividends consistently for 25 years, we can see
 why they deserve their lofty status in markets. As figure 6 shows, these cash generators have beaten the S&P 500 return
 by 60 percentage points over the past 30 years. They have done so with less downside over each of the five calendar
 years when broader US equities posted a drop. In fact, consistent dividend growers have beaten both a “growth basket”
 tilt and a value basket with a long enough investment horizon (see Figure 7). Finally, these Dividend Aristocrats have
 higher than market-average credit ratings (please see Stocks for Bond People).
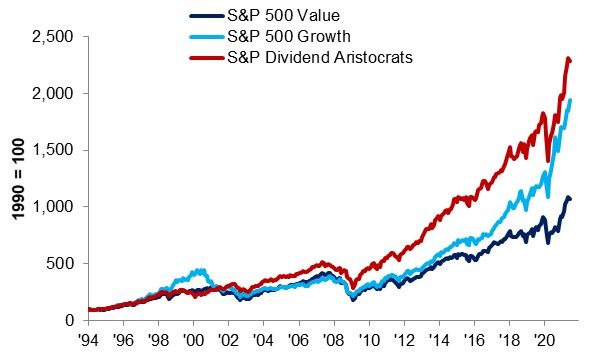
Figure 6: US Dividend Aristocrats Total Return vs S&P 500                               Figure 7: US Dividend Aristocrats vs “Growth Style” index and
Total Return                                                                            “Value Style” index

Source: Bloomberg as of July 9, 2021. Note: S&P Dividend Aristocrats Index identifies companies that have consistently grown dividend payouts for at least 25 consecutive
years. Indices are unmanaged. An investor cannot invest directly in an index. They are shown for illustrative purposes only and do not represent the performance of any
specific investment. Past performance is no guarantee of future results. Real results may vary.

It is our view that across all regions of the world, market leading firms that demonstrate their growth through increased
dividends are likely to follow the US precedent of outperformance. In Europe, where we expect a reversal of the austerity
and disunity of the past decade, it is possible that dividend growth will resume. And European shares begin with a dividend
yield roughly twice the global bond yield (see Figures 8-9 and our European Strategy Monthly).

Figure 8: S&P 500, US Dividend Aristocrats and Non-US                                    Figure 9: 10-Year US Treasury and German Bund Yield (%)
“Dividend Achievers”

Source: Bloomberg as of July 9, 2021. Note: Dividend Aristocrats defined above. Nasdaq International Dividend Achievers Index identifies non-US companies that have
consistently grown dividend payouts for at least 7 consecutive years. Indices are unmanaged. An investor cannot invest directly in an index. They are shown for illustrative
purposes only and do not represent the performance of any specific investment. Past performance is no guarantee of future results. Real results may vary.

Focus on Dividend Growth not High Dividend Yield
Companies that are able to consistently grow dividends tend to outperform those delivering unsustainable payouts. There
is a demonstrable, significant performance gap between companies that grow their dividend consistently versus those that
cut or suspend their dividends. Over the last 47 years, this outperformance of dividend growers relative to dividend “cutters”
is over 3% per year, with 30% lower volatility.
Growth in dividends is consistent with management activities that are focused on the long-term health and competitive
position of these companies. Dividend growth investing amounts to more of a “goldilocks” strategy, with moderate payout
ratios, leverage, and yield delivering stronger long-run performance than both higher and lower yielding alternatives (see
Figure 10).
By contract, high yielding dividend strategies tempt investors with indicative yields more than twice that of the broader
market. Looking more closely, these higher payouts come with additional risks worth noting. The highest “yielding”
companies actually deliver lower cash flow generation and lower ROEs with higher leverage, and often unsustainably high
payout ratios.
Using the Dow Jones Select Dividend index (the top 20% of dividend yielders in the S&P 500) as a proxy, we note that this
index has underperformed the Dividend Aristocrats index by more than 3% per year and the broader market by 2% per
year over the past 16+ years. As it turns out, their payout ratios of around 82% of annual net income on average don’t
allow for dividend growth. Thus, when the business environment changes, the top dividend yielders are often the first to
make dividend cuts. This leads to lower total returns and more volatility, too. We should also point out that dividend growth
strategies have outperformed high dividend yield strategies in both rising and falling real interest rate environments (see
Figure 11).

Figure 10: Dividend index payout ratio, leverage and                                  Figure 11: Dividend index performance during periods of
performance                                                                           rising and falling real interest rates
                      High Dividend Dividend                                                      Average 12m Return since 1995
                         Payers     Aristocrats S&P 500                                                  During Periods of…
Dividend Yield               3.9%                 2.4%            1.4%                                        Rising real   Falling
 Payout Ratio                                                                                                    rates    real rates
   (% of Net                 82%                  66%              55%
                                                                                               High Dividend
    Income)                                                                                                      6.7%       12.2%
 Leverage (Net                                                                                    Payers
     Debt to                 3.3x                  2.4x            1.3x                           Dividend
   EBITDA)
                                                                                                                 8.9%       12.5%
                                                                                                Aristocrats
  Annualized
 Performance                11.7%                12.5%            10.9%                            S&P 500                     8.5%                  5.6%
  since 1995
Source: Bloomberg as of July 9, 2021. Note: Return history analysis generated since 1995 per index data source availability. High Dividend Payers are proxied using Dow
Jones Select Dividend Index. Dividend Aristocrats proxied using S&P 500 Dividend Aristocrats Index. Indices are unmanaged. An investor cannot invest directly in an index.
They are shown for illustrative purposes only and do not represent the performance of any specific investment. Past performance is no guarantee of future results. Real
results may vary.

The Dividend Metrics We Prefer
When identifying compelling dividend paying investment opportunities, it is essential to understand the underlying business
fundamentals. Our focus is to find companies that have the ability to potentially generate returns in excess of their cost of
capital. Key metrics we identify include: dividend growth – companies that consistently grow their dividend have
historically outperformed; free cash flow – needed to pay the dividend and reinvest for future growth; high Return on
Invested Capital (ROIC)/ Return on equity (ROE) – a “good quality” barometer as companies generate higher returns
due to their competitive advantages; payout ratio, debt levels – these need to be well-managed for a company to maintain
dividend payouts in more challenging times, and; attractive valuations – to provide both downside protection and an
upside kicker when a company executes well.

Three Sectors with Sustainable Dividend Growth
Health Care, (Pharma, in particular)
Pharmaceutical companies, currently yield 2x the market average (2.70% vs. 1.35%), have a higher ROE (15.3% vs.
14.0%), higher operating margins (13.4% vs. 9.5%), higher trailing 5 year dividend growth (6.3% vs. 4.5%), and trade at a
38% discount based on free cash flow to enterprise value. We also believe that secular growth tailwinds will drive attractive
top-line growth for many companies across the industry. Valuations appear to reflect material drug price reform in the
United States given that the sector trades at a meaningful discount to the broader market. Though our “base case” remains
that we will likely see drug price reform passed over the next 12 months, we expect a fairly modest impact on most
companies’ earnings. And with the lifting of this regulatory cloud, we might see a substantial upgrade in valuation for the
group.
Biopharma companies also generate free cash flow and this is often underappreciated by investors. The cash generation
of biopharma companies allows them to methodically reinvest in their pipelines via increased R&D spending and bolt-on
M&A. These investments will drive the next leg of growth and innovation.
The biopharma industry’s recent successes with COVID-19 vaccines and Alzheimer’s therapy approvals have showcased that it can drive scientific breakthroughs. In addition to investing in their pipelines, pharma and biopharma companies return cash to shareholders and many support divided yields north of 3%. We expect many of these companies will grow their dividends by at least mid-single digits in the years ahead. Finally, the near-term outlook for health care companies tied to utilization is also quite attractive. Patients postponed elective procedures and wellness visits throughout 2020. This dynamic creates “easy comps” for health care companies as utilization continues to normalize in the quarters ahead. Select consumer staples with strong pricing power Consumer staples companies historically have delivered more than twice the market dividend yield (2.76% vs. 1.35%), have much higher ROEs (25.5% vs. 14.0%), higher 5-year dividend growth (6.6% vs. 4.5%), reasonable payouts (58%), and are trading at a 28% discount based on free cash flow to enterprise value. In addition, high quality consumer staples companies have been able to grow topline organically in excess of inflation due to their strong brands, pricing power, relatively inelastic demand and strength over private label (store brands). We have also seen a bottoms-up focus on restructuring consumer staple business leaders. Using Zero Based Budgeting (a combination of product and SKU rationalization, cost controls, more efficient marketing spend, lower central and procurement costs (scale benefits) and a pivot to ecommerce) leaders have driven much better results leading to greater free cash flow generation. After the necessary reinvestment in technology and growth strategies, boards of these companies have elected to return the excess FCF to shareholders in the form of share repurchases and dividends. Semiconductors that power an increasingly digitized world Semiconductors are an underappreciate dividend growth sector that historically have 4 times the 5 year dividend growth (20.8% vs. 4.5%), significantly higher ROEs (25.5% vs. 14.0%), double the operating margins (20.5% vs. 9.5%) and trades are at a 15% discount based on free cash flow to enterprise value. The Semiconductor industry has attractive fundamental characteristics driven by unstoppable trends including data growth and demographics (see our Outlook publications regarding Unstoppable Trends). Demand drivers across the semiconductor industry include growth in Artificial Intelligence, Big Data/Cloud Computing, Electric Vehicle (EV) and autonomous driving, sensors and robotics. All of this is leading to demand for smaller, more power efficient, and ultimately more complex semiconductors. We expect that the industry will consolidate due to the increasing complexity of semiconductors and the associated cost in developing and producing such chips at scale. Thus, the management of leaders in this sectors will, in our view, become more comfortable committing to a regular, higher dividend pay-outs.
This email contains promotional materials. If you do not wish to receive any further promotional emails from Citi Private Bank,
please email donotspam@citi.com with "UNSUBSCRIBE" in the subject line. Email is not a secure environment; therefore, do not
use email to communicate any information that is confidential such as your account number or social security number.
Announced in January 2021, Citi Global Wealth (“CGW”) is comprised of the wealth management businesses of Citi Private Bank and Citi’s
Global Consumer Bank. Through these businesses, CGW delivers Citi’s wealth solutions, products and services globally. The unified
management and delivery of CGW’s wealth strategy represents a further commitment by Citi to become a leading global wealth business. Citi
Global Wealth Investments (“CGWI”) is comprised of the Investments and Capital Markets capabilities of Citi Private Bank, Citi Personal
Wealth Management and International Personal Bank U.S.
Citi Private Bank and Citi Personal Wealth Management are businesses of Citigroup Inc. (“Citigroup”), which provide clients access to a broad
array of products and services available through bank and non-bank affiliates of Citigroup. Not all products and services are provided by all
affiliates or are available at all locations. In the U.S., investment products and services are provided by Citigroup Global Markets Inc. (“CGMI”),
member FINRA and SIPC, and Citi Private Advisory, LLC (“Citi Advisory”), member FINRA and SIPC. CGMI accounts are carried by Pershing
LLC, member FINRA, NYSE, SIPC. Citi Advisory acts as distributor of certain alternative investment products to clients of Citi Private Bank.
Insurance is offered by Citi Personal Wealth Management through Citigroup Life Agency LLC (“CLA”). In California, CLA does business as
Citigroup Life Insurance Agency, LLC (license number 0G56746). CGMI, Citi Advisory, CLA and Citibank, N.A. are affiliated companies under
the common control of Citigroup.
Outside the U.S., investment products and services are provided by other Citigroup affiliates. Investment Management services (including
portfolio management) are available through CGMI, Citi Advisory, Citibank, N.A. and other affiliated advisory businesses. These Citigroup
affiliates, including Citi Advisory, will be compensated for the respective investment management, advisory, administrative, distribution and
placement services they may provide.
International Personal Bank U.S. (“IPB U.S.”), is a business of Citigroup Inc. (“Citigroup”) which provides its clients access to a broad array of
products and services available through Citigroup, its bank and non-bank affiliates worldwide (collectively, “Citi”). Through IPB U.S. prospects
and clients have access to the Citigold® Private Client International, Citigold® International, International Personal, Citi Global Executive
Preferred, and Citi Global Executive Account Packages. Investment products and services are made available through either Citi Personal
Investments International (“CPII”), a business of Citigroup Inc., which offers securities through Citigroup Global Markets Inc. (“CGMI”),
member FINRA and SIPC, an investment advisor and broker–dealer registered with the Securities and Exchange Commission; or Citi
International Financial Services, LLC (“CIFS”), member FINRA and SIPC, and a broker–dealer registered with the Securities and Exchange
Commission that offers investment products and services to non–U.S. citizens, residents, or non–U.S. entities. CGMI and CIFS investment
accounts are carried by Pershing LLC, member FINRA, NYSE, and SIPC. Insurance is offered by CPII through Citigroup Life Agency LLC
(“CLA”). In California, CLA does business as Citigroup Life Insurance Agency, LLC (license number 0G56746). Citibank N.A., CGMI, CIFS,
and CLA are affiliated companies under common control of Citigroup Inc.
Read additional Important Information
Past performance is not indicative of future results. Real results may vary.
**Citi and its employees are not in the business of providing, and do not provide, tax or legal advice to any taxpayer outside Citi.
Any statement in this Communication regarding tax matters is not intended or written to be used, and cannot be used or relied
upon, by any taxpayer for the purpose of avoiding tax penalties. Any such taxpayer should seek advice based on the taxpayer’s
particular circumstances from an independent tax advisor.
MBS are also sensitive to interest rate changes which can negatively impact the market value of the security. During times of heightened
volatility, MBS can experience greater levels of illiquidity and larger price movements.
Important information, including information relating to risk considerations can be found in the link above.
Views, opinions and estimates expressed herein may differ from the opinions expressed by other Citi businesses or affiliates, and are not
intended to be a forecast of future events, a guarantee of future results, or investment advice, and are subject to change without notice based
on market and other conditions. Citi is under no duty to update this presentation and accepts no liability for any loss (whether direct, indirect or
consequential) that may arise from any use of the information contained in or derived from this presentation.
© 2021 Citigroup Inc., All Rights Reserved. Citi, Citi and Arc Design and other marks used herein are service marks of Citigroup Inc. or its
affiliates, used and registered throughout the world.
       INVESTMENT PRODUCTS: NOT FDIC INSURED · NOT CDIC INSURED · NOT GOVERNMENT INSURED
                                            · NO BANK GUARANTEE · MAY LOSE VALUE
www.citiprivatebank.com
You can also read