Chapter 9 Traffic, transport and access
←
→
Page content transcription
If your browser does not render page correctly, please read the page content below

Roads and Maritime Services/Sydney Airport Corporation Limited

Sydney Gateway
Road Project
Environmental Impact Statement/
Preliminary Draft Major Development Plan
Chapter 9 Traffic, transport and access

November 2019
Environmental Impact Statement / Preliminary Draft Major Development Plan
Contents
9. Traffic, transport and access............................................................................................................. 9.1
9.1 Assessment approach ............................................................................................................... 9.1
9.2 Existing environment ............................................................................................................... 9.12
9.3 Assessment of construction impacts ....................................................................................... 9.25
9.4 Assessment of operation impacts ............................................................................................ 9.36
9.5 Cumulative impacts ................................................................................................................. 9.52
9.6 Management of impacts .......................................................................................................... 9.55
Tables
Table 9.1 Summary of model assessment scenarios ........................................................................... 9.5
Table 9.2 Level of service criteria for intersections ............................................................................. 9.11
Table 9.3 Midblock level of service criteria.......................................................................................... 9.11
Table 9.4 Roads within and adjacent to the project site...................................................................... 9.13
Table 9.5 2016 morning and afternoon peak and average weekday traffic volumes ......................... 9.17
Table 9.6 Existing intersection performance ....................................................................................... 9.19
Table 9.7 Morning and afternoon peak intersection performance during scenario 1 .......................... 9.28
Table 9.8 Morning and afternoon peak travel time changes during scenario 1 .................................. 9.28
Table 9.9 Morning and afternoon peak intersection performance during scenario 2 .......................... 9.29
Table 9.10 Morning and afternoon peak travel time changes during scenario 2 .................................. 9.30
Table 9.11 Morning and afternoon peak intersection performance during scenario 3 .......................... 9.30
Table 9.12 Morning and afternoon peak travel time changes during scenario 3 .................................. 9.31
Table 9.13 Indicative changes to active transport networks ................................................................. 9.33
Table 9.14 Midblock performance in 2036 ............................................................................................ 9.46
Table 9.15 Changes to access due to project ....................................................................................... 9.49
Table 9.16 Traffic, transport and access mitigation measures.............................................................. 9.57
Figures
Figure 9.1 Traffic and transport assessment study area ........................................................................ 9.2
Figure 9.2 Methodology overview ........................................................................................................... 9.3
Figure 9.3 Location of assessment screenlines ..................................................................................... 9.7
Figure 9.4 Location of key intersections for assessment ....................................................................... 9.8
Figure 9.5 Routes used for travel time analysis ................................................................................... 9.10
Figure 9.6 Existing transport environment – map 1 .............................................................................. 9.15
Figure 9.7 Existing transport environment – map 2 .............................................................................. 9.16
Figure 9.8 24-hour traffic volumes at fixed traffic counter locations in 2018 ........................................ 9.17
Figure 9.9 Sections of the WestConnex motorway .............................................................................. 9.23
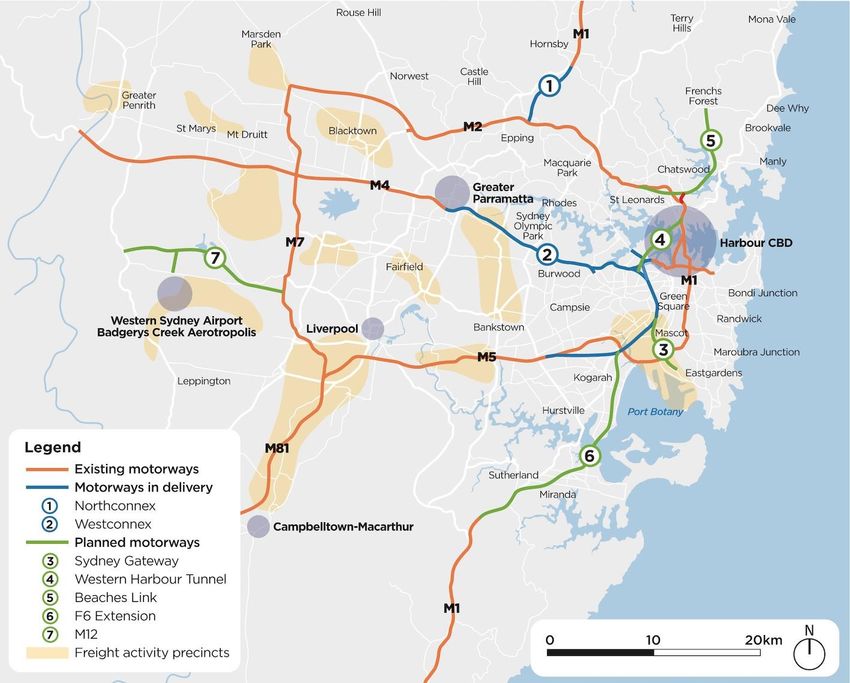
Figure 9.10 Motorway projects in Greater Sydney ................................................................................. 9.24
Figure 9.11 Sydney Gateway screenline analysis results ...................................................................... 9.37
Figure 9.12 F6 screenline analysis results ............................................................................................. 9.38
Environmental Impact Statement / Preliminary Draft Major Development Plan

Figure 9.13    Port Botany screenline analysis results .............................................................................. 9.38
Figure 9.14    Selected 2036 travel time improvements (private vehicles) ................................................ 9.39
Figure 9.15    Travel time comparisons between St Peters interchange and Sydney Airport terminals
               in the morning peak ............................................................................................................. 9.40
Figure 9.16    Travel time comparisons between St Peters interchange and Sydney Airport terminals
               in the afternoon peak ........................................................................................................... 9.40
Figure 9.17    Travel time comparisons between St Peters interchange/M5 East and Foreshore Road in
               the morning peak ................................................................................................................. 9.41
Figure 9.18    Travel time comparisons between St Peters interchange/M5 East and Foreshore Road in
               the afternoon peak .............................................................................................................. 9.41
Figure 9.19    Selected 2036 travel time improvements (buses) ............................................................... 9.42
Figure 9.20    Forecast average delays at intersections with and without the project (2026) ................... 9.43
Figure 9.21    Forecast average delays at intersections with and without the project (2036) ................... 9.44
Figure 9.22    2036 morning peak density and level of service performance ............................................ 9.45
Figure 9.23    2036 afternoon peak density and level of service performance.......................................... 9.45
Figure 9.24    Key project features that align with ground transport solutions in the Sydney Airport
               Master Plan ......................................................................................................................... 9.51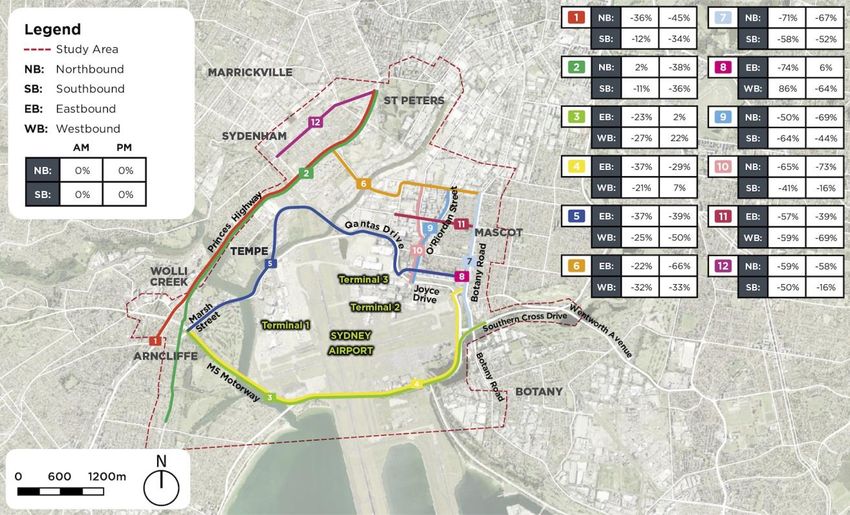
Chapter 9
Traffic, transport and access
This chapter provides a summary of the traffic, transport and access assessment. It describes the existing
environment, identifies potential impacts during construction and operation, and provides measures to
mitigate and manage the impacts identified. Further information is provided in Technical Working Paper 1
(Transport, Traffic and Access).
The SEARs and MDP requirements relevant to traffic, transport and access are listed below. Full copies of
the SEARs and MDP requirements, and where they are addressed in this document, are provided in
Appendices A and B respectively.

 Reference     Requirement                                                                  Where addressed

 Key issue SEARs
 1             Transport and traffic
 1.1           The Proponent must assess construction transport and traffic (network,
               vehicle (including freight traffic) pedestrian and cyclists) impacts,
               including, but not necessarily limited to:
                 (a) a considered approach to route identification and scheduling of
                     construction vehicle movements, with particular consideration of       Chapter 8 and
                     traffic impacts and transport movements outside standard               section 5.1.5 of Technical
                                                                                            Working Paper 1
                     construction hours including cumulative impacts;
                 (b) the indicative number, frequency and size of construction related      Chapter 8 and
                     vehicles (passenger, commercial and heavy vehicles, including          section 5.1.7 of Technical
                     spoil management movements);                                           Working Paper 1
                 (c) construction worker parking;                                           Chapter 8 and
                                                                                            section 5.1.4 of Technical
                                                                                            Working Paper 1
                 (d) the nature of existing traffic (types and number of movements) on      Sections 9.2.2 (traffic
                     construction access routes (including consideration of peak traffic    volumes), 9.2.5 (active
                     times, pedestrians and cyclists and parking arrangements);             transport) 9.2.6 (parking)
                 (e) access constraints and impacts on public transport, pedestrians        Sections 9.3.4 and 9.3.5
                     and cyclists (infrastructure and services);
                 (f) the need to close, divert or otherwise reconfigure elements of the     Sections 8.3.3, 8.6.5 and
                     road, pedestrian and cycle network associated with construction        9.3.1
                     of the proposal and the duration of these changes;
                 (g) impacts to on street parking, including for residents and              Section 9.3.7
                     businesses;
                 (h) cumulative impacts on the road, pedestrian and cycle network           Section 9.5.1
                     from other key infrastructure proposals including but not limited to
                     the Botany Rail Duplication and New M5.
 1.2           The Proponent must assess (and model) the operational transport
               impacts of the proposal, including:
                 (a) forecast travel demand and road traffic volumes for the proposal       Sections 9.4.1 (traffic
                     and the surrounding road, airport, freight, port, cycle and public     demand and volumes),
                     transport network;                                                     9.4.6 (public transport),
                                                                                            and 9.4.7 (active
                                                                                            transport)
                 (b) travel time analysis for the different road transport modes            Section 9.4.2
                 (c) performance of key interchanges and intersections by undertaking       Sections 9.4.3 and 9.4.4
                     a level of service analysis at key locations;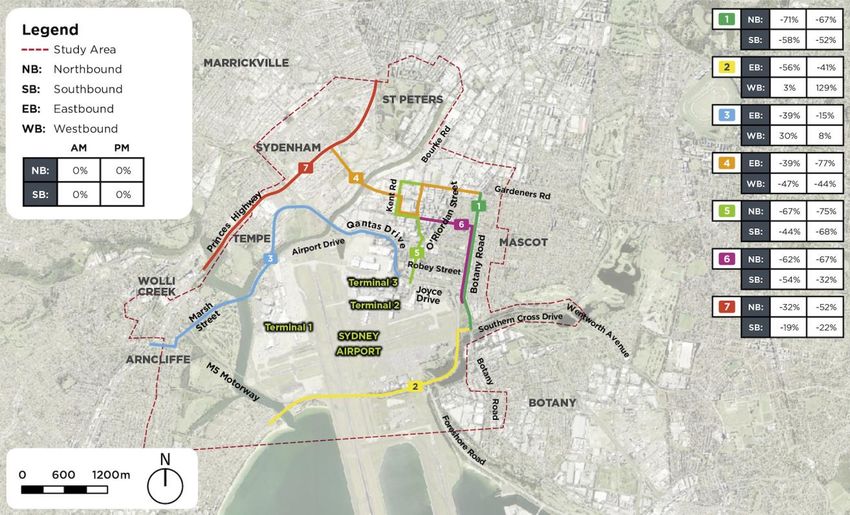
Reference      Requirement                                                                   Where addressed
                 (d) wider transport interactions (local and regional roads, cycling,        Sections 9.4.1 to 9.4.7
                     public transport, airport, port and freight transport);
                 (e) induced traffic and operational implications for public transport       Sections 9.1.2 and 9.4.6
                     (particularly with respect to strategic bus corridors and bus routes)
                     and consideration of opportunities to improve public transport;
                 (f) property and business access and on-street parking.                     Sections 9.4.8 and 9.4.9
4.             Place making and urban design
4.2            The Proponent must describe the accessibility elements of the proposal
               including relevant accessibility legislation and guidelines, including:
                 (a) impacts on public transport infrastructure and services;                Sections 9.3.4 and 9.4.6
                 (b) impacts on cyclists and pedestrian access, amenity and safety           Sections 7.9, 8.6.4, 9.3.5
                     across and adjoining the proposal, including the relocation of          and 9.4.7
                     cycle routes and delivery of new cycleways around the airport and
                     Alexandra Canal; and
                 (c) opportunities to integrate and enhance accessibility including the      Section 9.6.2
                     provisions for public and active transport infrastructure as a result
                     of the proposal.

Major development plan requirements (in accordance with Section 91 of the Airports Act)
91(1)(ga)      The likely effect of the proposed developments that are set out in the
               major development plan, or the draft of the major development plan, on:       Section 9.4.10
                 (i) traffic flows at the airport and surrounding the airport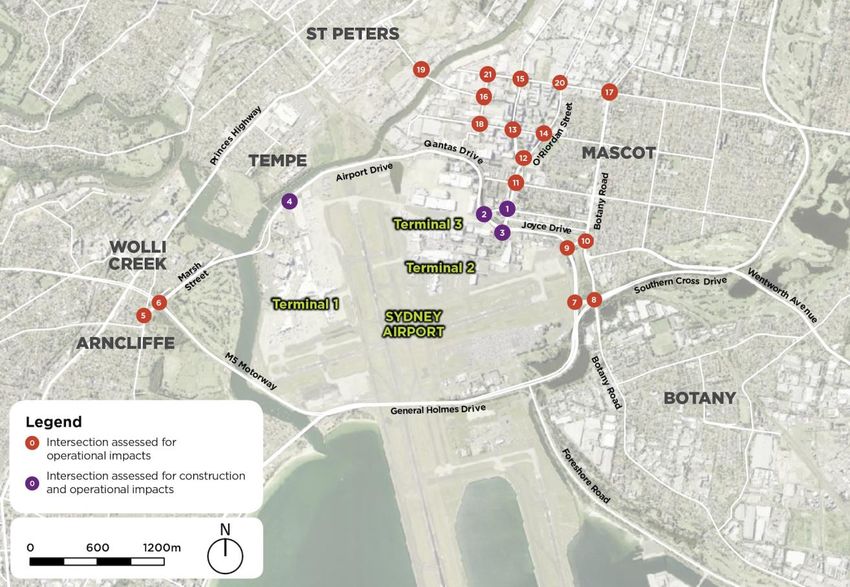
Environmental Impact Statement / Preliminary Draft Major Development Plan 9. Traffic, transport and access 9.1 Assessment approach Constructing and operating new road infrastructure has the potential to affect existing traffic and transport conditions, and change access arrangements. This can impact the local and regional community, as well as access to critical infrastructure. It is important that these potential impacts are identified and understood prior to construction. The assessment addresses the potential impacts on all forms of transport, with a primary focus on the operation of the road network. An overview of the approach to the assessment is provided below, including the legislative and policy context and a summary of the assessment methodology. 9.1.1 Legislative and policy context to the assessment The assessment has been undertaken in accordance with the SEARs and MDP requirements (provided in Appendices A and B) and with reference to the following: Relevant legislation, including the EP&A Act, the Airports Act and associated regulations Traffic Modelling Guidelines (Roads and Maritime, 2013a) Guide to Traffic Generating Developments (Roads and Traffic Authority, 2002) Guide to Traffic Management: Part 3 Traffic Studies and Analysis (Austroads, 2017) Sydney Airport Master Plan 2039 (SACL, 2019a) Sydney Airport Environment Strategy 2019-2024 (SACL, 2019b). 9.1.2 Methodology Study area The study area for the assessment generally extends from St Peters and Erskineville in the north to Banksia in the south-west and Botany in the south-east. It includes the road and transport networks surrounding Sydney Airport, including those within Mascot, St Peters and Tempe. The study area is shown on Figure 9.1. A different (larger) area was used for the traffic modelling to facilitate evaluation of changes to the regional transport networks and the potential impacts these changes may have on the project in future years. Chapter 9 Traffic, transport and access 9.1
ST PETERS
et
ay
l
tre
Ca
na
hw Ca
na
nS
g ra
Hi and
l
Alex
rda
ces oa
R
in d
Rio
Pr
O’
TEMPE
Qant
Road
as D
ri
ve
MASCOT
Botany
e
riv
Robey S
treet
D
Co
oks
rt
po
Riv Terminal 3
er
Air
et Terminal 2
re
St ss Dri
ve (M1)
rs
h
Terminal 1 n Cro
Ma SYDNEY uth
er
So
AIRPORT
M
5
Mo
to
rw M1
)
ay ve (
lmes Dri
o
General H
BOTANY
For
esh
de
or
ra
eR
Pa
oa
nd
d
ra
eG
Th
Legend
Study area
Project site
Sydney Airport (Commonwealth) land
0 1.0 1.0km Figure 9.1 Traffic and transport assessment study area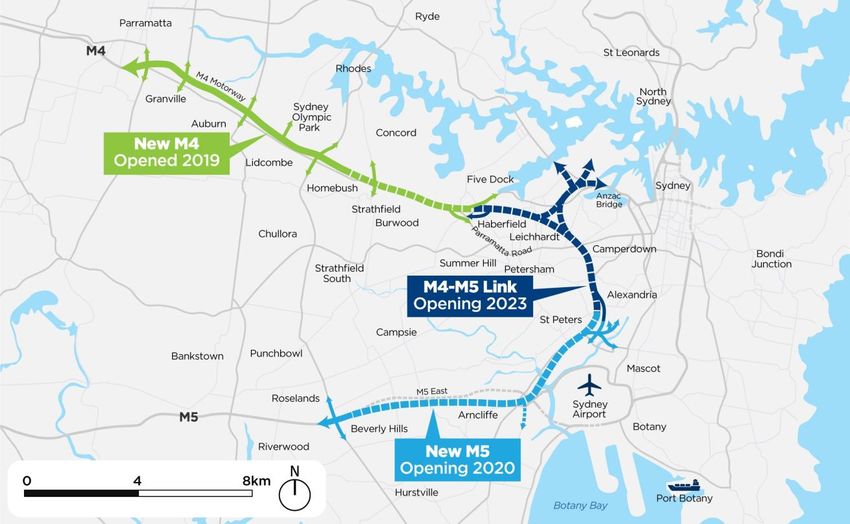
Environmental Impact Statement / Preliminary Draft Major Development Plan
Key tasks
The assessment involved:
Identifying existing traffic conditions, including traffic patterns, mode share, public and active transport
networks, car parking arrangements, and access
Analysing existing and future traffic volumes using traffic models (described below)
Modelling future road network performance with and without the project
Reporting on the operational performance of the existing and future road network in the vicinity of the
project site, considering the potential impacts of the project and other road projects
Identifying measures to manage and mitigate the identified impacts.
A flowchart summary of the methodology is shown on Figure 9.2. A detailed description of the assessment
methodology is provided in section 3 of Technical Working Paper 1 (Transport, Traffic and Access).
Figure 9.2 Methodology overview
Overview of traffic network modelling
Modelling approach
Traffic modelling was undertaken to make realistic predictions about the potential future traffic conditions in
the study area, including travel demand and likely traffic volumes. These predictions were used to assess
the operational performance of the road network, with and without the project in place.
The modelling comprised three stages using three different models. It included strategic and operational
modelling to assess the potential impacts of the project at:
The regional level – on the wider Sydney road network
The local level – on the road network in the immediate vicinity of the project site.
The following models were used for this staged approach:
Sydney Strategic Travel Model – this model was used for the first stage of modelling to predict travel
demand as a result of future population, employment and infrastructure changes
Strategic Motorway Planning Model – this model was used for the second stage of modelling to
evaluate road travel demand across Sydney under different land use, transport infrastructure and
pricing scenarios, using the forecasted travel demand from the Sydney Strategic Travel Model
Chapter 9 Traffic, transport and access 9.3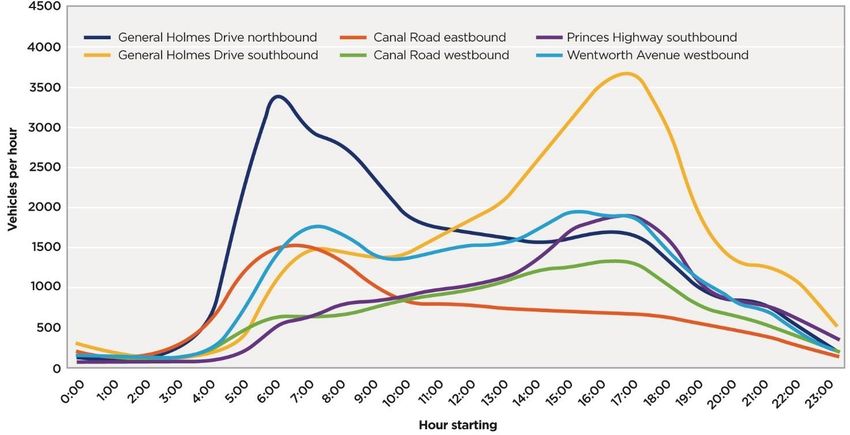
Environmental Impact Statement / Preliminary Draft Major Development Plan
The Sydney Gateway Operational Model – this model was used for the third stage of modelling, taking
the outputs from the Strategic Motorway Planning Model to predict the operational performance of the
road network in the study area.
Following selection and development of a baseline model representing the baseline year, the Sydney
Gateway Operational Model was calibrated and validated by matching observed traffic volumes and travel
times. The model was reviewed by Roads and Maritime and deemed suitable for assessing the potential
impacts of the project.
The main outputs from modelling that were used to assess the potential impacts of the project were
changes to:
Traffic volumes, patterns and travel demand
Intersection/interchange performance (average delay and level of service)
Vehicle travel times for a given trip distance.
The Strategic Motorway Planning Model considers induced traffic demand, including latent demand. For
the project, induced demand is less relevant because the project involves completing a ‘missing link’
between the Sydney motorway network and Sydney Airport. As a result, it is unlikely that the project would
generate new vehicle trips and there would be minimal latent demand associated with Sydney Airport. In
other words, the primary traffic impact of the project would be to take existing traffic away from local roads
and alleviate pressure on the local road network, while at the same time reducing travel time to areas in
and around Sydney Airport. Any induced demand considered as part of the Strategic Motorway Planning
Model has been included in the road network performance predictions in sections 9.3 and 9.4.
Construction stage modelling
The Sydney Gateway Operational Model was also used to undertake the construction traffic modelling
assessment for both the morning and afternoon peak periods. A 2022 future baseline model scenario was
created, excluding construction-related traffic. This baseline scenario acts as a benchmark against which
the potential impacts of the project can be assessed. It takes into account future traffic volume increases
and road upgrades/modifications that have occurred, or are expected to occur, without the project.
To simulate various construction activities and changes over the construction period, three construction
scenarios were assessed as being representative of the most disruptive changes to traffic conditions. The
location of these changes focussed on the most affected portions of the road network, in the vicinity of
Terminals 2/3, Qantas Drive, Airport Drive, and the access to Marsh Street and Terminal 1. Each scenario
comprised changes at or near Airport Drive/Link Road and along Qantas Drive between Robey and
O’Riordan streets. The following construction scenarios were considered by the modelling:
Scenario 1:
Eastbound Airport Drive traffic reduced to two lanes in the vicinity of Link Road and uses new
Terminal 1 connection bridge
Reconfigured Airport Drive/Link Road intersection, including second northbound right turn lane at
Link Road intersection removed
Existing westbound kerbside lane removed from Qantas Drive between Ninth Street and west of
Robey Street
Existing southbound kerbside lane removed on Sir Reginald Ansett Drive
Signals removed at Lancastrian Road and intersection converted to left in/out only.
Scenario 2 – same as scenario 1 with the addition of:
Left turn from Seventh Street reconfigured to double left turn slip lane, merging to a single lane
Median lane removed eastbound on Qantas Drive both west and east of Robey Street
Ninth Street deceleration and acceleration lanes removed.
9.4 Sydney Gateway Road Project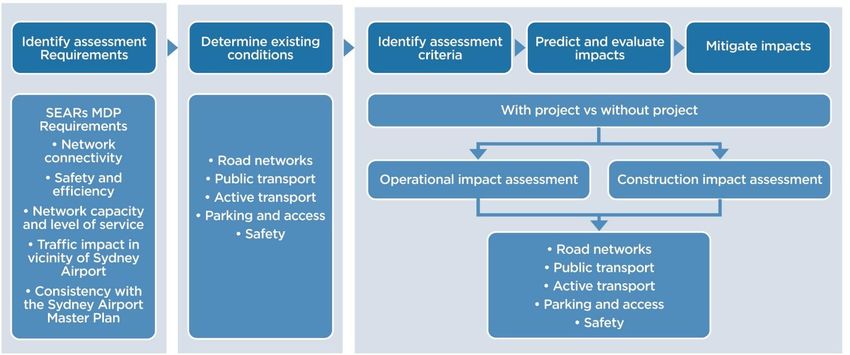
Environmental Impact Statement / Preliminary Draft Major Development Plan
Scenario 3 – same as scenario 2 with the addition of:
Westbound traffic uses the Terminal 1 connection bridge to Airport Drive west of Link Road
Existing westbound Airport Drive carriageway removed
Second northbound right turn lane at Link Road intersection re-introduced.
Operational stage modelling
Operational modelling considered a number of future scenarios factoring in changes to the road network
over the following years:
2016/18 – the adopted baseline year for the strategic and operational models
2022 – the adopted year in which construction impacts would be assessed
2026 – the adopted year of project opening
2036 – the period ten years after the adopted project opening year, as required by the Traffic Modelling
Guidelines (Roads and Maritime, 2013a).
‘Cumulative’ scenarios were also assessed (for 2026 and 2036) to predict the potential cumulative impacts
of all planned projects, including the F6 Extension Stage 1 and Western Harbour Tunnel and
Beaches Link.
Table 9.1 summarises the operational stage scenarios that were modelled.
Table 9.1 Summary of model assessment scenarios
Scenario Details
Without project (2026) Future network without the project, including other road network improvements
(NorthConnex, M4 Widening, M4 East, New M5, M4-M5 Link and Rozelle Interchange)
With project (2026) Consistent with the ‘without project (2026)’ scenario, but with the project open to traffic
With project cumulative Consistent with the ‘with project (2026)’ scenario, but with F6 Extension Stage 1 open to
(2026) traffic
Without project (2036) Future network without the project, including NorthConnex, M4 Widening, M4 East,
New M5, M4-M5 Link and Rozelle Interchange
With project (2036) Consistent with the ‘without project (2036)’ scenario, but with the project open to traffic
With project cumulative Consistent with the ‘with project (2036)’ scenario, but with F6 Extension Stage 1,
(2036) F6 Extension Stage 2, Rozelle Interchange, Western Harbour Tunnel and the Beaches
Link open to traffic
Impact assessment
The performance of a road traffic network can be assessed in a number of ways, including:
At a network level, which includes total vehicles using the network, their average speed and average
travel time
At a midblock level (ie the volume of vehicles crossing an arbitrary line some distance from an
intersection), which represents changes to travel routes and the impacts of these changes
At an intersection level, which represents changes to the performance of intersections.
The traffic models were used to establish baseline conditions so that changes associated with constructing
and operating the project can be isolated and analysed using the above measures, to determine whether
impacts can be mitigated.
Chapter 9 Traffic, transport and access 9.5Environmental Impact Statement / Preliminary Draft Major Development Plan Traffic volumes and patterns Traffic volumes and patterns were assessed by comparing the changes to traffic volumes between the 2026 and 2036 conditions, with and without the project. This provides an assessment of the changes to traffic volumes as a result of the project. It also provides an indication of the potential induced or additional traffic attracted to the local area as a result of the new road infrastructure. Outputs from the Strategic Motorway Planning Model and Operational Model have been used to show the changes to average daily traffic volumes and morning and afternoon peak traffic volumes. The traffic volumes output by the models represent average weekday volumes and exclude public and school holidays. The changes to traffic volumes also included heavy vehicles and total vehicles (light vehicles and heavy vehicles combined). Travel demand and traffic shifts Travel demand and traffic shifts were also assessed using outputs from the Strategic Motorway Planning Model and Operational Model to indicate average weekday traffic, and morning and afternoon peak period traffic volumes, moving across ‘screenlines’. A screenline is an imaginary line on a map (or in a model) at which point changes to traffic volumes (and patterns) can be consistently measured and compared for different scenarios. Three screenlines were analysed for the project (see Figure 9.3): Sydney Gateway screenline F6 screenline Port Botany screenline. The following were analysed for each screenline, for existing and 2026/2036 conditions, with and without the project: Directional and two-way traffic volumes Proportion of the total screenline traffic volume Total traffic volumes crossing the screenline. 9.6 Sydney Gateway Road Project
Environmental Impact Statement / Preliminary Draft Major Development Plan

Figure 9.3    Location of assessment screenlines

Intersection assessment
The potential for impacts during both construction and operation were considered for the following key
intersections, due to their proximity to the project site (shown in purple on Figure 9.4):
1. Robey Street/O’Riordan Street
2. Seventh Street/Qantas Drive
3. Joyce Drive/O'Riordan Street/Sir Reginald Ansett Drive
4. Airport Drive/Link Road.

Chapter 9 Traffic, transport and access                                                                         9.7
Environmental Impact Statement / Preliminary Draft Major Development Plan

The potential for operation impacts was considered at the following intersections (shown in red on
Figure 9.4):
5. West Botany Street/Marsh Street                       14. Coward Street/O’Riordan Street
6. Marsh Street/M5 motorway                              15. Gardeners Road/Bourke Street
7. General Holmes Drive/Mill Pond Drive                  16. Kent Road/Ricketty Street
8. Botany Road/Mill Pond Drive                           17. Botany Road/Gardeners Road
9. Joyce Drive/General Holmes Drive                      18. Kent Road/Coward Street
10. Botany Road/General Holmes Drive                     19. Canal Road/Burrows Road
11. King Street/O’Riordan Street                         20. O’Riordan Street/Gardeners Road
12. O'Riordan Street/Bourke Road                         21. Kent Street/Gardeners Road.
13. Bourke Street/Coward Street

Figure 9.4   Location of key intersections for assessment

9.8                                                                              Sydney Gateway Road Project
Environmental Impact Statement / Preliminary Draft Major Development Plan Travel time changes Travel times along key routes were used to determine the relative impacts or benefits of the project by comparing changes with and without the project. Modelling of travel time was undertaken for the following routes (see Figure 9.5): Construction stage: Airport Drive – Flora Street to Robey Street O'Riordan Street – Terminals 2/3 to Gardeners Road General Holmes Drive – the M5 East to Mill Pond Road. Operational stage: Princes Highway – May Street (St Peters) to Wickham Street/Forest Road Princes Highway/West Botany Street – May Street (St Peters) to Bestic Street M5 East – Marsh Street to the M1 at Southern Cross Drive M5 East – Marsh Street to Botany Road via the M1 Marsh Street – M5 intersection with Marsh Street to Joyce Drive/General Holmes Drive Canal Road – Princes Highway to Botany Road/Gardeners Road Botany Road – Gardeners Road to Mill Pond Drive/Botany Road Robey Street – Qantas Drive to Botany Road O’Riordan Street – Joyce Drive to Gardeners Road O’Riordan Street – Joyce Drive to Bourke Road Coward Street – Kent Road to Botany Road Unwins Bridge Road – May Street/Princes Highway to Railway Road. These routes were selected as they provide good coverage of the study area and are representative of travel times experienced by road users. The following additional routes were analysed to determine the relative impacts or benefits in terms of access to Sydney Airport and Port Botany: Between Sydney Airport and Mascot, via St Peters interchange Between Foreshore Road near Port Botany and Mascot, via St Peters interchange Between Foreshore Road near Port Botany and the M5 East. Chapter 9 Traffic, transport and access 9.9
Environmental Impact Statement / Preliminary Draft Major Development Plan
Figure 9.5 Routes used for travel time analysis
Public and active transport, parking and access assessment
The following were used to identify and assess potential impacts on services or existing conditions:
Changes to existing conditions (eg bus services, active transport routes, parking provisions or
accessibility)
Changes to connectivity with the surrounding network/other facilities
Impact on users (eg increased walking distances, changes to travel times, etc).
9.1.3 Assessment criteria
Intersection level of service
Road network performance was evaluated using average delay and level of service. Average delay is
commonly used to assess the operational performance of intersections, with level of service used as an
index. Level of service is measured on a scale from A to F, with A representing optimal operating
conditions and F representing the worst operating conditions. When roadway performance falls below a
level of service D, investigations are generally initiated to determine if suitable remediation can be
provided. However, limited road capacity and high demand often mean that a level of service E or F are
regularly experienced during peak periods at pinch points on Sydney’s road network.
A summary of the intersection level of service and average delay criteria is shown in Table 9.2.
9.10 Sydney Gateway Road ProjectEnvironmental Impact Statement / Preliminary Draft Major Development Plan
Table 9.2 Level of service criteria for intersections
Level of Average Traffic signals/roundabouts Give way and stop signs
service delay/vehicle (secs)
A 70 Roundabouts require other control At capacity; requires other control modes
modes
Source: Guide to Traffic Generating Developments (Roads and Traffic Authority, 2002)
Midblock level of service
Midblock performance is also measured using level of service. The level of service for freeway or
motorway sections where the design speed is more than 70 km/h is calculated based on the vehicle
density, which is the traffic volume divided by the average passenger car speed. Density is measured in
passenger car units per kilometre per lane (PCU/km/lane). The level of service for freeway or motorway
sections where the design speed is 70 km/h or less is calculated based on the volume/capacity (V/C) ratio,
which is the traffic volume divided by the capacity of the roadway.
Table 9.3 shows the six levels of service used for midblock assessment.
Table 9.3 Midblock level of service criteria
Level of Definition Multi-lane roads1 Freeways2
service
V/C ratio Density
(PCU/km/lane)
A A condition in which individual drivers are virtually unaffected ≤ 0.26 ≤ 7.0
by the presence of others in the traffic stream.
B A condition where drivers still have reasonable freedom to 0.27 to 0.41 7.1 to 11.0
select their desired speed and to manoeuvre within the traffic
stream.
C A conditions where most drivers are restricted to some extent 0.42 to 0.59 11.1 to 16.0
in their freedom to select their desired speed and to
manoeuvre within the traffic stream.
D Drivers are severely restricted in their freedom to select their 0.60 to 0.81 16.1 to 22.0
desired speed and to manoeuvre within the traffic stream.
E Traffic volumes are at or close to capacity, and there is 0.82 to 1.00 22.1 to 28.0
virtually no freedom to select desired speeds or to
manoeuvre within the traffic stream. Minor disturbances
within the traffic stream would cause queuing and delays.
F The amount of traffic approaching a point exceeds the > 1.00 > 28.0
amount which can pass it. Queuing and delays result.
Source: Guide to Traffic Management: Part 3 Traffic Studies and Analysis (Austroads, 2017)
Notes: 1. Free flow speed is taken as 70 kilometres per hour
2. Free flow speed is taken as 90 kilometres per hour
Chapter 9 Traffic, transport and access 9.11Environmental Impact Statement / Preliminary Draft Major Development Plan
9.1.4 Risks identified
An environmental risk assessment was undertaken as an input to the impact assessment (see
Appendix G). This involved identifying potential environmental risks during construction and operation, and
rating the potential risks according to likelihood, consequence and overall level of risk, in general
accordance with AS/NZS ISO 31000:2009 Risk management – Principles and guidelines. Traffic, transport
and access risks with an assessed risk rating of medium or above, identified by the environmental risk
assessment, included:
Changes to intersection and traffic performance during construction, including as a result of heavy
vehicle movements, narrowing of lanes, speed restrictions and lane closures
Disruptions and delays to public transport and emergency services during construction
Impacts on access to commercial properties during construction
Impacts on the shared paths in Tempe and along Alexandra Canal during construction
Cumulative traffic and transport impacts during construction, taking into account other projects in the
study area (particularly the Botany Rail Duplication)
Impacts on access to Sydney Airport during construction and operation
Impacts associated with the closure of Swamp Road and changes to access arrangements along
Burrows Road during construction and operation.
The traffic, transport and access assessment included consideration of these potential risks.
9.2 Existing environment
Key traffic, transport and access features of the study area are described below and shown on Figure 9.6
and Figure 9.7. Further information on the regional transport context, including significant transport
infrastructure in the study area (ie Sydney Airport and freight facilities), is provided in section 2.2.1.
9.2.1 Existing road network
Key roads within and adjacent to the project site are described in Table 9.4 and shown on Figure 9.6 and
Figure 9.7.
The roads used by traffic accessing Sydney Airport are listed in Table 9.4 and include:
Terminal 1 is accessed from the south and west via Marsh Street from the M5, and from the east via
Airport Drive/Qantas Drive/Joyce Drive, which connects with General Holmes Drive/Southern Cross
Drive (the M1)
Terminals 2/3 are accessed via Qantas Drive from the west, Joyce Drive from the east, and
O’Riordan Street from the north
Lancastrian Road provides access to other Sydney Airport facilities off Qantas Drive. Lancastrian Road
also provides access across Qantas Drive and Botany Rail Line to Qantas facilities north of the rail
line.
To improve traffic flow into and out of Terminals 2/3, a one-way road system was constructed to provide
access to Terminals 2/3 from Qantas Drive. Traffic enters Terminals 2/3 via Sir Reginald Ansett Drive and
exits via Seventh Street and Robey Street.
Heavy vehicle routes
Many of the roads around Sydney Airport and within the study area are designated heavy vehicle routes.
These roads can accommodate large vehicles, including B-doubles that are used to move road and
container freight. These include routes to and from Sydney Airport and Port Botany such as the M5,
General Holmes Drive, Southern Cross Drive and Foreshore Road.
9.12 Sydney Gateway Road ProjectEnvironmental Impact Statement / Preliminary Draft Major Development Plan
Qantas Drive and Airport Drive, along with Robey and O’Riordan streets, are also used for the movement
of freight to/from Sydney Airport. Airport Drive and Qantas Drive are also used by over height vehicles
travelling between the M1 and M5 motorways, due to the height restrictions of the M1 tunnel under the
Sydney Airport runways.
Roads identified as B-double routes are described in Table 9.4.
Table 9.4 Roads within and adjacent to the project site
Road Description Road function and
responsible authority
M1/Southern These roads extend along the southern and eastern boundaries of Motorways (Roads and
Cross Drive/ Sydney Airport, connecting the M5 East and the Eastern Maritime)
General Holmes Distributor. Southern Cross Drive is six lanes, while General B-double access route
Drive/A1 Holmes Drive has up to eight lanes with a section operating as a
tidal flow system for peak periods. The roads are limited access
motorways with no at-grade intersections.
M5 East The M5 East is a four-lane motorway connecting the M5 South Motorways (Roads and
Western Motorway to the M1 at General Holmes Drive. The M5 Maritime)
East runs along the southern boundary of Sydney Airport and then B-double access route
proceeds via a tunnel west of Marsh Street. It then emerges at
Bexley Road in Kingsgrove. The interchange with Marsh Street is
the primary access route from the motorway network to Terminal 1.
Princes Highway The Princes Highway begins at the intersection of Broadway and Arterial road (Roads and
City Road, extending south through Sydney towards Wollongong. Maritime)
In the vicinity of the project site, the Princes Highway is a six-lane B-double access route
road with sections operating as tidal flow to increase lane capacity
in the peak direction.
Marsh These roads are the key accesses to Terminal 1 and Terminals 2/3 Arterial roads (Marsh
Street/Airport respectively. Airport Drive and Qantas Drive run along and within Street - Roads and
Drive/ the northern boundary of Sydney Airport, and have two lanes in Maritime, Airport
Qantas Drive each direction. These roads provide an important east–west Drive/Qantas Drive -
connection, including between Terminals 1 and 2/3, and for over- Sydney Airport
height or restricted freight vehicles that cannot use General Holmes Corporation)
Drive/M1 due to the low clearance tunnel under the runway. B-double access route
Marsh Street is a six-lane road that links Terminal 1 to the M5 East (Qantas Drive/
across the Cooks River Airport Drive)
Joyce Drive/ Joyce Drive/General Holmes Drive is a state road beginning at the Arterial Road (Roads and
General Holmes intersection of Qantas Drive and O’Riordan Street, extending to Maritime)
Drive meet the M1 on the eastern side of the airport. B-double access route
Botany Road Botany Road is a state road and an important north–south Arterial road (Roads and
connection between the Sydney central business district in the Maritime)
north and Port Botany in the south via Mascot town centre. The
road is generally four to six lanes wide, with bus lanes north of
Wentworth Avenue. Some sections of Botany Road are prohibited
from use by heavy vehicles.
Canal Road, These roads provide a key east–west function across the northern Arterial road (Roads and
Ricketty Street, edge of the study area linking the Princes Highway with the eastern Maritime)
Kent Road and suburbs at Kingsford. The road varies between four and six lanes. B-double access route
Gardeners Road
Foreshore Road Foreshore Road is a four-lane divided road that connects Port Arterial road (Roads and
Botany to General Holmes Drive/M1. It is an important link for road Maritime)
freight to and from the port. B-double access route
O’Riordan Street, These streets form part of the main north–south corridor between Local road
Robey Street the Sydney central business district and Sydney Airport. (Roads and Maritime and
(west of O’Riordan Robey Street is a one-way couplet with O’Riordan Street, which Sydney Airport)
Street) allows traffic entering the airport to use O’Riordan Street, and traffic B-double access route
exiting the airport to use Robey Street.
Chapter 9 Traffic, transport and access 9.13Environmental Impact Statement / Preliminary Draft Major Development Plan
Road Description Road function and
responsible authority
O’Riordan and Robey streets are state roads. O’Riordan Street is
generally four to six lanes wide and has many signal-controlled
intersections.
Bourke Street/ Bourke Street/Bourke Road runs in a north–south direction, Local (Bayside Council)
Bourke Road beginning at O'Riordan Street in Mascot, through the Mascot B-double access route
Station precinct and continuing north through Green Square to along sections
Alexandria/Redfern. It accommodates a separated cycleway
between Coward Street and the central business district.
Bellevue Street/ Bellevue Street is located on both sides of the Botany Rail Line. Local (Inner West
Swamp Road Bellevue Street west (on western side of the rail line) provides Council)
access from the Princes Highway south towards the project site, B-double access route
where it becomes Swamp Road.
9.14 Sydney Gateway Road ProjectT Sydenham
Station
SYDENHAM St Peters
interchange
(under
Ra
MARRICKVILLE construction)
ilw
ay
Ca
Ro
na
ad
lR
ad
oa
Ro
d
ge
Brid
s Cooks River
in Intermodal
w
Un
d
Terminal
oa
sR
ow
rr
Be Str
Bu
lle ee
vu t
e
ad
Ro
Tempe p
nds
T am
North ss Road
Station
nue Sw
ern La
Ave
view
Bay TEMPE
e
Sydney Airport
Ac c
staff car park
et l
EARLWOOD re Cana
St andra
h Alex
ut
So
ay
hw
ig
sH
Wolli Creek ive
Station Dr
ce
T or
t
in
rp
Pr
Ai
Alexandra Canal
shared path
oad
WOLLI
Link R
CREEK
International
Airport
Station
Cooks River
T
Avenue
et
re
St
h
rs Terminal 1
Ma
SYDNEY AIRPORT
Wickham
River
M
Street 5
M Legend
ot
or Major roads
Cooks
w
ARNCLIFFE
Street
ay
Bus routes
Existing cycleways
otany
Botany Rail Line
Sydney Trains rail network (underground)
Weat B
Sydney Trains rail network (aboveground)
Roads and Maritime B-double routes
Sydney Airport (Commonwealth) land
Foreshore Road
KYEEMAGH
0 0.5 1.0km Figure 9.6 Existing transport environment - map 1Legend
ST PETERS Major roads
Bourke Road
cycleway Bus routes
St Peters Existing cycleways
interchange
(under ALEXANDRIA Botany Rail Line
construction)
d Sydney Trains rail network (underground)
s Roa
row l
Bur ana Roads and Maritime B-double routes
draC
xan Sydney Airport (Commonwealth) land
Ale
Caoad
R
na
l
Ric
ke
tty Garden
Stree ers Roa
t d
ROSEBERRY
oad
T Mascot
Kent R
Station
Coward
Street
Qan
et
tas D
re
rive
St
Lanc
astria MASCOT
an
n Ro
rd
ad
Road
io
Lancastrian
’R
O
Road overbridge
Botany
King Str
eet
Ewan
Street
King Str
Robey eet
Robey
Street Street General Holmes Drive
at rail crossing to be
closed as part of
Seventh
Street
Terminal 3 Airport East works
Joyce Dri
Ansett inald
Drive
Ninth
Street
Shiers ve
Avenu Ross Sm
e it
Avenue h
Sir Reg
T
Domestic Kevin e
Extension of EASTLAKES
Airport Smith venu Wentworth Avenue
A
Station as part of Airport
Wentworth Avenue
East works
Terminal 2
Cross Drive
thern
Sou
PAGEWOOD
ive
Dr
d
on
ad
lP
Botany Ro
Mil
SYDNEY AIRPORT
rive
mes D
Hol
BOTANY tree
t
sia S
al
Bank
er
en
G
For
esh
ore
Roa
d
0 0.5 1.0km Figure 9.7 Existing transport environment - map 2Environmental Impact Statement / Preliminary Draft Major Development Plan
9.2.2 Traffic volumes and patterns
In addition to providing access to/from Sydney Airport and towards Port Botany, the roads around Sydney
Airport play a vital role in providing north–south and east–west arterial functions within the regional road
network. They also provide access to surrounding land uses in Mascot. This multitude of roles results in
competition between through traffic and local traffic, leading to congestion, which is more pronounced in
the morning peak period.
Traffic profiles from Roads and Maritime fixed traffic counters provide a profile of traffic volumes and
patterns across a typical weekday, and are shown on Figure 9.8. The morning and afternoon peak periods
are evident from these profiles and correlate with the peak periods selected for use by the Sydney
Gateway Operational Model.
Figure 9.8 shows that in the morning peak, traffic volumes begin to rise steeply from 4am, peaking
between 6am and 7am. This increase, which is earlier than the typical road network (commuter) peak, is a
result of the earlier commencement of airport operations. In the afternoon, peak traffic volumes occur
between 4pm and 7pm. The commuter peak is shown to carry more traffic than the airport peak at these
locations.
Figure 9.8 24-hour traffic volumes at fixed traffic counter locations in 2018
Morning and afternoon peak hour traffic volumes, and average weekday traffic volumes for key roads
within the study area, are summarised in Table 9.5. The percentage of heavy vehicles is also provided.
Table 9.5 2016 morning and afternoon peak and average weekday traffic volumes
Location Direction Morning peak Afternoon peak Average week day
(8am-9am) (5pm-6pm) volumes
Vehicles Heavy Vehicles Heavy Vehicles Heavy
per hour vehicles1 per hour vehicles1 per day vehicles1
(%) (%) (%)
Airport Drive – Eastbound 2,490 7 1,300 8 28,500 8
west of Link Road
Westbound 1,350 6 2,130 6 24,500 7
Eastbound 2,420 7 1,360 7 28,700 8
Chapter 9 Traffic, transport and access 9.17Environmental Impact Statement / Preliminary Draft Major Development Plan
Location Direction Morning peak Afternoon peak Average week day
(8am-9am) (5pm-6pm) volumes
Vehicles Heavy Vehicles Heavy Vehicles Heavy
per hour vehicles1 per hour vehicles1 per day vehicles1
(%) (%) (%)
Qantas Drive – Westbound 1,530 5 2,080 6 24,800 6
east of Seventh
Street
M1/General Eastbound 6,880 8 4,360 8 81,700 10
Holmes Drive/A1
Westbound 3,910 13 7,200 6 87,000 10
Princes Highway – Northbound 2,470 6 1,470 6 27,900 8
west of Railway
Road Southbound 920 16 2,150 6 28,700 9
O'Riordan Street – Northbound 2,120 8 1,530 8 28,800 10
south of King
Street Southbound 1,280 9 1,910 6 25,100 9
Bourke Street – Northbound 610 7 650 2 9,600 4
south of
Gardeners Road Southbound 630 2 380 3 5,400 4
Princes Highway – Northbound 1,610 6 920 5 17,400 7
south of West
Botany Street Southbound 430 12 1,590 4 17,600 7
Robey Street – Eastbound 1,410 9 620 11 14,600 11
west of O'Riordan
Street Westbound 700 9 1,100 6 13,000 9
M1/Southern Eastbound 3,850 4 3,360 4 57,500 4
Cross Drive – east
of Botany Road Westbound 3,520 4 4,330 3 62,500 4
O'Riordan Street – Northbound 1,000 8 830 5 18,100 8
south of Church
Avenue Southbound 900 6 1,110 5 16,500 7
Botany Road – Northbound 1,580 8 1,020 9 16,800 9
south of Coward
Street Southbound 890 10 1,240 8 15,600 10
Foreshore Road – Northbound 1,160 34 1,850 17 22,400 30
south of the M1
Southbound 1,530 20 910 29 18,700 33
General Holmes Northbound 4,440 3 2,100 4 44,200 5
Drive – south of
the M5 East/M1 Southbound 1,500 7 4,820 3 45,000 5
interchange
Canal Road Eastbound 1,450 6 630 13 13,900 12
Westbound 670 18 1,220 7 17,200 11
Gardeners Road – Eastbound 580 7 940 5 11,000 6
east of Bourke
Road
Westbound 550 11 260 8 5,200 9
9.18 Sydney Gateway Road ProjectEnvironmental Impact Statement / Preliminary Draft Major Development Plan
Location Direction Morning peak Afternoon peak Average week day
(8am-9am) (5pm-6pm) volumes
Vehicles Heavy Vehicles Heavy Vehicles Heavy
per hour vehicles1 per hour vehicles1 per day vehicles1
(%) (%) (%)
Burrows Road Northbound 440 7 390 5 5,300 12
Southbound 240 17 310 13 4,500 15
Note: 1. Heavy commercial vehicles are classified as a class 3 vehicle (a two-axle truck) or larger, in accordance with the
Austroads Vehicle Classification System.
Table 9.5 shows that traffic volumes towards the Sydney central business district are typically higher
during the morning peak. Conversely, traffic in the westbound and southbound directions are higher in the
afternoon peak hour. This pattern indicates a strong demand for movement between employment areas in
central Sydney and/or the eastern suburbs, and residential areas to the south and west. However,
Foreshore Drive experiences higher southbound traffic volumes during the morning peak and higher
northbound volumes during the afternoon peak, as it is a major freight route to/from Port Botany.
Table 9.5 also shows that:
Traffic volumes in the morning peak are generally higher than during the afternoon peak, except along
the M1/A1 corridor, where traffic volumes are marginally higher during the afternoon peak
About five to 10 per cent of traffic on the network is heavy vehicles, increasing to 20 to 35 per cent on
Foreshore Road
The M1/General Holmes Drive carries the highest daily traffic volumes, with more than 80,000 vehicles
per day using the corridor in each direction
The M1/Southern Cross Drive and the A1 also carry a high proportion of daily traffic, with around
60,000 and 40,000 vehicles per day in each direction, respectively.
9.2.3 Road network performance
Network performance
Existing road network performance for the morning and afternoon peak periods are summarised as follows:
Congested conditions are apparent throughout the study area during both the morning and afternoon
peaks, with low average speeds of about 25 kilometres per hour
Both peak periods have similar traffic demands and trip lengths
The road network is more congested during the morning peak period than in the afternoon peak, as
represented by longer average trip times due to lower average speeds and more stops.
Intersection performance
Table 9.6 shows the existing performance of intersections within the study area that may be affected by the
project. Both the average delay and level of service is provided for each intersection.
Table 9.6 Existing intersection performance
Intersection 2018 morning peak (8am-9am) 2018 afternoon peak (5pm-6pm)
Average delay Level of Average delay Level of
(seconds) service (seconds) service
West Botany Street/Marsh Street 51 D 26 B
Marsh Street/M5 43 D 68 E
Chapter 9 Traffic, transport and access 9.19Environmental Impact Statement / Preliminary Draft Major Development Plan
Intersection 2018 morning peak (8am-9am) 2018 afternoon peak (5pm-6pm)
Average delay Level of Average delay Level of
(seconds) service (seconds) service
General Holmes Drive/Mill Pond Drive 100 F 39 C
Botany Road/Mill Pond Drive 101 F 103 F
Joyce Drive/General Holmes Drive 152 F 41 C
Botany Road/General Holmes Drive 90 F 49 D
Robey Street/O'Riordan Street 56 D 26 B
Joyce Drive/O'Riordan Street 130 F 52 D
Seventh Street/Qantas Drive 108 F 64 F
King Street/O'Riordan Street 69 E 33 C
O'Riordan Street/Bourke Street 43 D 31 C
Bourke Street/Coward Street 106 F 58 E
Coward Street/O'Riordan Street 78 F 51 D
Gardeners Road/Bourke Street 56 E 43 D
Kent Road/Ricketty Street 36 C 42 C
Botany Road/Gardeners Road 81 F 65 E
Kent Road/Coward Street 103 F 59 E
Canal Road/Burrows Road 59 E 93 F
Airport Drive/Link Road 6 A 6 A
O'Riordan Street/Gardeners Road 98 F 119 F
The information in Table 9.6 shows that:
In the morning peak, most of the intersections operate at a level of service E or F, with only four
intersections operating at a level service D or better. This indicates a generally high level of delay at
most intersections, which is consistent with the overall network performance
Intersection performance improves slightly during the afternoon peak, with eight of the modelled
intersections operating at a level of service D or better
The two intersections that provide access to Terminals 2/3 (O’Riordan Street/Joyce Drive/Sir Reginald
Ansett Drive and Seventh Street/Qantas Drive) experience longer delays (longer than the 120 second
traffic light cycle times), which results in substantial delays to vehicle movements at these locations.
Despite the delays at these intersections, the existing network is generally able to accommodate the
existing traffic demands in the morning and evening peaks
Similar to intersection performance, average delays are generally greater in the morning than the
evening.
9.2.4 Public transport
Public transport within the study area includes rail and bus services. According to 2016 census data (ABS,
2016), a relatively high proportion of people use public transport within the area, predominantly rail.
Rail
The T8 Airport and South Line passes underground, with stations at Mascot (Mascot Station), Terminal 1
(International Airport Station) and Terminals 2/3 (Domestic Airport Station). The T8 line crosses under
9.20 Sydney Gateway Road ProjectEnvironmental Impact Statement / Preliminary Draft Major Development Plan Joyce Drive and the Botany Rail Line and follows the alignment of O’Riordan Street to the north. Services are operated by Sydney Trains. The stations in the study area are privately owned. The location of the line and stations are shown on Figure 9.6 and Figure 9.7. Bus networks Several bus routes operate along key roads in the study area. In the immediate vicinity of the project site, routes 305, 400, 420 and 420N operate along Qantas Drive and Airport Drive, including stops on Qantas Drive at Lancastrian Road within the project site. These routes, which include stops at Terminal 1 and Terminals 2/3, are shown on Figure 9.6. The bus stops on Qantas Drive are used by relatively few passengers, with historical Opal card data indicating that less than 20 passengers per day use these stops. Route 400 operates between Bondi Junction and Sydney Airport. Routes 420 and 420N operate between Burwood and Eastgardens Shopping Centre in the east. These routes have a frequency of about 20 minutes. Other bus routes are generally located around Mascot Station to the north of the project site and along Princes Highway to the west. Botany Road serves the highest frequency of buses overall with up to 35 buses per hour in the peak period. As a major bus corridor, bus lanes are provided on Botany Road north of Wentworth Avenue. These are the only bus lanes located in the study area. 9.2.5 Active transport Active transport (ie pedestrian and cyclist) networks within the study area are described below. Recent upgrades to these networks have improved active transport connections across the study area. Cycle networks The cycle network consists of a combination of types, including cycleways, shared paths, recreational and on-road facilities. The quality of this infrastructure varies from poor (most notably along parts of Qantas Drive) to excellent, such as the new facilities along the recently upgraded Marsh Street. Local councils have proposed cycling infrastructure within or adjacent to the project site. The key cycling infrastructure in the study area is made up of three off-road links: The Alexandra Canal cycleway Cooks River shared path and its connections The Bourke Road cycleway. The Alexandra Canal cycleway is located within the project site (shown on Figure 9.6) and forms the main east–west and north–south connections for active transport across the study area. The path runs adjacent to Airport Drive and connects to Terminal 1 via Tempe Recreation Reserve and Wolli Creek, and surrounding areas via Marsh Street. To the east, the path continues north along Alexandra Canal before joining Coward Street to connect with the Bourke Road Cycleway in Mascot, which travels to the Sydney central business district. Less than one per cent of journeys to work in the Bayside local government area are made by cycling. About three per cent of journeys to work within the Inner West local government area are made by cycling. Pedestrian networks The pedestrian network generally consists of footpaths, shared paths (pedestrian/cyclist) and dedicated road crossings. The local and arterial roads in the study area provide typical footpaths along their length. Streets in Mascot (including around Mascot Station and in Mascot generally) provide a higher degree of pedestrian amenity due to the network of small or detailed streetscapes and mix of residential and commercial land uses. Pedestrian facilities are generally limited near Sydney Airport, with many facilities of poor quality due to uneven pavements and limited separation from busy roads. Chapter 9 Traffic, transport and access 9.21
Environmental Impact Statement / Preliminary Draft Major Development Plan
Pedestrian accessibility to Terminal 1 via Marsh Street and Airport Drive is poor due to narrow footpaths on
the Giovanni Brunetti bridge and flyovers at Airport Drive. However, there is a direct link from the
Alexandra Canal shared path to the Terminal 1 precinct via a pedestrian/cycle bridge and overpass.
Terminals 2/3 is linked to the Mascot Station precinct with pedestrian access provided via Robey and
O’Riordan streets. Upgrades to the pedestrian network on Seventh Street, Sir Reginald Ansett Drive and
Qantas Drive have recently been completed by Roads and Maritime. There is a narrow footpath continuing
from the Alexandra Canal cycleway on the northern side of Airport Drive and into Qantas Drive linking to
the west of Robey Street.
A footpath on Canal Road provides access over Alexandra Canal between Ricketty Street and
Princes Highway.
Nearly four per cent of journeys to work in the Bayside local government area are made by walking only.
About 5.5 per cent of journeys to work within the Inner West local government area are made by walking.
Active transport activity
Roads and Maritime collected pedestrian and cyclist data along the Alexandra Canal cycleway in
March 2019. The data indicates that, on average, the Alexandra Canal cycleway carries around 600
cyclists and 100 pedestrians per day. Peak usage occurs during the weekday morning and afternoon peak
periods, when the cycleway carries around 90 cyclists and 10 pedestrians during the morning peak and
afternoon peak hours.
9.2.6 Parking
Off-street parking
The following off-street parking areas are located within and adjacent to the project site:
The Sydney Airport northern lands car park located on the western side of Alexandra Canal, which is
accessed from Airport Drive via the Nigel Love bridge, and is used by Sydney Airport employees at
times of peak demand
A car parking area east of Terminals 2/3, located south of AMG Sydney and accessed off Ninth Street
Two car parking areas east of Terminals 2/3, accessed off Ross Smith Avenue and Sir Reginald Ansett
Drive respectively, which are leased to DHL
Parking within the Sydney Airport Terminal 1 freight facilities.
Public car parks are also located adjacent to Terminal 1 (P7 and P9) and Terminals 2/3 (P1, P2 and P3).
The car parks at Terminal 1 have capacity for about 4,000 vehicles. The car parks at Terminals 2/3 have
capacity for about 4,200 vehicles. None of these car parks are located within the project site.
Recent capacity upgrades to public car parks are discussed in section 9.2.8.
On-street parking
No roadways close to the project site provide on-street parking. The following streets, along proposed
haulage routes, include parking:
Botany Road, outside of clearway and bus lane operating periods
Ricketty Street, outside of clearway periods.
9.22 Sydney Gateway Road ProjectYou can also read