Challenges and Transformation in China's Food Chain - December, 2018
←
→
Page content transcription
If your browser does not render page correctly, please read the page content below
Challenges and
Transformation in
China’s Food Chain
December, 2018

Introduction                                                         3

Challenges                                                           4

Highly fragmented produce and crop production                        5
Highly fragmented livestock farming and meat processing              5
Highly fragmented dairy production                                   8
Input-driven agricultural growth                                     8
Resource scarcity and environmental protection                      10
Low efficiency and productivity                                     11
Import dependency                                                   14
Limited cold chain capacity                                         16
Fragmented restaurant and retail sectors                            17
Food safety management and food fraud vulnerability                 19
Complex regulatory and enforcement structure                        20
Urbanisation, social media, rising urban income and rural welfare   21

Transformations                                                     21

Dairy                                                               23
Pork                                                                30
Crops                                                               33
Cold chain                                                          36
Chain restaurants                                                   37
Groceries and e-commerce                                            38
Online restaurant ordering and delivery                             39
Traceability                                                        40
Food fraud                                                          41
Harnessing e-commerce and new business models to improve            42
supervision and enforcement

Keys to success                                                     43
Introduction

                                                                                    After four decades of rapid growth, China is one of the world’s
                                                                                    largest producers and consumers of food and agricultural
                                                                                    products. The country is now the world’s largest producer of
                                                                                    pork, mutton, fish, fruits, vegetables, wheat, tea and eggs. It is
                                                                                    the second largest producer of chicken meat, and the third
                                                                                    largest producer of milk and beef. The growth launched by
                                                                                    Deng Xiaoping’s “Reform and Opening” has vastly improved
                                                                                    nutrition and quality of life for China’s consumers, while raising
                                                                                    income for hundreds of millions of China’s farmers.

                                                                                    But the speed of production growth, increasing complexity of
                                                                                    supply chains and highly fragmented industry structure have
                                                                                    created food safety and quality challenges for regulators.

                                                                                    With 230 million farms,1 China’s agricultural sector is incredibly
                                                                                    fragmented and difficult to supervise; the vast majority of farms
                                                                                    are too small to fully benefit from industrial farming methods,
                                                                                    modern technology and agricultural best practices. This is
                                                                                    changing, however, as corporations and investors build some of
                                                                                    the world’s largest livestock operations and reforms of the rural
                                                                                    land rights system enable consolidation of farmland.

                                                                                    With approximately eight million restaurants,2 supervision of the
                                                                                    retail end of the supply chain is also difficult. At the same time,
                                                                                    China’s two leading online restaurant delivery platforms now
                                                                                    use the most advanced technology in the world to sell and
                                                                                    deliver meals from millions of restaurants to hundreds of
                                                                                    millions of customers. These well-funded platforms are enabling
                                                                                    tighter supervision and enforcement of food safety and quality
                                                                                    regulations, and are creating possibilities for automated,
                                                                                    accurate and granular traceability on a massive scale.

                                                                                    Not only does China’s food supply chain encompass enormous
                                                                                    contrasts between the traditional and the modern, but the
                                                                                    continuing speed and scale of its transformation is truly historic.

                                                                                    This report will cover the major challenges faced by China’s
                                                                                    food and agriculture sectors, take a detailed look inside the
                                                                                    many areas of its ongoing transformation, and outline some
                                                                                    keys to success for companies looking to enter or grow in
                                                                                    China’s food sector.

   1 2017 China Agriculture Yearbook
   2 China Cuisine Association, China Catering Industry Development Report (2018)

   3 | Challenges and Transformation in China’s Food Chain
Challenges

Challenges: Highly fragmented produce and crop production
China had 230 million farms in 2016, with an average of                                                     assigned to each rural household small, but it is often split
0.6 hectares of arable land. In contrast, the EU has 11                                                     among several non-contiguous plots. A 2003 study found
million farms with an average size of 16 hectares, while the                                                that, on average, each rural household’s land was split
US has only 1.6 million farms with an average size of more                                                  among 5.7 separate plots of about 0.1 hectare apiece4.
than 100 hectares 3. This structure is largely due to China’s                                               This further fragmentation was brought about when the
system of rural land rights, the Household Responsibility                                                   HRCS was launched in the 1980s. Plots of farmland were
Contract System (HRCS), where each rural household is                                                       assessed and assigned quality levels. Households within a
assigned non-transferable rights to specific parcels of                                                     commune were then often assigned equal amounts of land
farmland. Not only is the average amount of farmland                                                        from each quality level in order to ensure fair distribution.5

Number of farms with arable land6                                                                           Average arable land per farm (hectares)7

                230 million
                                                                                                                                                                           102

                                                                                                                                                      16
                                         11 million                                                                             0.6
                                                                1.6 million

                   China                   EU-28                      US                                                      China                 EU-28                    US

Challenges: Highly fragmented livestock farming and meat processing
China’s livestock sector is also highly fragmented. Nearly                                                 China has nearly 21 million farms that raise broilers
43 million farms raise hogs, compared to 2.2 million in the                                                (chickens raised for meat), compared to 2 million in the EU
EU and only 56,000 in the US. About half of China’s hogs                                                   and only 33,000 in the US. Most of China’s broilers come
come from farms that produce fewer than 500 per year                                                       from small and medium-sized farms that produce fewer
while in the US, 90% of hogs come from farms that                                                          than 50,000 per year. By contrast, more than 95% of US
annually raise more than 5,000.8                                                                           broilers come from large farms that produce more than
                                                                                                           200,000 annually.9

Farms that raise pigs for slaughter10                                                                      Farms that raise broilers11

               42.6 million                                                                                           20.5 million

                                                                                                                                             2.2 million
                                        2.2 million                                                                                                                33 thousand
                                                              56 thousand
                   China                   EU-28                      US                                                  China                 EU-28                    US

3 2017China Agriculture Yearbook; 2017 China Land, Mineral and Ocean Resources Statistics Bulletin, Eurostat, 2012 USDA Census of Agriculture
4 Rural 2003, as referenced in Li G. K .and Zhong F. N., 2006.,“Farmland fragmentation, labour utilization and farmers’ income”, Chinese Rural Economy, (4): 42-48. (in Chinese) Economy Research Center of the
Ministry of Agriculture,
5 中国共产党新闻网,《农村基本经营制度:理论评价与现实选择》, 10 Dec 2013, http://theory.people.com.cn/n/2013/1210/c40531-23800719.html
6 2017China Agriculture Yearbook ; Eurostat; 2012 USDA Census of Agriculture
7 2017China Agriculture Yearbook ; 2017 China Land, Mineral and Maritime Resources Statistics Bulletin; Eurostat, 2012 USDA Census of Agriculture
8 2012 USDA Census of Agriculture; Eurostat; 2017 China Animal Husbandry and Veterinary Yearbook; National Hog Production Development Plan (2016-2020)
9 2012 USDA Census of Agriculture; Eurostat; 2017 China Animal Husbandry and Veterinary Yearbook
10 2012 USDA Census of Agriculture; Eurostat; 2017 China Animal Husbandry and Veterinary Yearbook
11 2012 USDA Census of Agriculture; Eurostat; 2017 China Animal Husbandry and Veterinary Yearbook

5 | Challenges and Transformation in China’s Food Chain
China produces and consumes about half of the world’s                                                In 2015, the top eight slaughterhouse companies
pork. Pork production is fragmented not only at the farm                                             accounted for only about 10% market share13 and the top
level, but also the corporate level. In 2016, the top 10 hog                                         50 slaughterhouse enterprises only accounted for only
farming companies accounted for only 5.8% of all hogs                                                18% market share.14
produced.12 Meat processing is also highly fragmented.

Market share of top 10 hog producers                                                                 Market share of top 8 pork processors
(by owned breeding sow inventory)15                                                                  (by total hogs slaughtered)16

                                                                                                     100%

40%                                                                                                    80%

30%                                                                                                    60%

20%                                                                                                    40%

10%                                                                                                    20%

  0%                                                                                                     0%
                  China                       EU                        US                                               China                      EU                        US
In 2016, China had more than 11,000 designated hog                                                   According to the Hog Slaughtering Management Rules
slaughterhouses, i.e. slaughterhouses licensed according                                             issued by the State Council, only designated
to national food safety, biosecurity and environmental                                               slaughterhouses can slaughter hogs; but the Rules include
protection standards. The combined annual capacity of                                                two exceptions: individuals in rural areas can slaughter
these designated slaughterhouses was about 1 billion                                                 hogs for their own consumption, and local governments
hogs, according to estimates from various government                                                 can authorise small-scale slaughterhouses for areas that
sources.17 Of these 11,000 designated slaughterhouses,                                               are not served by designated slaughterhouses.
only 10% were fully mechanised, only 20% were partially
                                                                                                     Only 307 million hogs,19 about 45% of China’s 2016 hog
mechanised, and the remaining 70% were manual.18 There
                                                                                                     production, were slaughtered in designated
were fewer than 3000 “scale” slaughterhouses (i.e.
                                                                                                     slaughterhouses. These statistics indicate that the average
slaughterhouses with annual capacity of 20,000 or more
                                                                                                     capacity utilisation for designated slaughterhouses was
hogs.) China’s leading hog farming and meat processing
                                                                                                     only about 30%. The remaining nearly 400 million hogs
companies are aggressively expanding modern
                                                                                                     produced in 2016 were slaughtered privately or at facilities
slaughterhouse capacity.
                                                                                                     that likely did not meet national government standards for
                                                                                                     food safety, biosecurity and environmental protection.

Hog slaughterhouse mechanisation                                                                     Utilisation of designated slaughterhouses and
(% of designated slaughterhouses)20                                                                  total hogs slaughtered in 201621

100%
                      10%                           Fully mechanised

                      20%                           Partially mechanised

                                                    Manual

                                                                                                           1 billion
 50%
                                                                                                                                        0.7 billion
                      70%

                                                                                                                                                                       0.3 billion

                                                                                                  Total designated hog                   Total hogs              Hogs slaughtered in
   0%                                                                                               slaughterhouse                      slaughtered                  designated
             Designated hog                                                                         annual capacity                                               slaughterhouses
             slaughterhouses
12 张广安, 在2017年5月16日-17日召开的第五届全球猪业论坛暨第十五届(2017)中国猪业发展大会,养殖‖中国猪业发展报告发布, http://www.sohu.com/a/141938624_785860
13 WattAgNet.com; USDA Livestock Slaughter 2015 Summary; China Animal Husbandry and Veterinary Yearbook
14 WattAgNet.com; China Animal Husbandry and Veterinary Yearbook; National Hog Production Development Plan (2016-2020), Apr 2016
15 Successful Farming, “What You Need to Know About China’s Swine Industry”, 12 Jan 2018; China Animal Husbandry and Veterinary Yearbook; WattAgNet.com; National Hog Farmer, “Get Acquainted with
Global Mega Producers”, 7 Jun 2017; Eurostat; USDA Quarterly Hogs and Pigs
16 WattAgNet.com; China Animal Husbandry and Veterinary Yearbook ; Eurostat; USDA Livestock Slaughter Summary
17 中国环境科学研究院、中国肉类食品综合研究中心、中国轻工业清洁生产中心,《屠宰与肉类加工工业水污染物排放标准(征求意见稿)》编制说明, Nov 2017; 张凤,《生猪屠宰管理中存在的问题及对策》,
河南畜牧兽医(综合版), 2016,37(10)
18 《屠宰与肉类加工工业水污染物排放标准(征求意见稿)》编制说明, Nov 2017
19 2017 China Agricultural Yearbook
20《屠宰与肉类加工工业水污染物排放标准(征求意见稿)》编制说明, Nov 2017
21《屠宰与肉类加工工业水污染物排放标准(征求意见稿)》编制说明, Nov 2017; 张凤,《生猪屠宰管理中存在的问题及对策》, 河南畜牧兽医(综合版), 2016,37(10); 2017 China Agricultural Yearbook

6 | Challenges and Transformation in China’s Food Chain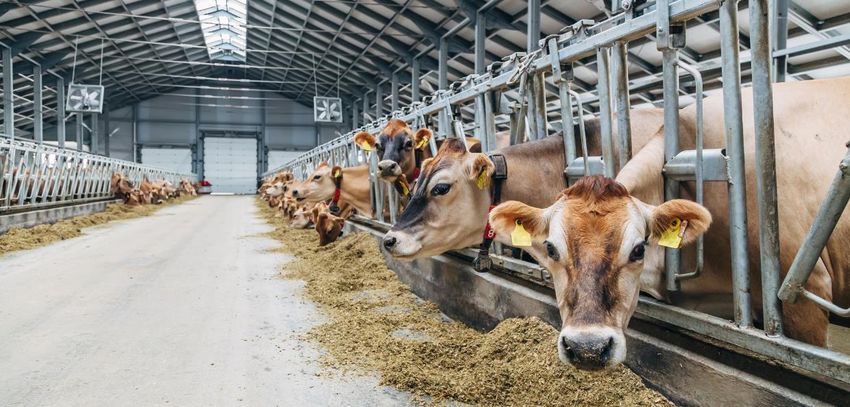
The fragmented structure of the livestock and processing industries makes it difficult to control biosecurity risks. China’s
pork industry has been plagued by extreme market fluctuations, with price increases triggered by epidemics, subsequent
overinvestment, oversupply and price drops.

According to the Dalian Commodities Exchange, the four major cycles since 2003 involved swings of 65%, 183%, 113%
and 83%.22 Recent measures to control the spread of African Swine Fever, including restrictions on the transportation of
live hogs and closing of some live markets, have resulted in price spikes in regions of net pork consumption and price
drops in hog producing regions where outbreaks have occurred. These market swings make investment risky, and are
especially perilous for small-scale livestock farmers.

China live hog price fluctuations (CNY/100g)23

                 25

                 20

                 15

                 10

                   5

                   0

22 Dalian Commodity Exchange, “Live Hogs Industry Expects Futures to Help on the ‘Hog Cycle’ Problem”, 01 Aug 2017, http://www.dce.com.cn/DCE/Media_Center/Exchange%20News/6052631/index.html
23 MARA; USDA

7 | Challenges and Transformation in China’s Food Chain
Challenges: Highly fragmented dairy production
           China’s dairy production is also highly fragmented. In      averaging 11 cows per farm. In contrast, the US had 42
           2016, China had more than 1.3 million dairy farms,          thousand farms, with an average of over 220 cows per
                                                                       farm.24

           Number of dairy farms25                                     Average size of dairy farms (number of cows)26

                   1.3 million                                                                               419

                                                                                               223

                                        42 thousand                              11
                                                      11 thousand

                      China                   US      New Zealand               China          US        New Zealand

           Challenges: Input-driven agricultural growth
           Since 1980, China’s major crop production has tripled but   Pesticide use has more than doubled since 1991,27 and
           farmland has increased by only 10%. Growth was largely      China’s farmers use about five times the amount of
           driven by increased factor inputs such as pesticides and    pesticides28 per hectare as farmers in the US.
           chemical fertiliser.

           Pesticide use 1991-2015                                     Pesticide use per hectare of arable land
           (tonnes)29                                                  (kg/hectare)30

                                                                       14
           1.8
                                                                       12
millions

                                                                       10
           1.2
                                                                        8

                                                                        6
           0.6
                                                                        4

                                                                        2

           0.0                                                          0
                                                                            China       US     France   Germany     United
                                                                                                                   Kingdom

           24 2018 China Dairy Data Report
           25 2018 China Dairy Data Report
           26 2018 China Dairy Data Report
           27 National Bureau of Statistics
           28 FAOSTAT
           29 National Bureau of Statistics
           30 FAOSTAT

           8 | Challenges and Transformation in China’s Food Chain
The use of chemical fertiliser quadrupled between 1980 and 2010,31 and China’s farmers use more than three times the
            amount of chemical fertiliser per hectare as farmers in the US. 32

            Chemical fertiliser use 1980-2016                                                                    Chemical fertiliser use per hectare of arable land
            (tonnes)33                                                                                           (kg/hectare)34

                                                                                                                 500
               60

               50                                                                                                400

               40
                                                                                                                 300
millions

               30
                                                                                                                 200
               20

                                                                                                                 100
               10

                  0                                                                                                  0
                       1980
                       1982
                       1984
                       1986
                       1988
                       1990
                       1992
                       1994
                       1996
                       1998
                       2000
                       2002
                       2004
                       2006
                       2008
                       2010
                       2012
                       2014
                       2016

                                                                                                                                  China                        EU                        US

            China’s livestock industry consumes far more antibiotics                                             antibiotics residues in meat products, excessive or
            than the US or Europe. According to a 2015 research                                                  improper use of antibiotics increases the risk of epidemics
            report, China used an estimated 80 thousand tonnes of                                                among livestock from antimicrobial resistant superbugs, as
            veterinary antibiotics in 2013,35 compared to about 15                                               well as antimicrobial resistant zoonotic diseases that could
            thousand tonnes in the US and about eight thousand                                                   be transmitted to humans. Excessive antibiotics usually
            tonnes in Europe.36 In addition to the risk of excessive                                             end up in waterways via agricultural waste.

            Estimated veterinary antibiotic consumption in 2013
            (tonnes/year)37

                       80

                       60
           thousands

                       40

                       20

                       0
                              China                US                EEC

            31 National Bureau of Statistics
            32 World Bank
            33 National Bureau of Statistics
            34 World Bank (nitrogen, potash and phosphate fertilizers)
            35 Chinese Academy of Sciences, 《科学家获取首份中国抗生素使用量与排放量清单》, 11 Jun 2015, http://www.cas.cn/cm/201506/t20150612_4372924.shtml
            36 European Medicines Agency, Sales of Veterinary Antimicrobial Agents in 26 EU/EEA Countries; US FDA, 2013 Summary Report on Antimicrobials Sold or Distributed for Use in Food-producing Animals
            37 Chinese Academy of Sciences, 《科学家获取首份中国抗生素使用量与排放量清单》, 11 Jun 2015, http://www.cas.cn/cm/201506/t20150612_4372924.shtml; European Medicines Agency, Sales of Veterinary
            Antimicrobial Agents in 26 EU/EEA Countries; US FDA, 2013 Summary Report on Antimicrobials Sold or Distributed for Use in Food-producing Animals

            9 | Challenges and Transformation in China’s Food Chain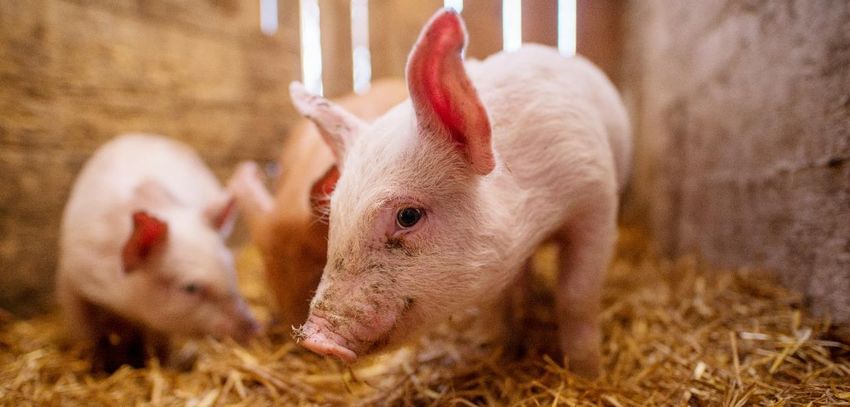
Challenges: Resource scarcity and environmental protection
Resource scarcity and pollution are two of the biggest challenges faced by China’s agricultural sector. China produces a
quarter of the world’s food with less than 10% of the world’s arable land38 and only 7% of its fresh water.39 China has less
than 0.1 hectare of arable land per capita, compared to nearly 0.5 hectares per capita in the US.40

Arable land per capita (hectares/person)41

                 China                                     0.1

                     EU                                                                             0.2

                     US                                                                                                                                                                     0.5

80% of the country’s fresh water resources are in the
Yangtze River and the South, but about 70% of its
farmland is in the North.42 This requires massive irrigation
from underground aquifers and China’s enormous south-
                                                                                                                                                  70%
                                                                                                                                                  of China’s farmland
to-north aqueduct. China’s irrigation efficiency index is
                                                                                                                                                  is in the North.
about 0.53,43 meaning that almost 50% of water is lost in
delivery, compared to only 20-30% water loss in mature
economies.44

As consumers’ income has grown, their diets have shifted
                                                                                                                                                  80%
towards animal products. Per capita meat consumption                                                                                              of China’s water resources
grew from less than 21 kg per year in 1991 to more than                                                                                           are in the South.
50 kg per year in 2016.45 While pork and chicken account
for most of this, beef and mutton consumption have been
growing 3-4 times more quickly than pork.46                                                               Excessive use of chemical fertilisers has caused both soil
                                                                                                          acidification and water pollution.49 Rapid industrialisation
Production of animal products generally consumes more
                                                                                                          has also have caused water pollution. According to a
water per calorie than crops and produce, due to the
                                                                                                          report published in 2017 by the Ministry of Environmental
quantity of animal feed that must be cultivated. According
                                                                                                          Protection, more than 60% of underground water sources
to estimates, producing one calorie of pork or chicken
                                                                                                          surveyed were “bad” or “very bad”, and 30 of 60 major
meat is estimated to require 4-7 times more water than
                                                                                                          lakes were polluted.50
producing a single calorie of cereal crops; producing one
calorie of beef requires about 20 times more water than                                                   Industrial pollution has also contributed to soil
producing of one calorie of rice.47 As meat consumption                                                   contamination. According to a national survey on soil
increases, so will the demands on China’s scarce water                                                    quality published in 2014 by the Ministry of Environmental
resources.                                                                                                Protection and the Ministry of Land and Resources, 19% of
                                                                                                          arable land surveyed exceeded national soil pollution
Animal waste from livestock farming is a major source of                                                  standards; cadmium, nickel, copper, arsenic, mercury,
water pollution. While pork meat production has grown to                                                  lead, DDT and polycyclic aromatic hydrocarbons were
more than 56 million tonnes per year, pig farming produces                                                cited as major contaminants.51
more than 600 million tonnes of excrement annually.48

38 Li Wei, “Accelerate Transforming Agriculture and Bring New Driving Forces for Safeguarding Food Security and Food Safety”, 16 Dec 2015,text from speech to the China Food Security & Food Safety Strategy
Summit, http://www.drc.gov.cn/zjsd/20151216/4-4-2889567.htm
39 Lamb, Cate, “How Should Business React to China's Water Crisis?”, 21 Jul 2016, World Economic Forum, https://www.weforum.org/agenda/2016/07/what-china-s-new-approach-to-water-means-for-business/
40 World Bank
41 World Bank
42 Zhang Zhengbin and Xu Ping, “Governance of Food and Water Security in China, with Reference to Farming in Northwest Areas”, in Food and Water Security, ed. U Aswathanarayana (CRC Press, 2007)
43 National Agriculture Modernisation Plan (2016—2020), Oct 2016
44 Li Wei, “Accelerate Transforming Agriculture and Bring New Driving Forces for Safeguarding Food Security and Food Safety”, 16 Dec 2015, text from speech to the 3rd China Food Security & Food Safety
Strategy Summit, http://www.drc.gov.cn/zjsd/20151216/4-4-2889567.htm
45 OECD
46 OECD
47 Mekonnen, M.M., Hoekstra, A.Y., Ecosystems (2012) 15: 401, https://doi.org/10.1007/s10021-011-9517-8
48 National Hog Production Development Plan (2016-2020), Apr 2016
49 Ministry of Agriculture, 农业部关于印发《到2020年化肥使用量零增长行动方案》和《到2020年农药使用量零增长行动方案》的通知, 18 Mar 2015
http://jiuban.moa.gov.cn/zwllm/tzgg/tz/201503/t20150318_4444765.htm
50 Ministry of Environmental Protection, 2016 Report on the State of the Environment in China, Jun 2017, http://www.mep.gov.cn/hjzl/zghjzkgb/lnzghjzkgb/201706/P020170605833655914077.pdf
51 Ministry of Environmental Protection and Ministry of Land and Resources, National Soil Pollution Survey Report, Apr 2014, http://www.zhb.gov.cn/gkml/hbb/qt/201404/W020140417558995804588.pdf

10 | Challenges and Transformation in China’s Food Chain
Challenges: Low efficiency and productivity
China’s agricultural production is still inefficient compared soy, which has become China’s largest agricultural import.
that of the US and the EU. The following examples from China’s average feed conversion ratio (i.e. the amount of
pork, dairy and staple crop production illustrate some of feed required to produce an additional kg of growth) is
the many factors involved. higher than that of farms in the US and Europe.
In recent years, the average production cost for hogs in China lags in the number of pigs weaned per sow per year
China has been approximately twice that of the US.52 Feed (PSY), another measure of productivity. Other factors
often accounts for more than 60% of production costs.53 contributing to production costs include cost of piglets,
China corn prices are much higher than in the US, and as labour productivity, genetic quality, veterinary expertise
China’s industry shifts from household production to scale and farm management.
farms, hog farming is increasingly dependent on imported
2016 pork production cost Estimated feed conversion Average pigs weaned per sow
estimate (CNY/kg)54 ratio on scale farms per year (PSY) estimate56
(kg feed/kg of weight gain)55
27.5 25.7
16.1 3.0 2.8 2.7
11.4 17
7.7
China EU US China Germany US China EU US
52 2017 China Animal Husbandry and Veterinary Yearbook, AHDB Pig Cost of Production in Selected Countries
53 National Hog Production Development Plan (2016-2020) , Apr 2016
54 2017 China Animal Husbandry and Veterinary Yearbook; AHDB Pig Cost of Production in Selected Countries
55 China Animal Agriculture Association, Annual Report on Development of Swine Industry in China (2016)
56 2017 Company reports; 2016 AHDB Pig Cost of Production in Selected Countries
11 | Challenges and Transformation in China’s Food ChainChina’s dairy industry also faces cost and efficiency countries — especially New Zealand, the largest source of
challenges. In recent years, China’s raw milk prices have China’s dairy imports.
generally been higher than those of most dairy exporting
2017 raw milk price (CNY/litre)57
6
5
4
3
2
1
0
Argentina Uruguay Chile New Zealand USA EU Brazil Russia China Japan
As China’s dairy production shifts from household farms to
commercial scale farms, the industry is becoming more 2017 raw milk yield per dairy cow (litres/cow/year)58
dependent on commercial feed, which is more expensive
in China than other major dairy countries. 12
10
Productivity per dairy cow is lower than most major dairy
thousands
8
producing countries. Factors contributing to productivity 6
per cow include genetic quality, farm management skills, 4
feed and feeding techniques (e.g. TMR), dairy farm 2
facilities, veterinary care, etc. 0
Fragmented cropland hinders mechanization, resulting in
labour intensive farming. Economic development and
industrialization have increased the cost of labour, while
enticing workers to move from the countryside to the cities.
The rural labour force is decreasing and aging while labour 2007 to 5.3 in 2016 for China’s three main staple crops
costs are rising.59 (rice, corn and wheat) but labour cost per mu rose by more
than 240%. In spite of a 13% increase in yields during the
According to the NDRC’s annual Agricultural Production same period, the NDRC report indicates that production of
Costs and Returns Compilation, the average number of these three staple crops, on average, became unprofitable
person-days of labour per mu of farmland fell from 8.7 in in 2016.60
Average profit margin and labour cost as a % of market price for staple crops (corn, wheat and rice)61
50%
40%
30%
Labour Cost / Value of harvest (%)
20% Profit / Value of harvest (%)
10%
0%
-10%
2009 2010 2011 2012 2013 2014 2015 2016
57 2018 China Dairy Data Report
58 2018 China Dairy Data Report
59 State Council Development Research Center, Agricultural Economies of Scale Development Working Group, “China Agriculture Economies of Scale Development and Problems”, 13 May 2016,
http://www.chinareform.org.cn/Economy/Agriculture/Report/201605/t20160513_248889.htm
60 NDRC, China Agricultural Production Costs and Returns Compilation 2012 & 2017
61 NDRC, China Agricultural Production Costs and Returns Compilation 2012 & 2017
12 | Challenges and Transformation in China’s Food ChainChallenges: Import dependency
After the melamine incident of 2008, China’s overall dairy much of which is imported. Prior to 2008, China’s alfalfa
output growth slowed and production began shifting from imports were practically zero. In 2015, China’s dairy and
small household farms to dairy cooperatives and large livestock farms consumed 3 million tonnes of quality
scale intensive dairy farms. While small farms often raise alfalfa, of which 1.2 million tonnes were imported. With
or gather their own forage and feed, larger scale growth in the number of scale livestock farms, China’s
operations depend on commercially purchased feed, which demand for quality alfalfa is expected to reach 6.9 million
is more expensive. In China, large scale dairy farms tonnes by 2020, of which 90% will be for dairy farms.62
require significant amounts of alfalfa and other forage,
Alfalfa and other forage products imports (tonnes)63
1.8
1.6
1.4
1.2
1.0
millions
0.8
0.6
0.4
0.2
0.0
2005 2006 2007 2008 2009 2010 2011 2012 2013 2014 2015 2016 2017
While growth in domestic raw milk production slowed after supplied 80% of the 2008-2015 increase in dairy
2008, demand for dairy products continued to increase and consumption. The government aims to maintain a self-
imports grew dramatically. According to the National Dairy sufficiency ratio of 70% or greater for dairy products.64
Industry Development Plan (2016-2020), import growth
Dairy imports (tonnes)65
1.2
Whey Whole milk powder Skim milk powder
1.0
0.8
millions
0.6
0.4
0.2
0.0
62 National Alfalfa Production Development Plan (2016-2020), Dec 2016
63 UN Comtrade Database
64 National Dairy Industry Development Plan (2016-2020), Dec 2016
65 UN Comtrade Database
13 | Challenges and Transformation in China’s Food ChainAs larger scale livestock farms have begun to displace soybean consumption.66 China now accounts for more
small household farms, China’s livestock industry has than 60% of global soybean imports.67
become dependent on commercial feed, a significant
China has a self-sufficiency ratio of only 32% for edible
portion of which consists of imported soy beans and soy
vegetable oil. It is the world’s largest importer of vegetable
meal. Soybeans are also used to produce oil and other
oil, and one of the largest importers of oilseeds.68
food products for human consumption. In 2017 China
relied on imports to supply more than 85% of domestic
Soy imports (tonnes)69
90
80
70
60
millions
50
40
30
20
10
0
In spite of growing pork imports during recent years, China of China’s total pork consumption.70 Measures to control
is practically self-sufficient for pork products. Pork imports and prevent African Swine Fever outbreaks, e.g.
grew from less than 500,000 tonnes in 2011 to over 1.6 restrictions on transporting hogs and pork products, could
million tonnes in 2016 but total imports peaked at only 3% cause demand for imports to increase again in 2019.
Pork imports (as % of consumption)71
3.0%
Pork imports as % of consumption
2.5%
2.0%
1.5%
1.0%
0.5%
0.0%
2003 2004 2005 2006 2007 2008 2009 2010 2011 2012 2013 2014 2015 2016 2017
66 MARA, 《做强大豆产业推动区域经济发展 – 对黑龙江省大豆产业现状的分析与思考》, 27 Jun 2018,http://www.moa.gov.cn/xw/qg/201806/t20180627_6153261.htm
67 UN Comtrade Database
68 中华人民共和国厦门海关,《1-9月厦门关区食用植物油进口量价齐升》, 26 Oct 2017, http://www.customs.gov.cn/xiamen_customs/491078/491080/491082/1190157/index.html
69 UN Comtrade Database
70 UN Comtrade Database
71 UN Comtrade Database
14 | Challenges and Transformation in China’s Food ChainChallenges: Limited cold chain capacity
Most of China’s agricultural products do not enter the cold chain. According to the China Cold-chain Logistics Development
Report, only 22% of China’s fruits and vegetables, 34% of China’s meat, and 41% of China’s aquatic products entered the
cold chain in 2015.72 In Europe and the US, 95-100% of these products enter the cold chain.73 China’s per capita cold
chain capacity lags behind the US. In 2017, China’s per capita refrigerated warehouse capacity was less than 30% that of
the US.74
% of agricultural products distributed via cold chain75 Refrigerated warehouse capacity per capita (m3)76
China US, EU, Japan
100%
0.3
75%
0.2
50%
0.1
25%
0%
0.0
Fruits & Meat Aquatic
China Western Europe US
vegetables products
Fresh meat still accounts for the vast majority of retail meat
2016 retail meat sales value by product type77
product sales in China, compared only about 20% in the
US. This reflects a number of factors: traditional
preferences for fresh meat, limited cold chain capacity, and 100%
an underdeveloped meat processing sector.
21%
The large proportion of fresh meat in retail sales limits the
75%
average shelf life of meat products to less than a week and
requires that live hogs, (rather than chilled, frozen or 79%
otherwise processed meat products), must be shipped 50%
from hog producing areas to pork consuming areas. This
exacerbates the biosecurity risks of a pork industry that
lacks vertical integration and is based on small farms and 25%
slaughterhouses. The biosecurity challenges of a
fragmented pork industry structure have been apparent in
the recent measures taken to prevent an African Swine 0%
Fever epidemic. China US
Fresh Cooked meats Cooked meats
(counter) (packaged) (counter)
Chilled raw packaged Chilled raw packaged
(whole cuts) (processed)
Ambient Frozen meat
72 China Cold Chain Logistics Association, China Cold-Chain Logistics Development Report (2016)
73 NDRC, Agricultural Product Cold Chain Development Plan (2010-2015)
74 China Cold Chain Logistics Association, China Cold-Chain Logistics Development Report (2017); USDA, Capacity of Refrigerated Warehouses 2017 Summary
75 China Cold Chain Logistics Association, China Cold-Chain Logistics Development Report (2016); NDRC, Agricultural Product Cold Chain Development Plan (2010-2015)
76 China Cold Chain Logistics Association, China Cold-Chain Logistics Development Report (2017); 2018 GCCA Global Cold Storage Capacity Report; USDA, Capacity of Refrigerated Warehouses 2017
Summary
77 Globaldata, Meat Market in China: Snapshot to 2021; Globaldata, Meat Market in the United States: Snapshot to 2021”
15 | Challenges and Transformation in China’s Food ChainChina’s cold chain logistics industry is highly fragmented. Cold storage market share for the largest cold storage
According to the China Cold Chain Logistics Development companies in China, Western Europe and the US80
Report, China’s top 10 cold storage companies accounted
for only 10.5% of the cold storage market by revenue in
2016.78 In the US, the top four cold storage and logistics 35%
companies account for more than 35% of the market.79
30%
25%
20%
15%
10%
5%
0%
China (top 10) Western Europe US (top 4)
(top 10)
Challenges: Fragmented restaurant and retail sectors
According to the China Cuisine Association, China has are chain restaurants.83 Of China’s total retail restaurant
more than eight million restaurants;81 less than 1% of sales during the first six months of 2018, 77% were
these are chain restaurants.82 In contrast, the US has attributed to enterprises whose annual revenue was less
fewer than 700,000 restaurants of which more than 40% than CNY 2 million.84
Number of restaurants85 Number of chain restaurants86
8
7 250
6
200
thousands
5
millions
4 150
3 100
2
50
1
0 0
China EU-28 US China US
Supervision and enforcement over eight million restaurant management practices, and also a lack of national cold
locations is an incredibly difficult job for the government. chain distribution capabilities for restaurants’ raw materials
The low penetration of chain restaurants implies a low and other supplies.
level of standardisation for food safety and quality
78 China Cold Chain Logistics Association, China Cold-Chain Logistics Development Report (2017)
79 IBIS, Refrigerated Storage in the US, Nov 2017
80 China Cold Chain Logistics Association, China Cold-Chain Logistics Development Report (2017); 2018 GCCA Global Cold Storage Capacity Report; IBIS, “Refrigerated Storage in the US”, November 2017
81 China Cuisine Association, China Catering Industry Development Report (2018)
82 National Bureau of Statistics
83 IFMA 2017/2018 Foodservice Insights Library
84 National Bureau of Statistics, “Total Retail Sales of Consumer Goods in June 2018”, 19 July 2018, http://www.stats.gov.cn/english/PressRelease/201807/t20180719_1610962.html
85 China Cuisine Association, China Catering Industry Development Report (2018); Eurostat; IFMA 2017/2018 Foodservice Insights Library
86 National Bureau of Statistics, 2017 Statistical Yearbook of China Chain Stores and Retail Trade and Catering Services; IFMA 2017/2018 Foodservice Insights Library
16 | Challenges and Transformation in China’s Food ChainNumber of chain supermarket locations87 Number chain supermarket locations in China88
80 45
70 40
60 35
50 30
thousands
thousands
25
40
20
30
15
20 10
10 5
0 0
China US 2007 2008 2009 2010 2011 2012 2013 2014 2015 2016
China has lower penetration of chain supermarkets and
Market share of top 5 grocery store brand
hypermarkets, with just over 40,000 chain supermarkets
owners(including hypermarkets, warehouse
(including hypermarkets, warehouse club stores, discount club stores and discount stores)91
stores) compared to more than 80,000 in the US. This
implies a greater consumer reliance among Chinese
consumers on traditional markets, restaurants and smaller,
independent, retail shops. The number of chain
supermarket stores in China has fallen from its peak in 50%
2012.
40%
China’s supermarket sector (including hypermarkets,
warehouse club stores, and discount stores) is also 30%
fragmented, with the top five brand owners combining for
approximately 10% market share,89 compared to more 20%
than 50% in the US.90
10%
0%
China US
87 National Bureau of Statistics, 2017 Statistical Yearbook of China Chain Stores and Retail Trade and Catering Services; IFMA 2017/2018 Foodservice Insights Library
88 National Bureau of Statistics, 2017 Statistical Yearbook of China Chain Stores and Retail Trade and Catering Services
89 Euromonitor, “EMIS Sector Capsule: Grocery Retailers in China”, Dec 2016
90 IBIS, Warehouse Clubs and Supercenters, Dec 2017; IBIS, Supermarkets and Grocery Stores, Jul 2018
91 Euromonitor, “EMIS Sector Capsule: Grocery Retailers in China”, Dec 2016; IBIS, Warehouse Clubs and Supercenters, Dec 2017; IBIS, Supermarkets and Grocery
Stores, Jul 2018
17 | Challenges and Transformation in China’s Food ChainChallenges: Food safety management and food fraud vulnerability
Preventing harmful contamination, ensuring constant China’s food industry also has considerable food fraud
temperature control and conducting proper food vulnerability. Food safety management is focused on
preparation on a large scale requires effective preventing accidental contamination and temperature
implementation of best practices and technology from farm abuse, but food fraud is intentional adulteration or other
to fork. With the growing scale of China’s farms and food deception that is specifically designed to avoid detection
companies, and the increasing complexity and geographic by consumers and quality assurance teams. China’s
reach of its supply chains, sophisticated food safety and markets are fiercely competitive; producers and traders of
operational management are required. food and agricultural commodities generally operate on
razor thin margins. This pressure creates economic
China’s leading companies and farms have made great
incentive to use cheaper, inferior ingredients as
progress in this area, but many small and medium size
substitutes, or to use illegal additives to enhance attributes
operators still have room for improvement.
that determine pricing.
Seven types of food fraud
Dilution
Mixing a liquid of high value with a liquid of lower value.
Substitution
Replacing an ingredient of high value with an ingredient of lower value.
Concealment
Hiding the low quality of food ingredients or product.
Mislabelling
Placing false claims on packaging for economic gain.
Unapproved enhancements
Adding unknown and undeclared materials to food products to enhance the quality attributes.
Counterfeiting
Copying the brand name, packaging concept, recipe, processing method etc. of food products
for economic gain.
Grey market production/theft/diversion
Sale of stolen or excess unreported product.
Highly fragmented agriculture, logistics, processing, retail to confirm the accuracy of declared ingredients and
and restaurant sectors make it difficult to prevent locations of origin. China’s fragmented agriculture sector
undeclared, substandard or illegal ingredients from making and food industry, as well as the fragmented nature of
their way into the food supply chain. It can be challenging local regulation and enforcement, make this risk difficult to
control.
18 | Challenges and Transformation in China’s Food ChainChallenges: Complex regulatory and enforcement structure
With China’s enormous population, geographic size and The National Food Safety Law of 2015 assigns oversight
diversity, economic complexity, and rapidly changing of food production and trading to the China Food and Drug
economy, it is inevitably challenging to find the optimal Administration, which was folded into the newly formed
division of responsibilities between different departments SAMR in 2018. National food safety standards are
at the central government level, and equally challenging to formulated by the NHC jointly with the SAMR. The NHC,
divide responsibilities between national and local SAMR and MARA are responsible for jointly developing
government bodies. limits, testing methods and procedures for pesticide and
veterinary drug residues in foods. Testing procedures for
At the national level, food safety and quality responsibilities
livestock slaughtering are the responsibility of the MARA
are divided among the State Administration for Market
and the NHC. The SAMR and MARA are responsible for
Regulation (SAMR), the National Health Commission
establishing a coordinated farm-to-table food safety
(NHC) and the Ministry of Agriculture and Rural Affairs
traceability system.
(MARA). The National Food Safety Law covers food
production and trading, while the National Quality and
Safety of Agricultural Products Law covers primary
agricultural products.
1 34
province-level
national
Mainland
administrative
government
regions
China
government
administrative 334
prefecture-level
2,851
county-level
structure92 administrative regions administrative areas
China has 34 provincial-level regions, 334 prefecture-level sharing mechanisms. Local governments determine the
administrative regions, and 2851 county-level responsibilities of their local Food and Drug
administrative regions.93 It is very difficult to ensure Administrations (FDA) and other government departments,
consistency of local measures, regulations and and are responsible for incorporating food safety work in to
enforcement, and it can take time for local implementation local budgets and planning. Local governments are
of policy and guidance from the central government. responsible for implementing accountability systems for
the supervision and administration of food safety.94 The
Local county-level and above governments are responsible
agricultural department of local governments are
for food safety supervision and management in their
responsible for planning, budgeting, leading and
respective jurisdictions, including the establishment of
coordinating agricultural product safety and quality
whole process food safety management and information
supervision and administration work.95
92 Ministry of Civil Affairs,中华人民共和国行政区划简册2018
93 Ministry of Civil Affairs,中华人民共和国行政区划简册2018
94 Food Safety Law of the People’s Republic of China
95 Agricultural Product Quality Safety Law of the People's Republic of China
19 | Challenges and Transformation in China’s Food ChainChallenges: Urbanisation, social media, rising urban income
And rural welfare
China’s urban population has increased from about 580
million in 2006 to more than 790 million in 2016, and
now makes up nearly 60% of the total population.96
Urban consumers require a much more complex supply
80%
chain than rural residents, making it much more difficult 80% of consumers said they
for those consumers to verify the quality, authenticity are not satisfied with food
and source of their foods’ ingredients. At the same time, safety in China
online media has increased public awareness of food
safety and food fraud incidents. According to the China
Daily, 80% of respondents to a 2014 survey “said they
are not satisfied with food safety in China”, while 60%
“said food companies have performed poorly in food
safety.” 97
60% of consumers said food
Urban per capita disposable income has increased from
CNY 6,280 in 2000 to CNY 36,396 in 2017,98 driving 60% companies had performed
poorly in food safety in China
increased demand for quality and variety of food. During
this time, China’s per capita consumption of meat
increased from 38 kg/year to over 50 kg/year, with
mutton and beef growing the fastest.99
Rural per capital income, however, was only CNY Urban and rural disposable income per capita (CNY)101
13,432 in 2017.100
Migration of the working age population to the cities has Rural Urban
30
led to a “hollowing out” of rural communities. The rural
thousands
population has fallen from nearly 810 million in 2000 to 20
about 590 million in 2016.102 Meanwhile, the percentage
of the rural population that is older than 65 is projected 10
to increase from 9% in 2008 to 22% in 2030 compared
to an increase from 7% to 15% in urban areas.103 0
2008 2009 2010 2011 2012 2013 2014 2015 2016 2017
Rural population 1997-2016104 People aged 60 and over as % of total rural and urban
population 105
800
750
20% Rural Urban
700 18%
millions
650 16%
14%
600
12%
550
10%
2000 2005 2010 2016
Because rural land is collectively owned, rural residents assigned farmland fallow, and many grow crops as only a
cannot sell their farmland. They often cannot move secondary occupation. Those who continue farming are
because they would lose their land rights and their social vulnerable to risks such as weather, crop and livestock
benefits. Some rural households leave all or parts of their diseases and volatility in agricultural products markets.
96 National Bureau of Statistics, China Statistical Yearbook 2017
97 China Daily, “Dissatisfaction With Food Safety Pervasive, Survey Finds”, 25 July 2014, http://www.chinadaily.com.cn/china/2014-07/25/content_17920201.htm
98 National Bureau of Statistics, 《中华人民共和国2017年国民经济和社会发展统计公报》, 28 Feb 2018,http://www.stats.gov.cn/tjsj/zxfb/201802/t20180228_1585631.html
99 OECD
100 National Bureau of Statistics, 《中华人民共和国2017年国民经济和社会发展统计公报》, 28 Feb 2018,http://www.stats.gov.cn/tjsj/zxfb/201802/t20180228_1585631.html
101 National Bureau of Statistics
102 National Bureau of Statistics
103 World Bank, Fang Cai, John Giles, Philip O’Keefe, The Elderly and Old Age Support in Rural China, 2012
104 National Bureau of Statistics
105 China Population Statistics Yearbook 2006, China Population & Employment Statistics Yearbook 2017
20 | Challenges and Transformation in China’s Food ChainTransformations 21 | Challenges and Transformation in China’s Food Chain
China’s food sector has some areas that appear to have changed
   little from 20 or 30 years ago, but in other areas China now has the
   world’s most advanced technology and largest facilities. Driven by
   government policy and a wave of investment, the food sector is at
   the midpoint of a comprehensive transformation, the speed and
   magnitude of which is unprecedented.

   The current transformation of China’s food and agriculture sectors
   involves modernisation, industrialisation, standardisation,
   consolidation, vertical integration and information technology. The
   government is promoting large scale companies with national
   brands that are accountable for safety and quality, offer
   differentiated products, and can compete with foreign products.
   The government is promoting growth in the processing stage to
   create more opportunities for economic growth and a greater range
   of consumer products.

   The challenges summarised above are well-known to both
   regulators and industry leaders. While daunting, it is a sign of great
   progress that the focus of government, industry and consumer
   concerns has long moved beyond food security (i.e. ensuring
   sufficient food quantity) to food safety, quality, and sustainability.

22 | Challenges and Transformation in China’s Food Chain
Transformation: Dairy
Dairy has been a primary policy focus, largely due to role it Enabled by the introduction of UHT processing, investment
plays in child nutrition and the importance of food safety in and rising consumer income, China’s raw milk production
food and beverages made for children. In 2006, Prime grew by more than 300% between 2000 and 2008. After
Minister Wen Jiabao said “I have a dream that every the melamine incident of 2008, however, domestic raw milk
Chinese person, especially children, can drink one jin of output growth slowed and the policy focus shifted to quality
milk per day.” (note: one jin = 500 g)106 and safety.
Bovine milk production 1980 – 2017 (tonnes)107
40
millions
35
30
25
20
15
10
5
0
1980
1981
1982
1983
1984
1985
1986
1987
1988
1989
1990
1991
1992
1993
1994
1995
1996
1997
1998
1999
2000
2001
2002
2003
2004
2005
2006
2007
2008
2009
2010
2011
2012
2013
2014
2015
2016
2017
In 2008, China had more than 2.59 million household dairy farms (i.e. farms with more than 100 cows) has increased
farms, of which nearly 2.5 million had fewer than 20 dairy from only 20% in 2008 to 53% in 2016, while the number
cows and nearly 2 million of which had fewer than 5 dairy of professional dairy cooperatives has grown from just over
cows.108 Nearly half of all raw milk was extracted by hand. 2,000 in 2008 to more than 16,000 in 2016.
Since then, the government has taken steps to improve
The National Dairy Industry Development Plan (2016-
quality and safety, including the creation of thousands of
2020) aims for further progress by 2020, with emphasis on
professional dairy farming cooperatives and dairy
modernisation, industrialisation, vertical integration and a
production zones, where household farmers’ dairy cows
more concentrated industry structure.
can be housed together and milked mechanically. The
percentage of China’s dairy cows belonging to scale dairy
Number of professional dairy % of dairy cows on farms with Mechanised milking111
farming cooperatives109 more than 100 dairy cows110
16,037 70% 95% 99%
53%
10,182
51%
2,097
20%
2008 2012 2016 2008 2016 2020 2008 2015 2020
(planned) (planned)
106 China Daily, 25 Feb 2006, 《温家宝:让每个中国人每天都能喝上一斤奶》, http://www.chinadaily.com.cn/hqsy/2006-04/25/content_578567.htm
107 2018 China Dairy Data Report
108 2012 China Dairy Data Report
109 National Dairy Industry Development Plan (2016-2020), Dec 2016; 2017 China Dairy Industry Quality Report
110 National Dairy Industry Development Plan (2016-2020), Dec 2016; 2017 China Dairy Industry Quality Report
111 National Dairy Industry Development Plan (2016-2020), Dec 2016
23 | Challenges and Transformation in China’s Food ChainThe number of small household farms has decreased by province each have 40,000 cows,113 more than any dairy
about 50% since 2008, while the number of farms with farm in the US or Europe; and there are plans to build the
more than 1000 dairy cows has grown from 112 in 2002 to world’s largest dairy farm, with 100,000 cows, in
nearly 1,500 in 2016.112 The Bengbu dairy farm in Anhui Mudanjiang, Heilongjiang province.114
province and the Saibei dairy farm in Hebei.
Dairy farms with fewer than 20 cows115 Dairy farms with more than 1,000 cows116
2.5 million 1,479
1.2 million 706
112
2008 2016 2002 2009 2016
112 China Dairy Data Report 2012 & 2018
113 Modern Dairy Holdings Ltd. 2018 Interim Report
114 China National Radio,《中俄将在黑龙江建全球最大牧场 饲养10万头奶牛》, 15 Jul 2015,http://news.cnr.cn/native/gd/20150715/t20150715_519219613.shtml
115 China Dairy Data Report 2012 & 2018
116 China Dairy Data Report 2012 & 2018
24 | Challenges and Transformation in China’s Food ChainThe modernisation of the dairy industry is also helping to largest dairy farm company has already achieved a yield of
increase the efficiency of China’s dairy production. China’s 9,900 kg/year, and several farms have achieved yields of
average annual dairy cow yield is about 60% that of US more than 12,000 kg/year.118
dairy cows, but there has been consistent progress during
The use of total mixed rations (TMR) is one factor that
the past decade. China’s average yield has increased from
contributes to productivity and efficiency. The share of
3890 kg/year per cow in 2005 to 7000 kg/year in 2017,117
scale dairy farms in China using TMR increased from 30%
and the government plans to achieve average productivity
in 2008 to 80% in 2016.119
of 7500 kg/year by 2020. Yield growth will accelerate as
large modern farms increase their market share; China’s
China’s average dairy cow milk production (kg/year)120 Share of scale dairy farms using TMR technology 121
7,500 80%
6,200
4,760
3,891
30%
2005 2010 2016 2020 (planned) 2008 2016
China’s raw milk production is not only fragmented in consolidated sectors of China’s food industry. The top
terms of the number and size of dairy farms, but also in three processors account for more than 40% market share,
terms of the companies that own dairy farms, with the top compared to only about 15% in the US;122 making this the
three dairy farming companies accounting for less than 7% best stage of the supply chain from which to drive
of China’s raw milk production, compared to about 50% in improvements to quality and safety throughout the supply
the US. Dairy processing, however, is one of the most chain.
Market share of top 3 raw milk producers123 Market share of top 3 dairy processors124
50%
50%
40%
40%
30% 30%
20% 20%
10% 10%
0% 0%
China US China US
117 China Dairy Data Report 2012 & 2018
118 2018 China Dairy Data Report
119 National Dairy Industry Development Plan (2016-2020), Dec 2016
120 China Dairy Data Report 2013 & 2017; National Dairy Industry Development Plan (2016-2020), Dec 2016
121 National Dairy Industry Development Plan (2016-2020), Dec 2016; 2017 China Dairy Industry Quality Report
122 2018 China Dairy Data Report; IBIS
123 2018 China Dairy Data Report; IBIS
124 2018 China Dairy Data Report; IBIS
25 | Challenges and Transformation in China’s Food ChainThe consolidation is in ongoing. While revenues for scale formula milk powder manufacturers fell from 145 to 100,
dairy companies (i.e. companies with annual revenue of largely due to the elimination of companies with poor
CNY 20,000,000 or more) increased from CNY 143 billion production conditions, low safety and quality assurance
in 2008 to 359 billion in 2017, the number of scale dairy capabilities, or obsolete production capacity.125
companies fell from 815 to 611. The number of infant
Number of scale dairy Total revenue of all scale Number of enterprises that
enterprises126 dairy enterprises (CNY billions)127 produce infant milk formula128
815 359 145
611 100
143
2008 2017 2008 2017 2008 2017
In 2015, the first D20 summit was convened in Beijing, quality and innovation. Having a well-known brand
bringing together 20 leading Chinese dairy companies, increases a company’s financial incentives to invest in food
comprised mainly of dairy processors, but also including safety and quality management in order to reduce the risk
leading dairy farming and feed enterprises. Vice Premier of an incident that would destroy brand value.
Wang Yang called on the companies to “make quality the
The emphasis on consolidation and vertical integration will
top priority for manufacturing operations, foster product
improve traceability and accountability for food safety
brands, build company prestige, and aspire to build
management covering the whole supply chain.
consumer trust in domestic dairy products”.129 The
Government policies encourage or require dairy
companies all signed the “Beijing Declaration” which called
processors to build their own raw milk production bases or
for the D20 companies to put quality first, pursue a brand
to take controlling stakes in dairy farming companies. A
strategy to strengthen overall competitiveness, commit to
prime example of the trends towards consolidation and
earnest self-regulation and fulfilment of social
vertical integration, China’s second largest dairy processor
responsibility, and take the path of integrated industry
has spent more than USD 2 billion on acquisitions since
development.130 The D20 Summit is now convened
2014,131 and has built up a 38% stake in the country’s
annually, and encourages the largest Chinese companies
largest dairy farming company in order to better control its
to take control of their supply chains and drive
raw milk supply.132
improvements to quality, safety and competitiveness.
The government’s National Alfalfa Production Development
The government’s emphasis on building national dairy
Plan (2016-2020) plans to double the production of quality
brands aims to overcome a perceived consumer
alfalfa to feed cows on scale dairy farms, drive further
preference for foreign brands; but strong brands can bring
vertical integration and enhance national self-sufficiency.
other benefits as well. With the ability to charge premium
prices, strong brands incentivise differentiation based on
125 Ministry of Agriculture, 从严监管 全面提升乳品质量安全水平——关于《全国奶业发展规划(2016-2020年)》解读, 11 Jan 2017, http://jiuban.moa.gov.cn/zwllm/zwdt/201701/t20170111_5428445.htm; National
Dairy Industry Development Plan (2016-2020), Dec 2016; 2018 China Dairy Industry Quality Report
126 National Dairy Industry Development Plan (2016-2020), Dec 2016; 2018 China Dairy Data Report
127 National Dairy Industry Development Plan (2016-2020), Dec 2016; 2018 China Dairy Data Report
128 National Dairy Industry Development Plan (2016-2020), Dec 2016; 2018 China Dairy Data Report
129 Xinhua, “Chinese Vice Premier Wants Better Dairy Industry”, 18 Aug 2015, http://english.agri.gov.cn/news/dqnf/201508/t20150819_26307.htm; 农民日报,《中国奶业D20峰会在北京召开》, 19 Aug 2015,
http://jiuban.moa.gov.cn/zwllm/zwdt/201508/t20150819_4795588.htm
130 Xinhua, 《中国奶业D20企业联盟 北京宣言》, 18 Aug 2015,
http://www.xinhuanet.com/food/2015-08/18/c_128141825.htm
131 China Daily, “Chinese Dairy Labels Evolve Into Big Brands”, 23 Oct 2017, http://www.chinadaily.com.cn/business/2017-10/23/content_33596728.htm
132 http://www.moderndairyir.com/en/aboutus_milestones.htm
26 | Challenges and Transformation in China’s Food ChainInfant formula milk powder is the most tightly regulated Infant Formula Milk Powder Production Enterprises, issued
dairy product, with the government setting more specific in 2013, stated that infant formula milk powder
goals for consolidation, branding and vertical integration. manufacturers who use fresh milk as a raw material must
By 2020 there will be 3-5 companies earning more than have self-built self-controlled milk production bases and
CNY 5 billion in revenue from infant formula milk powder; make progress towards obtaining all of their raw milk from
and the top 10 domestic brands will account for 80% dairy farms in which they own a controlling share.134
market share.133 The Rules for Control and Oversite of
Infant formula milk powder market share in 2020 (planned)135
All others
Top 10 Chinese brands
20%
80%
In addition to guiding the transformation of the dairy sector, According to the Teng Jiacai, the erstwhile head of the
the government has been conducting extensive safety and CFDA, “The dairy industry is an indicator for modern
quality testing throughout the supply chain. During the work is the breakthrough point and the key to efforts to
years 2009-2016, the Ministry of Agriculture conducted strengthen food quality and safety.”137 In China’s food and
quality and safety tests on more than 170,000 batches of agriculture sectors, the dairy industry is leading the way
raw milk for quality and safety, including more than 26,000 towards consolidation, vertical integration, quality
batches in 2016. In 2016 they also conducted 11,000 improvement and national brands. Other sectors of the
inspections of milking stations and 8,200 inspections of food industry are moving in the same direction.
dairy transport vehicles. The CFDA conducted food safety
tests on 2,532 batches of infant milk formula and 3,318
batches of other dairy products.136
133 National Dairy Industry Development Plan (2016-2020), Dec 2016
134 《婴幼儿配方乳粉生产企业监督检查规定》, 3 Dec 2013, http://www.gov.cn/gzdt/2013-12/03/content_2540737.htm
135 National Dairy Industry Development Plan (2016-2020), Dec 2016
136 2017 China Dairy Industry Quality Report
137 国家食品药品监管总局副局长 滕佳材, 从严监管 全面提升乳品质量安全水平—关于《全国奶业发展规划(2016-2020年)》解读, 11 Jan 2017,
http://www.moa.gov.cn/hdllm/zbft/zgxknnxdqdys/xgxw/201701/t20170111_5428445.htm
27 | Challenges and Transformation in China’s Food ChainYou can also read