CEPA Working Paper No. 21-03
←
→
Page content transcription
If your browser does not render page correctly, please read the page content below

CEPA Working Paper No. 21-03

Essay Content is Strongly Related to Household
Income and SAT Scores: Evidence from 60,000
Undergraduate Applications

AUTHORS                   ABSTRACT

AJ Alvero                 There is substantial evidence of the potential for class bias in the use of standardized tests to
Stanford University       evaluate college applicants, yet little comparable inquiry considers the written essays
                          typically required of applicants to selective US colleges and universities. We utilize a corpus
Sonia Giebel              of 240,000 admissions essays submitted by 60,000 applicants to the University of California
Stanford University
                          in November 2016 to measure the relationship between the content of application essays,
                          reported household income, and standardized test scores (SAT) at scale. We quantify essay
                          content using correlated topic modeling (CTM) and the Linguistic Inquiry and Word Count
Ben Gebre-Medhin
                          (LIWC) software package. Results show that essays have a stronger correlation to reported
Mount Holyoke College
                          household income than SAT scores. Essay content also explains much of the variance in SAT
                          scores, suggesting that essays encode some of the same information as the SAT, though
anthony lising antonio    this relationship attenuates as household income increases. Efforts to realize more equitable
Stanford University       college admissions protocols can be informed by attending to how social class is encoded
                          in non-numerical components of applications.
Mitchell L. Stevens
Stanford University

Benjamin W. Domingue
Stanford University

                         VERSION

                         April 2021

                         Suggested citation: Alvero, AJ., Giebel, S., Gebre-Medhin, B., Antonio, A.L., Stevens, M.L., & Domingue,
                         B.W. (2021). Essay Content is Strongly Related to Household Income and SAT Scores: Evidence from
                         60,000 Undergraduate Applications. (CEPA Working Paper No.21-03). Retrieved from Stanford Center for
                         Education Policy Analysis: http://cepa.stanford.edu/wp21-03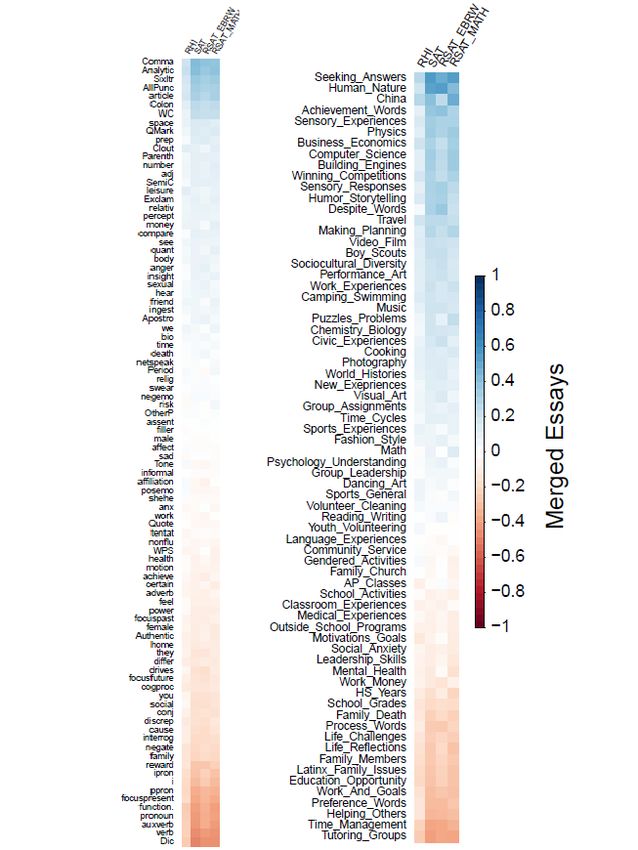
Essay Content is Strongly Related to Household Income and SAT
    Scores: Evidence from 60,000 Undergraduate Applications
    AJ Alveroa,: , Sonia Giebela , Ben Gebre-Medhinb , anthony lising antonioa , Mitchell L.
                           Stevensa , and Benjamin W. Dominguea,:
                                               a
                                   Stanford University
                                           b
                                  Mount Holyoke College
     :
       Correspondence about the paper should be sent to ajalvero@stanford.edu and/or
                                ben.domingue@gmail.com.

                                                      Abstract

          There is substantial evidence of the potential for class bias in the use of standardized tests to eval-
      uate college applicants, yet little comparable inquiry considers the written essays typically required of
      applicants to selective US colleges and universities. We utilize a corpus of 240,000 admissions essays
      submitted by 60,000 applicants to the University of California in November 2016 to measure the rela-
      tionship between the content of application essays, reported household income, and standardized test
      scores (SAT) at scale. We quantify essay content using correlated topic modeling (CTM) and the Lin-
      guistic Inquiry and Word Count (LIWC) software package. Results show that essays have a stronger
      correlation to reported household income than SAT scores. Essay content also explains much of the vari-
      ance in SAT scores, suggesting that essays encode some of the same information as the SAT, though this
      relationship attenuates as household income increases. Efforts to realize more equitable college admis-
      sions protocols can be informed by attending to how social class is encoded in non-numerical components
      of applications.

1    Introduction
The information selective colleges and universities use when evaluating applicants has been a perennial ethical
and policy concern in the United States. For nearly a century, admissions officers have made use of scores on
standardized tests to assess and compare applicants. Proponents of tests argue that they enable universal
and unbiased measures of academic aptitude and may have salutary effects on fairness in evaluation when
used as universal screens [1, 2, 3, 4]; critics note the large body of evidence indicating a strong correlation
between SAT scores and socioeconomic background, with some having dubbed the SAT a “wealth test”
[5, 6].
    There are many other components of admissions files, however, including the candidates’ primary op-
portunity to make their case in their own words: application essays. Yet there is virtually no comparative
literature on the extent to which these materials may or may not covary with other applicant characteristics.
How, if at all, do application essays correlate with household income and standardized test scores?
    The movement for test-optional evaluation protocols [7, 8] has gained more momentum in light of the
public-health risks associated with in-person administration of standardized tests during the Covid-19 pan-
demic. To the extent that the elimination of standardized tests recalibrates the relative weight of other
components of applications, the basic terms of holistic review, the current standard of best practice for
jointly considering standardized tests alongside qualitative components of applications [9, 10, 11], are up for
fresh scrutiny.
    To inform this national conversation, we analyze a dataset comprising information from 60,000 appli-
cations submitted to the nine-campus University of California system in the 2016–2017 academic year to

                                                          1
Essay SAT
Content Score
Family
Income
Figure 1: Conceptual model
observe the relationship between essay content, reported household income (RHI) and SAT score. The basic
conceptual model we test is shown in Figure 1. The well-known fact that SAT scores show associations with
household income is captured in the blue line. We observe such an association in our dataset as well. Here
our primary aim is to test relationships along the red lines. We juxtapose results from an unsupervised,
probabilistic approach using correlated topic modeling (CTM; [12, 13]), and a pre-determined, dictionary
driven analysis using proprietary software, Linguistic Inquiry and Word Count (LIWC; [14]). We chose
these two techniques because they are commonly used for analysis of textual data in other evaluative con-
texts [15, 16, 17]. While prior research using computational readings has considered the relationship between
essay vocabularies and grammar with the gender, RHI, or subsequent grades of authors [18, 19, 20, 21], we
extend this emerging literature by comparing the content of undergraduate application essays, household
income, and standardized test scores at scale.
First, we identify the dictionary-based patterns and the topics that emerge through computational read-
ings of the essay corpus (we refer to the CTM- and LIWC-derived outputs collectively as “essay content”).
We find that easily countable features of essays, like the number of commas they contain, as well as certain
topics, have strong correlations with RHI and SAT. Second, we use these features to examine patterning
of essay content across reported household incomes. We find that essay content has a stronger relationship
with RHI than that observed between SAT score and RHI. Third, observed associations between SAT scores
and essay content persist even when we stratify analyses by RHI; the association is not driven entirely by
the stratification of SAT scores across RHI. Taken together, our findings suggest that many of the associa-
tions with social class deemed concerning when they pertain to the SAT also pertain to application essays
when essay content is measured (or “read”) computationally. These findings should be of immediate policy
relevance given the changes in evaluation protocols that would come if standardized test scores were to be
eliminated from college applications, an already growing trend.
Results
Describing essay content via externally-linked features and data-driven topics
In the 2016-2017 academic year, applicants to the University of California were given eight essay prompts
and were required to write responses to any four prompts. We focus our analysis on a random sample of
n “ 59, 723 applicants for first year admission. Additional information about the sample can be found in
the Methods section. As each applicant wrote four essays, we have a corpus of 238,892 essays. Each essay
was limited to 350 words and average essay length was near 348 words; applicants submitted 1,395 words on
average across the four essays. We describe results based on analysis of what we call the “merged” essay:
a concatenation of the four essays into one document. In the SI, we discuss analysis of essays written to
2specific prompts; results are similar and can be seen in Tables S3 and S4.
We capture essay content via topic modeling and a dictionary-based technique. These approaches are
distinctive in their foci: what applicants write about in essays versus how they are written.
Topic Modeling
Our first approach, correlated topic modeling (CTM; [12]), is a data-driven strategy that relies only upon
the words in the essays (i.e., no external data is used). Topic modeling identifies semantic content via a
generative, probabilistic model of word co-occurrences. Words that frequently co-occur are grouped together
into “topics” and usually show semantic cohesion (e.g., a topic may include terms like “baseball”, “bat”,
“glove” since such words tend to co-occur in a document). A given document is assumed to consist of a
mixture of topics; estimation involves first specifying the number of topics and then estimating those mixture
proportions. CTM has been used to measure changes in research publication topics and themes over time in
academic fields such as statistics and education [17, 22, 23], and has also been used for more applied studies
such as measuring the relationship between seller descriptions and sales in an online marketplace [24]. For
a comprehensive overview of CTM and topic modeling more generally see [25].
x x
4
4
RHI RHI
SAT SAT
3
3
Density
Density
2
2
1
1
0
0
−0.4 0.0 0.4 −0.4 0.0 0.4
r(x,Topic) r(x,LIWC)
Figure 2: Density of correlations between either RHI or total SAT score and either 70 topics (left) or 89
LIWC features (right).
Using CTM, we generated 70 topics across the full corpus that we use as independent variables for analysis.
Details regarding topic construction can be found in the Methods section. The topics for the merged essays
included a wide variety of themes (e.g., winning competitions, social anxiety, medical experiences, language
experiences; see Table S1 in SI) but also included topics related to specific majors (e.g. physics, computer
science, economics). We observed a range of associations between topical themes and either SAT scores or
RHI, see Figure 2. For example, essays with more content on “human nature” and “seeking answers” tended
to be written by applicants with higher SAT scores (r “ 0.53 and r “ 0.57 respectively); in contrast, essays
with more content about “time management” and family relationships tended to be written by students with
lower SAT scores (r “ ´0.4 and r “ ´0.26 respectively).
LIWC
Our second approach, LIWC [26], relies upon an external “dictionary” that identifies linguistic, affective,
perceptual, and other quantifiable components of essay content. LIWC generates 90 such features (described
by LIWC developers as “categories” [27]) based on word or character matches in a given document and
the external dictionary. These include simple word and punctuation counts, grammatical categories such as
pronouns and verbs, sentiment analysis, specific vocabularies such as family or health words, and stylistic
3measures such as narrative writing. LIWC also generates composite variables from groups of categories,
such as “analytical writing” based on frequency of function words such as articles and prepositions. For
example, sentences using more personal pronouns like I, you, and she score lower in the analytic category
than sentences using more articles like a, an, and the. Our models used 89 of the LIWC categories (see the
Methods section for additional details) as independent variables.
As with the topics generated from CTM, we observed a range of associations between LIWC features
and either SAT scores or RHI. Counts of total punctuation (r “ 0.343), comma use (r “ 0.434), and longer
words (r “ 0.375) were positively associated with SAT, for example, while function words (e.g. prepositions
and articles; r “ ´0.419) and verbs (r “ ´0.471) were negatively associated with SAT; correlations for RHI
followed a similar pattern. These findings parallel prior work focusing on a smaller sample of admission
essays submitted to a single institution [20]. The strong correlations of individual features from CTM and
LIWC help explain the strong associations from the regression models in later sections.
Both methods for quantifying essay content produce features that show varying levels of association with
RHI and SAT scores. Although the approaches have important conceptual and methodological differences,
they are complementary in that they suggest that multiple techniques may yield similar patterns. The
relatively weak correlation between topics and LIWC categories (average correlation for topics and LIWC
categories: r “ ´0.001; median correlation: r “ ´0.011) further suggests that the methods are complemen-
tary rather than redundant. In the following analyses, we probe the relative magnitudes of the associations
in Figure 1. While the fact that many specific correlations are relatively large (see Figures 2 and S3 of
the SI) is suggestive, we can simplify analysis by summarizing the predictive content of essays. To do so,
we focus on the overall out-of-sample predictive accuracy obtained when we use all of the quantified essay
content generated by either CTM or LIWC to predict either SAT scores or RHI. As a comparison, we also
use RHI to predict SAT scores.
Essay content is more strongly associated with RHI than SAT scores
Having developed quantitative representations of essay content, we now estimate the strength of the rela-
tionships between essay content, RHI, and SAT. We compared adjusted R2 from three out-of-sample linear
regression models, with RHI as the dependent variable: Model A uses SAT scores as a predictor (SAT
EBRW1 and SAT Math were tested separately) while Models B and C use topics and LIWC features, re-
spectively, as predictors (i.e., Model A represents the blue line in Figure 1 while Models B and C represent
the red arrow between RHI and the essays). Applicants who reported RHI below $10,000 (n “ 1, 911) were
excluded because we suspected that many of them may have misreported parental income [18] (remaining
n “ 57, 812). Note that Models B and C use essay content as predictors rather than as dependent variables;
compressing the essays into a single outcome variable would result in substantial information loss.
Between 8–12% of variation in RHI is explained by SAT scores; see Table 1. These estimates are compara-
ble to those from previous work: using data from seven University of California campuses collected between
1996–1999, estimated associations between logged household income and the SAT total were R2 « 0.11
(Table 1 in [28]). Somewhat more variation is explained by Math scores than by EBRW scores and the
total SAT score is roughly as predictive as the Math score alone. Turning to Models B and C, essay content
is generally more predictive of RHI than SAT scores. Topics (R2 “ 16%) are marginally better predictors
of RHI than is LIWC (R2 “ 13%). Note that the topics show higher predictive performance despite the
LIWC-based model using 19 more predictors and external data.
Table 1 reports results on the merged essays. Results for individual essays, shown in the SI (Tables S3
and S4), are somewhat weaker, suggesting that some degree of respondent selection and or prompt-specific
language could be playing a role in the main associations on which we focus here. It is also possible that
the difference in performance is simply due to the merged essays providing more data (in terms of word
count and sample size) than the individual essays. We also considered readability metrics [29, 30, 31, 32, 33]
commonly used in education research in place of our primary metrics of essay content (CTM topics & LIWC
features); we find much weaker associations between readability and SAT scores (R2 ă 0.1; see Table S5 in
SI).
Collectively, these results suggest that essay content has a stronger association with RHI than do SAT
scores. Given longstanding concern about the strength of the relationship between SAT scores and socioe-
1 Evidence-Based Reading and Writing
4Essay R2 95% Conf. Interval
A. SAT predicting RHI
SAT Composite 0.119 [0.115, 0.124]
SAT EBRW 0.083 [0.079, 0.087]
SAT Math 0.120 [0.115, 0.124]
B. Topics predicting RHI
Topics 0.161 [0.157, 0.167]
C. LIWC predicting RHI
LIWC 0.129 [0.127, 0.136]
Table 1: Out-of-sample prediction error for prediction of RHI by topics and SAT scores using 10-fold CV.
conomic background, it is noteworthy to find a similar pattern across essay topics and dictionary features.
Next we focus on the interplay between SAT scores and essay content. Specifically, we assess whether essay
features can explain variation in applicant SAT scores.
SAT scores are strongly predicted by essay content
Table 2 summarizes the observed relationship between essay features and SAT scores. Topical and dictionary-
derived predictors of SAT scores are relatively robust: roughly 43-49% of the total SAT score is explained
by essay content, with some variation around these values for the SAT EBRW and SAT Math. The strength
of the prediction is surprising. Essay content is far more predictive of SAT scores than is, for example, high
school GPA (R2 “ 0.04 between high school GPA and the total SAT score [28].2 ) Findings are especially
noteworthy with respect to the topics given that they are generated in an atheoretical manner that was blind
to information about applicants’ family background or academic performance.
Essay R2 95% Conf. Interval RMSE
Topics
SAT Composite 0.486 [0.478, 0.489] 124.87
SAT EBRW 0.428 [0.419, 0.431] 64.83
SAT Math 0.473 [0.466, 0.477] 74.34
LIWC
SAT Composite 0.436 [0.428, 0.440] 130.85
SAT EBRW 0.369 [0.362, 0.374] 68.05
SAT Math 0.405 [0.399, 0.410] 78.96
Table 2: Out-of-sample prediction error for prediction of SAT scores by topics using 10-fold CV.
Collectively, findings from Tables 1–2 suggest that the content of essays—their themes, diction, gram-
mar, and punctuation—encodes substantial information about family background (as captured by RHI) and
academic performance (as captured by the SAT). Designers of application protocols that include essays as a
component will need to consider the strength of the relationship between essay content, family background,
and academic performance, a topic we return to in the Discussion. In the next section we examine patterning
by RHI in the association between essay content and SAT score.
Associations between essay content and SAT score persist within RHI decile
While we have shown in separate analyses that essay content is associated with SAT scores and with reported
household income, it is possible that the strength of the relationship with essay content and SAT varies with
2 These results are based on an older version of the SAT (note that they refer to the SAT Verbal section as opposed to the
EBRW) so may not be fully comparable with the results reported here.
5income. To study socioeconomic variation in the relationship between essays and SAT, we split the data by
RHI decile. We then repeated our test from Table 2 of the associations between essay content and SAT score
within each income decile. This approach—modeled after a similar approach that trained word vectors for
each RHI quartile [19]—will determine whether the observed patterns in Table 2 are due to a root cause—
social class, see Figure 1—or whether there are distinctive features of essay content even within social class
that predict SAT score.
After stratifying by RHI decile, essay content is still quite predictive of SAT score (see Figure 3). Essays
written by applicants in the highest RHI deciles have the weakest relationship with their SAT scores. This
is true for both LIWC features and topics: associations are between R2 “ 0.25 and R2 “ 0.3 for the highest
income students. We observed the strongest associations, R2 « 0.4, between essay content and SAT scores for
middle-income students. Given the consistency of these relationships across both the topical and dictionary
predictor models, a likely reason for this pattern is that variation in SAT scores is smallest in the highest
deciles of RHI (see Table S2). However, our models continue to explain a substantial amount of variation in
these stratified analyses, suggesting that the variation in essay content illustrated in Table 2 is not purely a
signature of RHI.
Topics LIWC
0.4
0.4
0.3
0.3
R2
R2
0.2
0.2
0.1
0.1
0.0
0.0
1 2 3 4 5 6 7 8 9 10 1 2 3 4 5 6 7 8 9 10
RHI Decile RHI Decile
Figure 3: R2 of total SAT predicted by Topics or LIWC categories when stratified by RHI decile.
Discussion
We analyzed the relationships between applicants’ reported household income, SAT scores, and the content of
application essays from a random sample of 240,000 essays submitted by 60,000 applicants to the University
of California in 2016. We find that essay content is more strongly associated with household income than
is SAT score. We also find that the content of essays is a strong predictor of applicant SAT, with reported
R2 of nearly 50% in some models. The relationship between essay content and SAT score is strongest for
middle-income students and weakest for high-income students. Given the controversy surrounding the use of
standardized test scores in selective college admissions, the associations reported here should inform ongoing
discussion about fairness and bias in holistic review.
Our results not only confirm previous research illustrating how social class manifests in standardized
tests such as the SAT, but show further that class is present in aspects of the file that are often perceived as
qualitative counterweights to standardized assessments. Standardized tests are designed to produce a concise
ranking among applicants; by contrast, essays have no inherent hierarchical relation with each other and
instead provide readers with contextual and non-cognitive information for evaluating applicants [34]. Essays
are intended to provide information about an applicant’s resources, conditions for learning, and personal
characteristics such as motivation, resilience, leadership, and self-confidence. Indeed the expressed purpose
6of application essays, and of holistic review more generally, is to enable consideration of applicant attributes
beyond what is captured in a few easily comparable numbers [35, 36, 37, 11].
Yet however its constituent parts are conceptualized, the entire evaluation process is ultimately an effort
to sort applicants along a single dimension: accept or reject. While it may not be anyone’s intention to
strictly rank application essays, they ultimately are one component of a process that is inherently simplifying
applicant fitness through a binary evaluation. Idealistically, the essays allow applicants to present their case
for admission through idiosyncratic narratives. These narratives then help admissions officers consider the
entire profile of the applicant as they make admission decisions and try to construct a class filled with diverse
backgrounds and perspectives. But our findings suggest that such holistic review may be redundant in an
unanticipated way: Household income, test scores, and essay content are highly interrelated. Future studies
might investigate if and how this relationship is detected or understood by the admissions professionals who
read and evaluate application essays.
Meanwhile, inherited concern about associations between socioeconomic status and SAT scores should
probably be expanded to include what were long understood as “qualitative” components of applications
that are now easily amenable to computational “reading” at scale. If computational readings consistently
find that essay content is largely a reflection of socioeconomic resources, then essay requirements may be
worthy of the same level of critical scrutiny that standardized testing has heretofore received. Removing
the SAT would likely remove practical barriers to selective colleges for at least some students [38],3 but if
the essays encode much of the information as SAT scores and have a stronger relationship with household
income, then the use of essays in admissions decisions warrants careful consideration. While there is evidence
supporting a relationship between non-cognitive attributes and educational outcomes in college [39], there is
at present only minimal research on the evaluative content of application essays. These texts may prove to
be a complex mosaic of socioeconomic status, academic ability, educational performance, social context, and
individual-level characteristics. Researchers might more closely examine the metrical features of application
essays, and extend similar lines of inquiry to other qualitative application components, such as letters of
recommendation and interview write-ups. Further, allowing machines to “read” essays either alongside or
in place of human reviewers may seem far-fetched to some, but it is standard practice in other settings in
education [40] and the development of automated protocols for evaluation of candidates in related spaces is
no longer hypothetical [41].
Ever more fierce competition for limited seats at prestigious schools will require constant attention to
ensure any degree of fairness in evaluation protocols. “Campbell’s Law”—“The more any quantitative social
indicator is used for social decision-making, the more subject it will be to corruption pressures and the more
apt it will be to distort and corrupt the social processes it is intended to monitor” [42, p.85]—suggests that
there are no simple means of ensuring fairness. Elimination of standardized tests will not increase the number
of seats at elite schools, but it may increase the number of applications those schools receive. We suspect
it will be increasingly tempting for admissions offices to pursue automated means of reviewing application
portfolios; doing so would almost inevitably incite college hopefuls to devise new ways of gaming the system.
Whatever the future of holistic review, our results strongly suggest that the imprint of social class will be
found in even the fuzziest of application materials.
Materials and Methods
Data
Our data, provided by University of California, was a random sample of 60,000 applications drawn from an
application pool of more than 165,000 individuals who submitted application materials in November 2016
for matriculation in Fall 2017. The shared data included applicant essays, raw RHI, SAT scores, and various
personal characteristics about each applicant. The essays were required components of applications. Each
applicant was expected to write to four essay prompts from eight choices, yielding a dataset of 240,000 essays.
Prior to any analysis, we removed all applicants who wrote essays for the transfer admissions prompt and
applicants with merged essays shorter than 50 characters (n “ 59, 723). The prompts are listed in the SI
and described in more detail in related work [43].
3 Their removal may also limit applicants’ ability to know how they might fare in college, a crucial signal [2].
7Minimize (Merged Essay)
1.00
0.75
Scaled Values
Method
0.50
Cao et al., 2009
Arun et al., 2010
0.25
0.00
10 20 30 40 50 60 70 80 90 100 110 120 130 140 150
Topics
Maximize (Merged Essay)
1.00
0.75
Scaled Values
Method
0.50
Griffiths & Steyvers, 2004
Deveaud et al., 2014
0.25
0.00
10 20 30 40 50 60 70 80 90 100 110 120 130 140 150
Topics
Figure 4: Results from ldatuning suggesting 70 topics. Models were tested for 10 topics to 150 topics,
increasing by ten for each test.
Text Pre-Processing
We largely focused on the merged text resulting from collapsing all four admissions essays into a single
document. We pre-processed these documents prior to analysis using the quanteda package in R [44]. We
removed English stopwords, stemmed the words (Porter Snowball stemmer [45]), lower-cased all characters,
and removed all punctuation and numbers. We also ensured that there was a whitespace character after all
periods and commas (we found that many students did not add expected spaces after periods and commas).
For example, some applicants might have written “This is a sentence.This is a different sentence.” rather
than “This is a sentence. This is a different sentence.”.
Topics: Hyperparameter Tuning
Hyperparameter tuning for topic modeling is a well-known methodological challenge. Since we use the topics
as predictors and are less concerned with their semantic coherence and the clarity of resulting topics, we relied
on quantitative measures of topic quality using the ldatuning package in R [46]. This package uses four
metrics [47, 48, 49, 50] to estimate a reasonable number of topics (details shown in SI). After standardizing
the results for the four equations, we selected the number of topics which had the best average performance
across the four metrics (70 topics for the merged essays, 50 topics for the single essays). See Figure 4 for a
visual representation of this approach.
We then used the stm (structural topic modeling; [13]) package in R to generate the number of topics
suggested by our ldatuning approach. The stm function in the package defaults to CTM when covariates
are omitted.
Dictionary Features
We used all of the features available except for “Dash” because of incompatible formatting between the
essays and dashes detected by LIWC, therefore generating 89 of 90 possible categories for each essay.
8Linear Model Details
R2 estimates for out-of-sample predictions are based on 10-fold cross-validation with a train/test split of
90%/10% to prevent overfitting [51]. We report the average R2 across all folds. The 95% confidence intervals
were constructed via 10,000 bootstrap replications. RMSE is root mean squared error, the standard deviation
of the prediction errors in a model. Given that a single document is approximated as a mixture of topics,
the topic scores always sum to unity within an essay. To address collinearity, we removed one topic from
model B.
To calibrate our approach, we applied our analytic pipeline to data from a previous study of application
essays [20]. That previous study uses the LIWC variables from the 2007 version of the software for each
applicant’s essay and their SAT equivalent score (many applicants took the ACT). When we use that study’s
data in our analytic pipeline, we explain less variation in SAT scores via LIWC variables (R2 “ 0.21) than in
our data. This is presumably due to two sampling factors that narrowed the range of content in those essays:
the prior study’s data came from students who were admitted to, and eventually enrolled at, a single-campus
flagship state institution (University of Texas at Austin) while ours include essays from all applicants to the
multi-campus University of California. Their study also used a different, older version of LIWC.
References
[1] Joshua Hyman. Act for all: The effect of mandatory college entrance exams on postsecondary attainment
and choice. Education Finance and Policy, 12(3):281–311, 2017.
[2] Sarena Goodman. Learning from the test: Raising selective college enrollment by providing information.
Review of Economics and Statistics, 98(4):671–684, 2016.
[3] Daniel Klasik. The act of enrollment: The college enrollment effects of state-required college entrance
exam testing. Educational researcher, 42(3):151–160, 2013.
[4] Michael Hurwitz, Jonathan Smith, Sunny Niu, and Jessica Howell. The maine question: How is 4-year
college enrollment affected by mandatory college entrance exams? Educational Evaluation and Policy
Analysis, 37(1):138–159, 2015.
[5] Ezekiel J Dixon-Román, Howard T Everson, and John J McArdle. Race, poverty and sat scores:
Modeling the influences of family income on black and white high school students’ sat performance.
Teachers College Record, 115(4):1–33, 2013.
[6] Roy Freedle. Correcting the sat’s ethnic and social-class bias: A method for reestimating sat scores.
Harvard Educational Review, 73(1):1–43, 2003.
[7] Cecilia Capuzzi Simon. The test-optional surge. The New York Times, 12, 2015.
[8] Jared Furuta. Rationalization and student/school personhood in us college admissions: The rise of
test-optional policies, 1987 to 2015. Sociology of Education, 90(3):236–254, 2017.
[9] Michael N Bastedo, Kristen M Glasener, KC Deane, and Nicholas A Bowman. Contextualizing the
sat: Experimental evidence on college admission recommendations for low-ses applicants. Educational
Policy, page 0895904819874752, 2019.
[10] Michael N Bastedo, Nicholas A Bowman, Kristen M Glasener, and Jandi L Kelly. What are we talking
about when we talk about holistic review? selective college admissions and its effects on low-ses students.
The Journal of Higher Education, 89(5):782–805, 2018.
[11] Mitchell L Stevens. Creating a class. Harvard University Press, 2009.
[12] David Blei and John Lafferty. Correlated topic models. Advances in neural information processing
systems, 18:147, 2006.
[13] Margaret E Roberts, Brandon M Stewart, and Dustin Tingley. Stm: An r package for structural topic
models. Journal of Statistical Software, 91(2), 2019.
9[14] James W Pennebaker, Ryan L Boyd, Kayla Jordan, and Kate Blackburn. The development and psy-
chometric properties of liwc2015. Technical report, 2015.
[15] Sarah Seraj, Kate G Blackburn, and James W Pennebaker. Language left behind on social media
exposes the emotional and cognitive costs of a romantic breakup. Proceedings of the National Academy
of Sciences, 118(7), 2021.
[16] Li Lucy, Dorottya Demszky, Patricia Bromley, and Dan Jurafsky. Content analysis of textbooks via
natural language processing: Findings on gender, race, and ethnicity in texas us history textbooks.
AERA Open, 6(3):2332858420940312, 2020.
[17] Sebastian Munoz-Najar Galvez, Raphael Heiberger, and Daniel McFarland. Paradigm wars revisited: A
cartography of graduate research in the field of education (1980–2010). American Educational Research
Journal, 57(2):612–652, 2020.
[18] AJ Alvero, Noah Arthurs, Anthony Lising Antonio, Benjamin W Domingue, Ben Gebre-Medhin, Sonia
Giebel, and Mitchell L Stevens. Ai and holistic review: Informing human reading in college admissions.
In Proceedings of the AAAI/ACM Conference on AI, Ethics, and Society, pages 200–206, 2020.
[19] Noah Arthurs and AJ Alvero. Whose truth is the “ground truth”? college admissions essays and bias
in word vector evaluation methods.
[20] James W Pennebaker, Cindy K Chung, Joey Frazee, Gary M Lavergne, and David I Beaver. When
small words foretell academic success: The case of college admissions essays. PloS one, 9(12):e115844,
2014.
[21] Steven Jones. “ensure that you stand out from the crowd”: A corpus-based analysis of personal state-
ments according to applicants’ school type. Comparative Education Review, 57(3):397–423, 2013.
[22] Stijn Daenekindt and Jeroen Huisman. Mapping the scattered field of research on higher education. a
correlated topic model of 17,000 articles, 1991–2018. Higher Education, pages 1–17, 2020.
[23] Francesca De Battisti, Alfio Ferrara, and Silvia Salini. A decade of research in statistics: A topic model
approach. Scientometrics, 103(2):413–433, 2015.
[24] Donato Cutolo, Simone Ferriani, and Gino Cattani. Tell me your story and i will tell your sales: A
topic model analysis of narrative style and firm performance on etsy. In Aesthetics and Style in Strategy.
Emerald Publishing Limited, 2020.
[25] John W Mohr and Petko Bogdanov. Introduction—topic models: What they are and why they matter,
2013.
[26] Yla R Tausczik and James W Pennebaker. The psychological meaning of words: Liwc and computerized
text analysis methods. Journal of language and social psychology, 29(1):24–54, 2010.
[27] James W Pennebaker, Martha E Francis, and Roger J Booth. Linguistic inquiry and word count: Liwc
2001. Mahway: Lawrence Erlbaum Associates, 71(2001):2001, 2001.
[28] Rebecca Zwick and Jennifer Greif Green. New perspectives on the correlation of sat scores, high school
grades, and socioeconomic factors. Journal of Educational Measurement, 44(1):23–45, 2007.
[29] Rudolph Flesch. A new readability yardstick. Journal of applied psychology, 32(3):221, 1948.
[30] Edgar Dale and Jeanne S Chall. A formula for predicting readability: Instructions. Educational research
bulletin, pages 37–54, 1948.
[31] G Harry Mc Laughlin. Smog grading-a new readability formula. Journal of reading, 12(8):639–646,
1969.
10[32] J Peter Kincaid, Robert P Fishburne Jr, Richard L Rogers, and Brad S Chissom. Derivation of new
readability formulas (automated readability index, fog count and flesch reading ease formula) for navy
enlisted personnel. Technical report, Naval Technical Training Command Millington TN Research
Branch, 1975.
[33] Robert Gunning et al. Technique of clear writing. 1952.
[34] Don Hossler, Emily Chung, Jihye Kwon, Jerry Lucido, Nicholas Bowman, and Michael Bastedo. A
study of the use of nonacademic factors in holistic undergraduate admissions reviews. The Journal of
Higher Education, 90(6):833–859, 2019.
[35] Kelly Ochs Rosinger, Karly Sarita Ford, and Junghee Choi. The role of selective college admissions
criteria in interrupting or reproducing racial and economic inequities. The Journal of Higher Education,
pages 1–25, 2020.
[36] Jerome Karabel. The chosen: The hidden history of admission and exclusion at Harvard, Yale, and
Princeton. Houghton Mifflin Harcourt, 2006.
[37] Nicholas Lemann. The big test: The secret history of the American meritocracy. Macmillan, 2000.
[38] Nikhil Garg, Hannah Li, and Faidra Monachou. Standardized tests and affirmative action: The role of
bias and variance. arXiv preprint arXiv:2010.04396, 2020.
[39] Neal Schmitt, Jessica Keeney, Frederick L Oswald, Timothy J Pleskac, Abigail Q Billington, Ruchi
Sinha, and Mark Zorzie. Prediction of 4-year college student performance using cognitive and noncog-
nitive predictors and the impact on demographic status of admitted students. Journal of Applied
Psychology, 94(6):1479, 2009.
[40] Yigal Attali and Jill Burstein. Automated essay scoring with e-rater® v. 2. The Journal of Technology,
Learning and Assessment, 4(3), 2006.
[41] Frida Polli and Julie Yoo. Systems and methods for data-driven identification of talent, January 24
2019. US Patent App. 16/013,784.
[42] Donald T Campbell. Assessing the impact of planned social change. Evaluation and program planning,
2(1):67–90, 1979.
[43] Ben Gebre-Medhin, Sonia Giebel, AJ Alvero, Ben Domingue, Mitchell L Stevens, et al. Application
essays and the performance of merit in us selective admissions. 2020.
[44] Kenneth Benoit, Kohei Watanabe, Haiyan Wang, Paul Nulty, Adam Obeng, Stefan Müller, and Akitaka
Matsuo. quanteda: An r package for the quantitative analysis of textual data. Journal of Open Source
Software, 3(30):774, 2018.
[45] Martin F Porter. Snowball: A language for stemming algorithms, 2001.
[46] Murzintcev Nikita. Select number of topics for lda model. Available on: https://cran. rproject.
org/web/packages/ldatuning/vignettes/topics. html.[March 3rd, 2019], 2016.
[47] Thomas L Griffiths and Mark Steyvers. Finding scientific topics. Proceedings of the National academy
of Sciences, 101(suppl 1):5228–5235, 2004.
[48] Rajkumar Arun, Venkatasubramaniyan Suresh, CE Veni Madhavan, and MN Narasimha Murthy. On
finding the natural number of topics with latent dirichlet allocation: Some observations. In Pacific-Asia
conference on knowledge discovery and data mining, pages 391–402. Springer, 2010.
[49] Romain Deveaud, Eric SanJuan, and Patrice Bellot. Accurate and effective latent concept modeling for
ad hoc information retrieval. Document numérique, 17(1):61–84, 2014.
[50] Juan Cao, Tian Xia, Jintao Li, Yongdong Zhang, and Sheng Tang. A density-based method for adaptive
lda model selection. Neurocomputing, 72(7-9):1775–1781, 2009.
11[51] Trevor Hastie, Robert Tibshirani, and Jerome Friedman. The elements of statistical learning: data
mining, inference, and prediction. Springer Science & Business Media, 2009.
12Essay Content is Strongly Related to Household
Income and SAT Scores: Evidence from 60,000
Undergraduate Applications
Supplemental Information (SI)
Contents
1 Additional Methods 2
1.1 Choosing k topics . . . . . . . . . . . . . . . . . . . . . . . . . . . . . . . . . . . . . . . . . . . 2
1.2 Metrics for identification of top terms . . . . . . . . . . . . . . . . . . . . . . . . . . . . . . . 2
2 Additional Results 3
2.1 Top terms for merged essay topics . . . . . . . . . . . . . . . . . . . . . . . . . . . . . . . . . 3
2.2 Correlations of essay content with RHI and SAT . . . . . . . . . . . . . . . . . . . . . . . . . 3
2.3 SAT Distributions: Mean and Variance by RHI Decile . . . . . . . . . . . . . . . . . . . . . . 3
2.4 Creative Side & Significant Challenge . . . . . . . . . . . . . . . . . . . . . . . . . . . . . . . 3
2.5 Readability . . . . . . . . . . . . . . . . . . . . . . . . . . . . . . . . . . . . . . . . . . . . . . 3
3 Additional Materials 4
3.1 Essay Prompts . . . . . . . . . . . . . . . . . . . . . . . . . . . . . . . . . . . . . . . . . . . . 4
3.2 Code . . . . . . . . . . . . . . . . . . . . . . . . . . . . . . . . . . . . . . . . . . . . . . . . . . 4
11 Additional Methods
1.1 Choosing k topics
The ldatuning package uses four metrics to calculate an optimal number of topics [1, 2, 3, 4].1 Results from
ldatuning package (significant challenge and creative side) seen in Figures S1 and S2. The results for each of
the methods are all rescaled to have mean zero to help make them comparable. The optimal value generated
by this method is the number of topics where each of the four points are closest together, in this case 50.
1.2 Metrics for identification of top terms
The stm package provides the top terms for each generated topic based on calculations from various metrics;
we focus on FREX (frequent exclusive) and highest probability.
• FREX is the weighted harmonic mean of a given word in terms of its overall frequency in the corpus
and exclusivity to a given topic [5]. FREX was designed to balance the frequency of a given word with
its exclusivity to a topic relative to other topics. For word f in topic k, F REXf k is a word’s harmonic
mean of the word’s exclusivity to the topic φf.,k and topic specific frequency µf.,k :
−1
w 1−w
F REXf,k = + (1)
ECDFφ.,k (φf,k ) ECDFµ.,k (µf,k )
ECDFx.,k is the empirical CDF of the values of x over the first index and w is a weighting parameter
for exclusivity.
• Highest probability are the words with the highest topic-word distribution parameters.
1 See https://github.com/nikita-moor/ldatuning/blob/master/R/main.R
22 Additional Results
2.1 Top terms for merged essay topics
The top terms for each topic identified via CTM are listed in Table S1. The authors created the topic labels
based on themes suggested by the top terms.
2.2 Correlations of essay content with RHI and SAT
Figure S3 shows correlations between individual topics (right) and LIWC features (left) and RHI/SAT.
2.3 SAT Distributions: Mean and Variance by RHI Decile
Tables S2 shows mean & SD of total SAT score as a function of RHI. Note that variance is lower in the top
RHI deciles.
2.4 Creative Side & Significant Challenge
Tables S3 and S4 shows results in parallel to Tables 1 and 2 of main text but using essays within the two
prompts we focus on here.
2.5 Readability
Associations between Readability metrics and RHI/SAT are shown in Table S5. We derived the readability
metrics with the quanteda package in R using the textstat readability function [6].
33 Additional Materials
3.1 Essay Prompts
Essay prompts are as follows.2
1. Describe an example of your leadership experience in which you have positively influenced others,
helped resolve disputes, or contributed to group efforts over time
2. Every person has a creative side, and it can be expressed in many ways: problem solving, original and
innovative thinking, and artistically, to name a few. Describe how you express your creative side.
3. What would you say is your greatest talent or skill? How have you developed and demonstrated that
talent over time?
4. Describe how you have taken advantage of a significant educational opportunity or worked to overcome
an educational barrier you have faced.
5. Describe the most significant challenge you have faced and the steps you have taken to overcome this
challenge. How has this challenge affected your academic achievement?
6. Think about an academic subject that inspires you. Describe how you have furthered this interest
inside and/or outside of the classroom.
7. What have you done to make your school or your community a better place?
8. Beyond what has already been shared in your application, what do you believe makes you stand out
as a strong candidate for admissions to the University of California?
3.2 Code
The code used in this study can be found on the github page https://github.com/ajalvero/SAT_and_
Essays.
2 See https://admission.universityofcalifornia.edu/_assets/files/how-to-apply/uc-personal-questions-guide-freshman.
pdf
4References
[1] Juan Cao, Tian Xia, Jintao Li, Yongdong Zhang, and Sheng Tang. A density-based method for adaptive
lda model selection. Neurocomputing, 72(7-9):1775–1781, 2009.
[2] Thomas L Griffiths and Mark Steyvers. Finding scientific topics. Proceedings of the National academy
of Sciences, 101(suppl 1):5228–5235, 2004.
[3] Rajkumar Arun, Venkatasubramaniyan Suresh, CE Veni Madhavan, and MN Narasimha Murthy. On
finding the natural number of topics with latent dirichlet allocation: Some observations. In Pacific-Asia
conference on knowledge discovery and data mining, pages 391–402. Springer, 2010.
[4] Romain Deveaud, Eric SanJuan, and Patrice Bellot. Accurate and effective latent concept modeling for
ad hoc information retrieval. Document numérique, 17(1):61–84, 2014.
[5] Edoardo M Airoldi and Jonathan M Bischof. Improving and evaluating topic models and other models
of text. Journal of the American Statistical Association, 111(516):1381–1403, 2016.
[6] Kenneth Benoit, Kohei Watanabe, Haiyan Wang, Paul Nulty, Adam Obeng, Stefan Müller, and Akitaka
Matsuo. quanteda: An r package for the quantitative analysis of textual data. Journal of Open Source
Software, 3(30):774, 2018.
5Minimize (Signif. Challenge)
1.00
0.75
Scaled Values
Method
0.50
Cao et al., 2009
Arun et al., 2010
0.25
0.00
10 20 30 40 50 60 70 80 90 100 110 120 130 140 150
Topics
Maximize (Signif. Challenge)
1.00
0.75
Scaled Values
Method
0.50
Griffiths & Steyvers, 2004
Deveaud et al., 2014
0.25
0.00
10 20 30 40 50 60 70 80 90 100 110 120 130 140 150
Topics
Figure S1: Results from ldatuning package in R. Suggest 50 topics for modeling significant challenge essays.
6Minimize (Creative Side)
1.00
0.75
Scaled Values
Method
0.50
Cao et al., 2009
Arun et al., 2010
0.25
0.00
10 20 30 40 50 60 70 80 90 100 110 120 130 140 150
Topics
Maximize (Creative Side)
1.00
0.75
Scaled Values
Method
0.50
Griffiths & Steyvers, 2004
Deveaud et al., 2014
0.25
0.00
10 20 30 40 50 60 70 80 90 100 110 120 130 140 150
Topics
Figure S2: Results from ldatuning package in R. Suggest 50 topics for modeling creative essays.
7Topic (Merged Essays) Highest Probability FREX
Winning Competitions competit, award, compet, win, nation, won, place golf, compet, competit, won, award, decathlon, medal
Math math, mathemat, subject, calculus, number, algebra, alway math, algebra, bc, calculus, geometri, mathemat, trigonometri
AP Classes cours, ap, school, take, honor, high, academ cours, ap, placement, honor, enrol, rigor, advanc
Work And Goals work, set, hard, apart, goal, believ, achiev apart, set, california, candid, hard, achiev, goal
Camping Swimming run, camp, water, swim, race, cross, summer swim, camper, swimmer, lifeguard, pool, cabin, polo
Social Anxiety confid, speak, comfort, felt, feel, talk, fear shi, comfort, afraid, zone, confid, fear, nervous
Gendered Activities girl, boy, women, young, cheer, smile, name girl, cheerlead, femal, stunt, women, guard, cheer
Fashion Style color, black, cloth, wear, like, look, hair makeup, outfit, dress, hair, wear, fashion, skin
Family Members famili, parent, mother, father, brother, sister, home brother, sister, mother, sibl, father, cousin, oldest
Medical Experiences medic, hospit, doctor, bodi, patient, health, field surgeon, physician, medic, kaiser, diabet, anatomi, nurs
Helping Others peopl, help, can, make, way, differ, other peopl, can, other, someon, everyon, differ, way
Despite Words howev, one, may, rather, even, simpli, fact simpli, rather, may, fact, truli, consid, howev
Latinx Family Issues famili, educ, parent, school, immigr, mexico, live undocu, latina, latino, los, angel, chicano, deport
Education Opportunity colleg, educ, opportun, take, advantag, attend, school advantag, educ, colleg, opportun, credit, graduat, prep
Classroom Experiences class, teacher, test, student, studi, ask, question test, teacher, exam, class, score, materi, review
Youth Volunteering children, kid, volunt, help, teach, work, learn children, disabl, kid, autism, volunt, center, buddi
Reading Writing write, read, english, book, word, essay, stori write, writer, essay, poem, poetri, literatur, reader
Making Planning car, build, use, make, work, fix, drive car, chess, wheel, bike, driver, cardboard, tape
Visual Art creativ, art, express, draw, creat, artist, paint draw, artwork, artist, art, ceram, canva, doodl
Travel trip, travel, environment, environ, world, live, experi island, aquarium, environment, itali, japan, rica, fish
Leadership Skills skill, abl, develop, leadership, posit, allow, experi skill, leadership, communic, develop, demonstr, abil, posit
Seeking Answers question, book, like, research, read, answer, ask telescop, astronom, map, probe, column, constel, encyclopedia
Mental Health depress, mental, anxieti, bulli, drug, struggl, disord alcohol, suicid, abus, bulli, gay, drug, harass
Outside School Programs program, student, school, summer, mentor, academi, attend upward, academi, mentor, bound, program, mente, workshop
Volunteer Cleaning anim, clean, dog, trash, park, recycl, beach hors, cadet, pet, dog, jrotc, trash, veterinari
Work Experiences store, custom, week, tabl, card, phone, two bus, store, shop, cowork, card, custom, employe
Family Death mom, dad, pass, felt, pain, cri, away dad, mom, grandma, death, cri, die, grandpa
Motivations Goals success, motiv, becom, goal, achiev, determin, continu failur, persever, mindset, strive, capabl, motiv, success
Psychology Understanding understand, other, friend, psycholog, listen, situat, person psycholog, behavior, conflict, listen, mediat, empathi, disput
Group Leadership club, member, presid, meet, join, offic, event club, vice, secretari, presid, copresid, nhs, rotari
Sports Experiences team, teammat, captain, coach, season, practic, leader captain, volleybal, teammat, team, varsiti, season, coach
World Histories histori, world, learn, s, past, countri, event histori, european, islam, histor, syria, egypt, war
China chines, studi, student, also, time, china, school china, provinc, hong, kong, chines, shanghai, wechat
Language Experiences languag, english, spanish, learn, speak, cultur, understand spanish, fluent, bilingu, french, eld, korean, languag
Cooking food, cook, eat, make, meal, kitchen, bake bake, recip, ingredi, culinari, chef, chees, cupcak
Civic Experiences govern, polit, issu, elect, youth, confer, chang attorney, voter, legisl, mayor, poll, civic, ballot
Time Management time, work, help, get, school, abl, go homework, manag, get, stress, done, stay, procrastin
Sensory Experiences wall, hand, air, water, light, red, like yellow, drip, nose, glass, fold, sun, stain
Sociocultural Diversity cultur, differ, divers, world, peopl, american, societi divers, asian, ethnic, racial, cultur, african, heritag
Business Economics busi, econom, compani, market, product, manag, research market, entrepreneur, entrepreneurship, econom, entrepreneuri, deca, ceo
Performance Art perform, stage, act, show, audienc, play, charact karat, theatr, theater, drama, actor, martial, actress
Computer Science comput, scienc, program, code, technolog, game, learn java, html, code, javascript, comput, python, hackathon
Photography pictur, photographi, take, imag, photo, captur, camera photographi, photograph, photo, pictur, captur, yearbook, imag
School Activities student, school, event, high, leadership, campus, activ asb, link, freshmen, homecom, crew, ralli, campus
Humor Storytelling stori, charact, like, laugh, tell, joke, world humor, tale, pun, potter, harri, superhero, joke
Group Assignments group, project, work, idea, task, assign, member group, assign, task, project, charg, present, partner
Work Money job, money, pay, rais, work, parent, financi money, buy, expens, $, dollar, sell, pay
Process Words get, go, just, got, like, start, one got, talk, bad, told, pretti, said, get
Boy Scouts scout, ib, boy, project, troop, eagl, leader scout, ib, troop, eagl, patrol, baccalaur, cub
Video Film video, film, design, creat, media, edit, make filmmak, film, editor, edit, footag, video, youtub
Family Church church, youth, faith, god, cancer, grandmoth, grandfath bibl, ministri, god, church, retreat, prayer, worship
Building Engines engin, design, robot, build, project, work, use robot, cad, aircraft, aerospac, rocket, sensor, circuit
Human Nature world, human, natur, passion, beyond, complex, explor inher, manifest, notion, philosophi, nuanc, facet, myriad
Music music, play, band, song, sing, piano, instrument band, piano, guitar, drum, musician, violin, orchestra
Life Reflections life, want, alway, never, know, love, can everyth, anyth, never, happi, someth, els, ever
Time Cycles day, hour, everi, night, week, time, morn morn, night, sleep, wake, am, hour, pm
Life Challenges life, challeng, face, live, situat, move, academ life, adapt, situat, overcom, face, move, challeng
Sensory Responses eye, word, moment, hand, began, head, back stare, silenc, breath, mouth, utter, sigh, chest
HS Years year, school, class, high, junior, freshman, sophomor junior, sophomor, freshman, year, senior, high, class
Sports General play, game, sport, player, soccer, basketbal, footbal basebal, hockey, basketbal, soccer, tenni, softbal, refere
School Grades grade, began, first, th, end, semest, improv grade, semest, th, b, a, eighth, began
Dancing Art danc, perform, dancer, movement, ballet, express, year danc, dancer, ballet, choreograph, choreographi, polynesian, gymnast
Community Service communiti, help, servic, volunt, organ, event, local homeless, donat, communiti, servic, chariti, holiday, nonprofit
Preference Words also, like, thing, realli, subject, lot, alway realli, lot, thing, good, favorit, influenc, enjoy
Achievement Words result, provid, initi, began, becam, academ, effort dilig, remain, util, attain, endeavor, initi, simultan
Puzzles Problems problem, solv, think, use, solut, find, way solv, solut, problem, puzzl, logic, method, cube
Chemistry Biology scienc, biolog, chemistri, interest, research, subject, lab chemic, biotechnolog, molecular, dna, molecul, biochemistri, chemistri
Tutoring Groups help, tutor, colleg, avid, also, go, need avid, tutor, ffa, et, ag, via, tutori
Physics physic, world, understand, knowledg, can, concept, univers physic, newton, graviti, quantum, physicist, einstein, astronomi
New Exepriences new, learn, school, friend, even, first, found new, found, friend, move, though, much, even
Table S1: Topics generated from merged essays. Topic names were created by authors based on top terms
from highest probability and FREX metrics.
8Figure S3: Correlations, merged essays
9Decile Mean σ
10 (highest) 1340.48 130.45
9 1306.40 141.03
8 1286.41 145.38
7 1260.13 149.10
6 1242.99 154.66
5 1201.95 162.14
4 1157.33 160.46
3 1128.28 163.14
2 1116.19 159.74
1 (lowest) 1101.86 157.85
Table S2: SAT Mean and Standard Deviation by RHI Decile, Merged Essays
10Essay R2
A. SAT predicting RHI
SAT: Signif. Challenge 0.1171
SAT: Creative Side 0.1065
SAT EBRW: Signif. Challenge 0.0806
SAT EBRW: Creative Side 0.0739
SAT Math: Signif. Challenge 0.1175
SAT Math: Creative Side 0.1063
B. Topics predicting RHI
Signif. Challenge 0.1050
Creative Side 0.0560
C. LIWC predicting RHI
Signif. Challenge 0.0973
Creative Side 0.0645
Table S3: Out-of-sample prediction error for prediction of RHI by topics and SAT scores using 10-fold CV.
11You can also read