Carbon Farming with Timber Bamboo: A Superior Sequestration System Compared to Wood - Why the time is now for the world to take advantage of ...
←
→
Page content transcription
If your browser does not render page correctly, please read the page content below
Carbon Farming with Timber Bamboo: A Superior
Sequestration System Compared to Wood
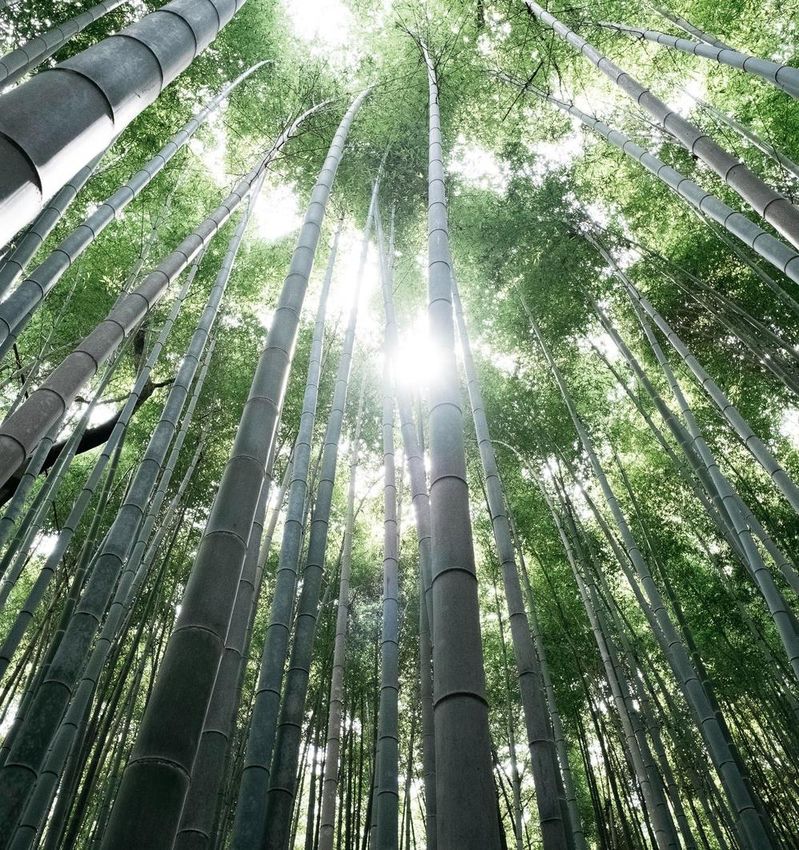
Why the time is now for the world to take advantage of nature’s
fastest growing structural fiber
Hal Hinkle, PhD
Myles McGinley
Travis Hargett
Skye Dascher
July 2019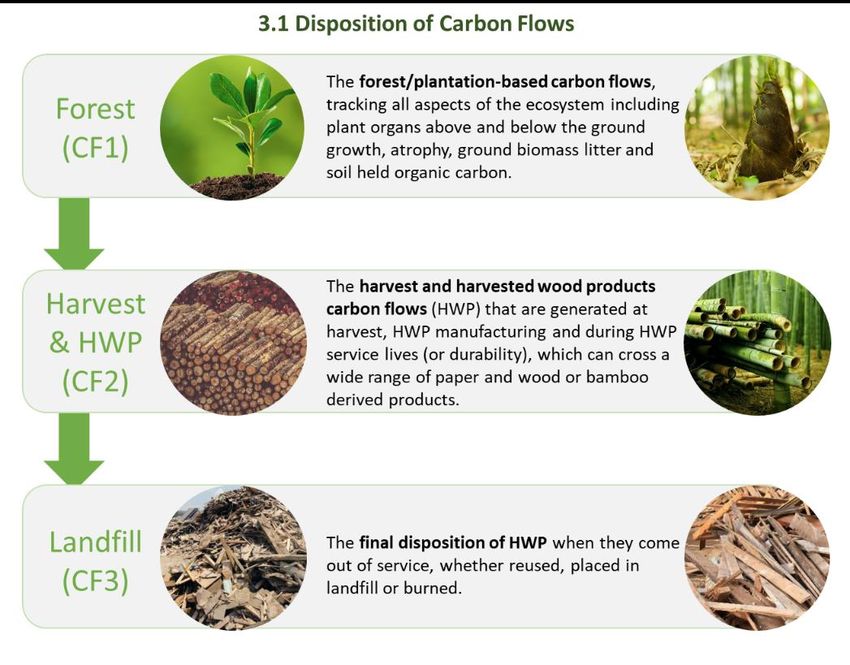
Executive Summary

Our earth is on track to crash through the 1.5°C global warming budget set for 2030
and will likely even exceed the 2°C worst-case budget. If this occurs, the International
Panel on Climate Change predicts dramatic negative consequences for human
health, livelihoods, food security, water supply, physical security, and global
economic growth (IPCC 2018). Every pathway the IPCC has proposed to fight climate
change requires immediate and significant carbon dioxide removal (CDR) from the
atmosphere, i.e. sequestration. Yet practically nothing is being pursued because
nothing reliably captures and stores atmospheric CO2 – other than possibly wood-
based biogenic sequestration implemented through afforestation and reforestation.
Forestation works in theory, but only when harvests are turned into long-lived wood
products that durably store the carbon. But wood sequestration is far too slow and
wood harvests, if clear cut, produce catastrophic CO2 emissions themselves.
We believe that timber bamboo’s fast growth and short annual harvest cycle can
speed up carbon sequestration and turn timber bamboo plantations into perpetual
carbon farms capable of producing high grade structural fiber. The demand for both
carbon dioxide removal and structural fiber is greater than ever! What’s more,
publicly available data suggests that the majority of bamboo’s carbon capture occurs
in the first 15 years, decades earlier than trees.
To test the idea that timber bamboo is a superior sequestration option compared to
wood, we built the first multi-species/multi-location bamboo growth model and
constructed a methodical decision-making framework to compare timber bamboo
and wood-based annual carbon flows. This analysis included robust sensitivity
analysis, time valuation of carbon flows using hyperbolic discount rates, and a
comprehensive comparative metric called the Carbon Benefit Multiple (CBM). The
final CBMs showed that timber bamboo, with regular harvests turned into durable
products, sequesters between 4.9 and 6 times the carbon that wood does.
To conclude, we calculated the cumulative climate change mitigation benefits from
various levels of market substitution of durable timber bamboo building products like
BamCore’s Prime Wall System. Because of the Prime Wall System’s superior thermal
performance, as well as land-use conversion dynamics, we found that even
marginally substituting the Prime Wall for conventional wood framing in G-7
economies can lower atmospheric CO2 by over 23 gigatonnes over the next 100
years.
The time is now for the world to take advantage of nature’s fastest growing
structural fiber.
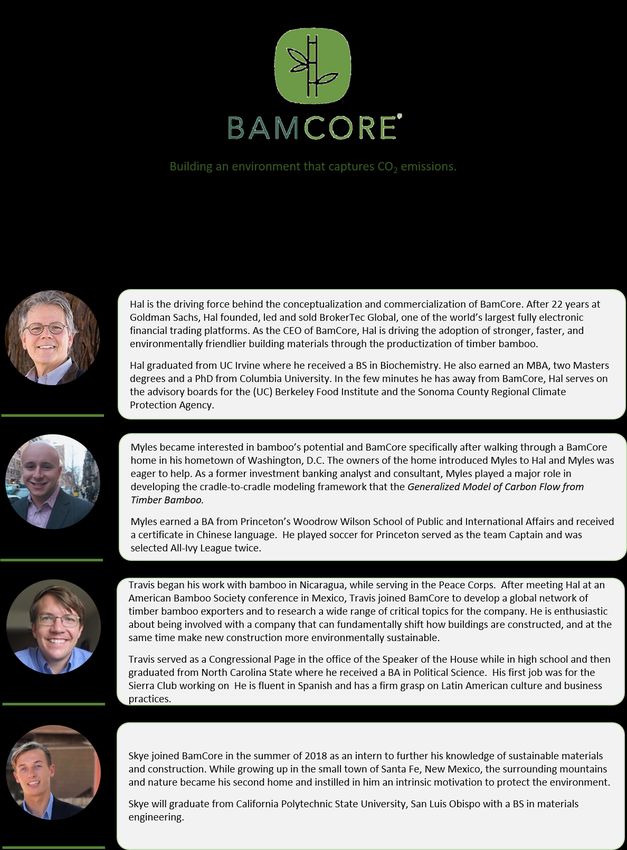
Table of Contents
   1. Addressing Climate Change Through Carbon Dioxide Removal ..........................................................................1

   2. Carbon Capture through Wood and Bamboo Afforestation ...............................................................................4

            Wood Afforestation. ......................................................................................................................................................... 4
            Bamboo Afforestation/Reforestation. ............................................................................................................................. 5
            Climate Change Mitigation (Sequestration) as an A/R Driver. ......................................................................................... 6
   3. Projecting Carbon Flows from Wood and Timber Bamboo A/R..........................................................................7

            Modeling Forest/Plantation-based Carbon Flows (CF1). ................................................................................................. 7
            Modeling Harvest Occurrence and HWP Production (CF2). ............................................................................................. 9
            Modeling HWP Final Disposition, Landfill and Methane (CF3). ...................................................................................... 11
            Carbon Flow Projections (Expected Case) for Each Species-Location. ........................................................................... 13
   4. Rational Decision Making Between Wood and Timber Bamboo AR – the Carbon Benefit Multiple ................15

            Alternative Cases ............................................................................................................................................................ 15
                  Expected, Low and High Case Projections. .............................................................................................................. 15
                  Time Valuing Carbon Flows...................................................................................................................................... 15
                  Weighted Scenario Analysis. .................................................................................................................................... 17
                  The Bottom Line: The Carbon Benefit Multiple. ...................................................................................................... 17
   5. Conclusion 1: Carbon Farming with Timber Bamboo Significantly Outperforms Wood...................................19

   6. Productizing Timber Bamboo into durable Carbon Storing Products ...............................................................20

            BamCore’s Prime Wall System. ...................................................................................................................................... 20
            Beyond Wood Framing-Concrete & Steel. ..................................................................................................................... 21
            Framing with Concrete. .................................................................................................................................................. 21
            Framing with Steel.......................................................................................................................................................... 22
   7. Conclusion 2: Timber Bamboo Products to Fight Global Climate Change ........................................................23

            What Does it All Mean? .................................................................................................................................................. 23
            What Does it All Add Up To? .......................................................................................................................................... 24
                  Market Sizing. .......................................................................................................................................................... 24
                  Substitution and Emissions Savings Analysis. .......................................................................................................... 24
                  Land use Conversion Sequestration Benefits. ......................................................................................................... 24
                  Estimation of Land Area Needed. ............................................................................................................................ 25
            Finale: What Will We Do? .............................................................................................................................................. 25
   8. About Bamcore ..................................................................................................................................................27

   9. References .........................................................................................................................................................28

   10. Appendix: International Forestation Commitments .........................................................................................29
1. Introduction: Addressing Climate Change Through Carbon Dioxide Removal
Mankind largely accepts the dangers of global climate change, but the stark reality is that collectively we show little likelihood of
staying within the 1.5oC or even the 2oC global warming budgets adopted in the Paris climate treaty in 2015 1 (IPCC, 2018). In
light of this, the private sector has made strides to mitigate its carbon footprint, through the combination of renewable energy
development and energy efficiency improvements. The sum of these actions, however, will not be enough to prevent mankind
from passing the presumptive safe harbor budget of the 1.5oC increase, or worse, the redline budget of 2oC global temperature
increase (Bloomberg & Pope, 2017) (New, et al., 2011) (Rogerlj, et al., 2016). More must be done to keep our planet from
breaking the temperature increase budget and to rebalance the world’s natural feedback cycles.

Specifically, we must sequester carbon dioxide (CO2) from the atmosphere. In their special study, Global Warming 1.5oC, The
United Nations Intergovernmental Panel on Climate Change (IPCC) makes this point clear: “All pathways that limit global
warming to 1.5oC…use carbon dioxide removal (CDR).” In conjunction with shifts away from fossil fuels, changes to dietary
norms, and a myriad of other items on the climate change mitigation menu, we must include significant, near-term carbon
sequestration efforts. Not including CDR in the solution set will lead the earth’s climate systems down a path of powerfully
harmful and irreversible feedback cycles2 that will make life on earth drastically different than it is today well before the end of
the current century.

Many in the academic, policy, and corporate communities grasp this eventuality, but in the effort to understand and limit
climate change, little focus has been given to what might be the most important factor of all: the timing of mitigation outcomes.
With the cyclical and irreversible nature of the earth’s weather and atmospheric feedback loops in mind, it seems obvious that
discrete periodic timing projections of CO2 emissions, and capture, are necessary to formulate an effective climate change
mitigation plan. Yet, in the abundant research and in the development of plans and policies to mitigate climate change, only the
projected cumulative amount of mitigation is typically considered, while the timing of the mitigation events is hardly ever
formally incorporated - conceptually or analytically. Even the Paris carbon budget itself is expressed simply as a total amount of
CO₂ (and other greenhouse gases) that can be released into the atmosphere without regard to when the gasses are in fact,
emitted. Fighting climate change is not a contest that we can win with a late-in-the-game reversal. If we don’t get ahead in the
contest early, the likelihood of prevailing reduces to nil. Better-suited firefighters showing up once the building is in full
conflagration can’t save the building. To make sound decisions, individually or collectively, that can lead to significant carbon
sequestration and climate change mitigation, we must develop better decision-making tools that incorporate the discrete
timing of carbon flows.

Among climate change CDR opportunities, capturing atmospheric carbon through afforestation and reforestation (“A/R”)3
sequestration is a proven, safe and immediately available option. Importantly, many argue that the sequestration benefit of A/R
is limited largely to the initial years of forest growth because once a forest reaches maturity its net carbon dioxide removal
slows, and may approach zero, as its continued growth is offset by natural forest atrophy resulting in a system with nearly
balanced carbon flux.4 If, however, some of the carbon-laden fiber is harvested from a mature forest’s standing stock and
stored, or sequestered, in harvested wood products (“HWP”)5, the forest can resume net capturing of carbon as it regrows.
Harvested wood products range from paper and pulp with short product half-lives to furniture with intermediate half-lives, and

1 On October 8, 2018 the UN’s Intergovernmental Panel on Climate Change (IPCC), after two years of work, released the Special Report: Climate Change of
1.5oC. The broad conclusion with high confidence was that “Global warming is likely to reach 1.5oC” as early 2030.
2 Positive feedback cycles in global climate change accelerate the rate of climate change when they are activated, e.g. rising temperatures that melt the

Greenland and polar ice covers, which reduces solar reflectance, resulting in further temperature gains, or the thawing of the sub-arctic permafrost that
releases CO2, which further warms the atmosphere, resulting more CO2 releases from the permafrost.
3 In our work and discussion, our working definition of Afforestation/Reforestation focuses on incremental planting activity intended to produce commercial

fiber via prescribed harvest cycles. The alternative of planting without intended harvest may produce ultimately higher sequestration results but only over
periods longer than helpful for climate change purposes. Said differently, had we time enough, slow-growing, unharvested forests might well absorb far more
atmospheric carbon than either harvested wood or bamboo A/R. Afforestation and reforestation, while factually different, have nearly identical carbon
footprints by the time a wood or bamboo system is mature. Accordingly, we use the terms interchangeably, noting them simply as “A/R”. Among climate policy
professionals, afforestation applies to land that has not had a forest on it in 50 years, while reforestation applies to land that has been converted to non-forest
uses prior to year-end 1989.
4 We appreciate the input of Doug Heiken who shared that long-lived/old growth stands, without intervening harvests, may indeed continue to net sequester

carbon. Unfortunately, climate change requires near term solutions.
5 Harvested Wood Products are explicitly included in the UN’s Framework Convention on Climate Change as a contribution to the mitigation results achieved

through A/R projects. HWPs include lumber, panels, paper and paperboard as well as wood used for fuel. For the purposes of this analysis, we do not make a
distinction between wood- or bamboo-based HWP.
                                                                                 1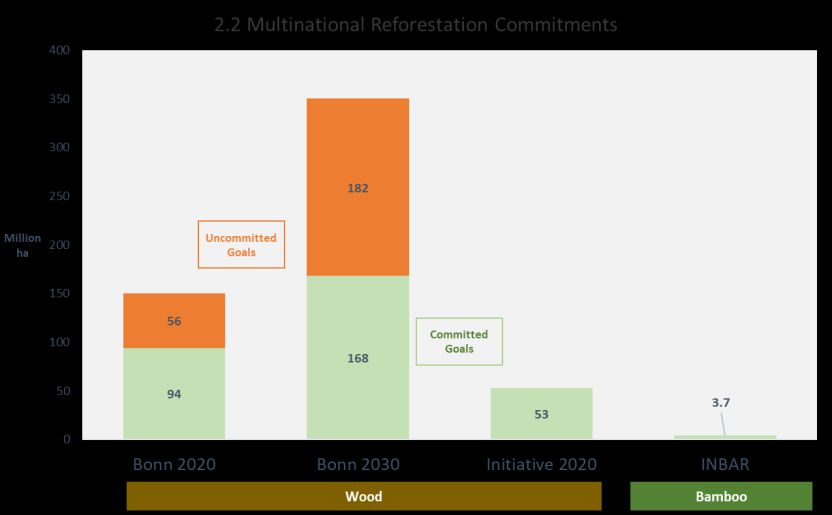
to construction materials embedded in buildings with very long half-lives.6 Only when a forest is periodically harvested, and the
harvested products are put in use, can a forest or plantation7 stay in a perpetual cycle of regrowth to continue capturing
additional atmospheric carbon. By storing carbon from each harvest into durable HWP, a one-time A/R project can become a
perpetual carbon farm. By extension, the faster or more frequently the A/R project is harvested, the more carbon can be
farmed from the atmosphere and the more carbon can be stored in durable HWP.

It is precisely the fast growth and short harvest cycle of timber bamboo that makes it the ideal candidate for carbon farming A/R
projects. To date, however, timber bamboo has been largely ignored in global climate change mitigation A/R programs and
policies in favor of wood-based A/R. This is hardly surprising. Tree forests and wood products are exhaustively researched and
analyzed both generally and in regard to their climate mitigation potential. Moreover, the comparatively limited scope of
bamboo research has kept its climate mitigation potential largely overshadowed. It would be difficult, if not in impossible, to
make effective A/R policy decisions without projections for the timing of each discrete annual carbon flow, sequestration and
emission, during both forest growth and HWP service life. These carbon flow projections are readily available for timber,
however, and the UN IPCC has even published guidelines for calculating and projecting these carbon flows in its Guidelines for
National Greenhouse Gas Inventories (IPCC, 2006).

Our analysis aims to bring the biogenic power of timber bamboo into the spotlight. To do this, we use publicly available data
sets of annual carbon sequestration rates across three species of timber bamboo that are used to produce HWP to create a
cradle-to-gate carbon flow model. The outputs of the model, as described below, are annualized net carbon flow projections
over a 100-year time period that can be directly compared to those of various wood forests.8 We analyze the potential role of
timber bamboo in climate mitigation A/R projects in comparison to wood-based A/R projects from the perspective of
commercial or rational decision making where the benefit maximized is near term capture and long-term storage of
atmospheric carbon dioxide.9 The following outlines the sections of the paper:

Section 2. Carbon Capture Through Wood and Bamboo Afforestation

       First, we review the state of existing multinational wood-based A/R adoption programs and report three observations:
       First, there is a significant shortfall between the broad goals of the overall programs and the specific commitments of the
       program’s participants. Second, the participants have only made faltering progress against these limited specific
       commitments. And third, there is a general indifference to timing considerations when implementing the schemes.
       Against this backdrop, we argue that timber bamboo is a strongly superior A/R solution. As nature’s fastest growing
       structural fiber, timber bamboo A/R programs, when compared to wood-based A/R options, are far more potent at
       generating near term carbon dioxide removal.

Section 3: Projecting Carbon Flows from Wood and Timber Bamboo Afforestation/Reforestation.

       Next, we introduce a modeling framework that allows us to project and then compare annual carbon flows from both
       wood and timber bamboo A/R projects.

            a.    For wood, we adopt the comprehensive carbon flow projection model developed by the US Forest
                  Service (“USFS model”; Smith, et al., 2005), which projects 100-year+ carbon flows for 51 forest types
                  within 10 planting regions.
            b.    For timber bamboo, we found no model available that projects comparable longitudinal carbon flows,
                  or longitudinal carbon flows at all. To remedy this, we developed a generalized model of timber
                  bamboo carbon flows that projects 100-year carbon flows across a range of timber bamboo species
                  (“BC model”).

6
  We do not discuss biochar as an HWP, even though its presumptive half-life is many hundreds of years because the global market demand for biochar is
relatively small, thus limiting its role as a substitute product.
7 Characteristic distinctions between forests and plantations are small for our purposes. Forests may be naturally or culturally established but will have a higher

degree of biodiversity. Plantations will be culturally established and managed with more focus on the immediately productive value. The manner of harvest
likely has the biggest impact on the biodiversity with clear-cutting significantly disrupting biodiversity and inter-cutting impacting biodiversity far less.
8
   Model documentation is readily available upon request.
9 The analysis is not conducted using the approach of any particular carbon sequestration certification or compliance program (e.g. Certified Development

Mechanisms (CDMs) or Verified Carbon Storage (VCS)). We appreciate the insights of Camille Rebelo of EcoPlanet Bamboo on the various certification
programs.
                                                                                 2
Using projections from these two models, we illustrate and then compare the annual carbon flows from wood and
     timber bamboo A/R projects, including all HWP carbon flows (production, storage, and disposition), without regard to
     time valuing the carbon flows. Because the BC model is necessarily more speculative than the USFS model, we construct
     four scenarios for the BC model outputs to allay the risk of a dominating assumption driving unsubstantiated results for
     timber bamboo A/R.

Section 4: Rational Decision Making Between Wood and Timber Bamboo A/R – The Carbon Benefit Multiple (CBM).

     Then, based on the above-mentioned carbon flow projection models, we establish a rational decision framework that
     evaluates the relative carbon sequestration potency of timber bamboo versus wood A/R. The framework includes
     elements commonly found in commercial or financial decision-making, including testing the sensitivity analysis of specific
     assumptions, time-valuing the carbon flows, and weighing the outlook across four possible scenarios. To reach a
     comprehensive but singular bottom line conclusion, we construct a single metric for the relative potency, the Carbon
     Benefit Multiple. To test the robustness of the binary decision between using timber bamboo or wood for A/R programs,
     we stress test the Carbon Benefit Multiple against three levels of concern about climate change (i.e. discount rates
     reflecting timing urgency) and across four scenarios of certainty about the individual model inputs. The results show that
     timber bamboo A/R, when harvested into durable HWP, provides 4.9x to 6x the amount of carbon dioxide removal that
     a similar wood A/R project does.

Section 5: Conclusion 1: Carbon Farming with Timber Bamboo Significantly Outperforms Wood.

     Based on our above work, we conclude that timber bamboo A/R is more potent than wood A/R providing both near-
     term carbon capture and more CDR per hectare of land used. We urge the adoption of timber bamboo as a new global
     source of structural fiber and the only realistic near-term CDR strategy we have on hand.

Section 6: Productizing Timber Bamboo Into Durable Carbon-Storing Products.

     Based on timber bamboo A/R’s highly positive Carbon Benefit Multiple compared to wood A/R, we discuss the role and
     importance of the early and regular extraction of HWP to store captured carbon in durable products. We explain how the
     productization of timber bamboo into durable building products will help supply mankind’s growing need for a non-
     tree-based fiber while also driving perpetual carbon farming through demand for more timber bamboo A/R
     investments. We demonstrate how superior bamboo-based building products, like BamCore’s Prime Wall System can
     economically drive the establishment of a generation of timber bamboo carbon farms that, in turn, can deliver bamboo’s
     carbon sequestration benefits without government subsidy or mandates.

Section 7: Conclusion 2: Timber Bamboo Products to Fight Global Climate Change.

     Finally, we quantify what a shift in demand from durable wood to durable timber bamboo products would mean for the
     world’s atmospheric CO2 stock over a 100-year period using various levels of market penetration in the G-7 countries’ new
     residential construction markets. In the analysis, we account for the cumulative impact on CO 2 emissions from both land-
     use conversion (wood to timber bamboo), and the thermally superior properties of BamCore’s Prime Wall System. We
     find that if BamCore’s Prime Wall System captured 20% of new housing starts in the G-7 region, 23.5 gigatonnes of
     atmospheric CO2 could be removed over the next 100 years. And to do so would only require the incremental planting
     of 852,000 hectares of bamboo; an area just over 2% of today’s standing bamboo stock and less than .02% of existing
     wood stock, indicating its reasonable feasibility.

                                                              3
2. Carbon Capture through Wood and Bamboo Afforestation
Wood Afforestation. In our prior publication, “BamCore and Global Warming”, we concluded that among the range of
options for carbon sequestration only afforestation 10, and its near-equivalent reforestation, is “ready, capable of scaling, low
cost [with] few collateral negatives” (Hinkle, et al., 2017). The multiple potential benefits of A/R were recognized in 2011 when
the original 2020 Bonn Challenge was adopted in Bonn, Germany (Bonn, 2018)11. The original Bonn Challenge was structured as
a multi-national commitment scheme that set targets for reforestation by 2020. In 2014, the New York Declaration on Forests
added a second tranche of targets for 2030. The adopted goals are:
• 150 million hectares of reforestation/restoration by 2020 and
• 350 million hectares of reforestation/restoration by 2030.
Global forest cover is approximately 4 billion hectares, of which bamboo forestation contributes about 33.5 million hectares,
less than one percent (FAO, 2010). Thus, success in these goals would add 4% and 9% respectively, to total forest cover. (See
Figure 2.1.)
2.1 Global Forest Cover and Bonn Challenge Goals
4,500
4,033
4,000
3,500
3,000
2,500
Million
ha 2,000
1,500
1,000
350
500 150
0
Total Global Forests Bonn 2020 Bonn 2030
To date, however, only 40 countries and seven other parties have made commitments under the Bonn Challenge. (See Appendix
One.) The present commitments total only 94 million hectares by 2020 (63% of the 2020 goal) and 168 million hectares by 2030
(46% of the 2030 goal). (See Figure 2.2) The total Bonn Challenge goals and even the partial commitments against those goals
seem like encouraging objectives until they are put in context of continuing annual deforestation. For example, in 2016, the
earth experienced record net deforestation of nearly 30 million hectares. Said differently, if the total 168 million nominal
commitment is achieved by 2030, but deforestation rates continue near that of 2016, at the end of 2030, the earth will still have
a net reduction of 221 million hectares of forest or about 10% of the earth’s remaining forests.
Under the Bonn Challenge, each participant is free to detail its reforestation and restoration projects as they fit its local climate,
growing conditions, and economic exigencies. Unfortunately, many participants have barely begun their implementation and
more still lack the funding to pursue their adopted goals. Interestingly, despite the reality that different tree species with
different growth rates can serve as the base population for reforestation, no participant reports plans that incorporate the
speed of reforestation. It is possible that the desire to preserve or restore perceived historical biodiversity is inhibiting tree
species selection other than as is found in the legacy population. Moreover, fast growing timber bamboo is not explicitly
included in the Bonn Challenge.
10 Afforestation, strictly speaking, is the net addition of forest cover compared to that which exists today. In its 2020 Bonn Challenge and Initiative 2020 forms, it
is operationalized as an increase in forest cover largely through reforestation and restoration of deforested and degrade ecosystems.
11 The Bonn Challenge derives from the Earth Summit in 1992 and was advanced by the German government and the International Union for Conservation of
Nature. The IUCN is comprised of 216 states and government agencies and over 1100 Non-Government Organizations.
4Another program, Initiative 20x20, adopted in Lima, Peru in 2014, sets 2020 reforestation and conservation goals for 17 Latin
American and Caribbean countries, and three regional authorities. (See Appendix One.) Unlike other regions, nearly half of
greenhouse gas emissions in Latin America and the Caribbean derive from deforestation, land-use change, and agriculture.
Thus, the parties in this region sought a reforestation/conservation approach that more aptly fits them but still counts towards
their targets in the Bonn Challenge totals.
Presently, about 50 million hectares are targeted
under Initiative 20x20 (WRI, 2018) (See Figure 2.2).
Yet little information is available on the specifics of
each participant’s plan and no participant
highlights the need for speedy forest growth or
carbon capture. Moreover, even though many of
the Latin American countries are native habitats for
multiple species of fast-growing timber bamboo,
timber bamboo is also not explicitly included in the
Initiative 20x20.
Bamboo Afforestation/Reforestation.
The only direct inclusion of timber bamboo in A/R
mitigation plans has been through members of
INBAR, the International Network for Bamboo and Rattan. INBAR, which counts 44-member nations including Canada, but not
the United States, is part NGO and part diplomatic and development campaign sponsored by the People’s Republic of China. Of
the 44 members, 18 have expressed plans for bamboo-based reforestation totaling 3.7 million hectares by 2020, which
represents an increase of about 10% of present standing bamboo forests (See Appendix One). Of these 3.7 million hectares
nearly 2.2 million are in Africa. A survey of INBAR members revealed that more than half of the INBAR respondents were
impeded in their efforts to pursue timber bamboo restoration due to insufficient financial resources (94%), lack of knowledge of
bamboo processing technologies (83%), and lack of technical knowledge of bamboo species, nursery establishment, and
plantation and management (72%) (INBAR, 2018). Obviously, to the extent that there is market rate commercial demand for the
harvested “wood” products from timber bamboo plantations the most significant of these impediments lessens or disappears.
In “BamCore and Global Warming,” we compared timber bamboo afforestation with tree afforestation. We noted that tree
afforestation was immediately available and possible across a wide range of habitats, but that its total carbon capture was
smaller per land-area used and was slower than timber bamboo sequestration. Our analysis showed that when regularly
harvesting stands of a Latin American timber bamboo species, Guadua angustifolia, for use in durable building products, timber
bamboo A/R substantially outpaced the sequestration achieved by three North American tree species also used for durable
building products (See Figure 2.3). Research by others has reached a similar conclusion, including that Asian timber bamboo
(Moso) is at least 2.5x more potent as a sequestration engine than several fast-growing Asian wood species (Nath, et al., 2015)
(INBAR, 2010).
2.3 Growth Comparison: Timber vs Bamboo
1,000
CO₂
750
Removed
(MT) 500
250
0
1-5 6-10 11-15 16-20 21-25 26-30
Five Year Growth Periods
Ponderosa Pine So. Yellow Pine Douglas Fir Guadua angustifolia
5If time is of the essence in fighting climate change and if timber bamboo is a more potent sequestration engine than trees, why
hasn’t there been a broader adoption of bamboo A/R? Besides some of the answers reported above, we also think that there is
a broad lack of awareness about the opportunity for mankind to harness nature’s strongest and fastest growing botanical fiber.
In part the lack of awareness could result from the fact that bamboo today occupies less than 1% of global forest cover (FAO
2010).12 Moreover, bamboo habitats are predominantly in the developing world, in the tropics and subtropics, while much of
the climate change research and policy directives emanate from developed nations in temperate climates, where wood
abounds. As a result, bamboo simply has less research, fewer publications and diminished resources focused on its
opportunistic contributions compared to wood.
Climate Change Mitigation (Sequestration) as an A/R Driver. The two international A/R initiatives discussed
above derive their impetus from the Rio de Janeiro Earth Summit of 1992 and are more directed at sustainable development,
biodiversity and ecosystem restoration, than they are at climate change or carbon sequestration (UN, 1992).
If the Bonn Challenge and Initiative 20x20 are effective as originally conceived, atmospheric carbon capture will most likely be a
collateral benefit. The International Union for Conservation of Nature, a sponsor of the Bonn Challenge, estimated that
achieving the 2020 goal would sequester 270 million tonnes of atmospheric carbon capture per year. This contrasts with the
100 to 1,000 billion tons that the IPCC recently projected will be needed from all sequestration options like A/R prior to 2100.
(IPCC, 2018) That is, even if all the Bonn Challenge 2020 commitments were kept as wood A/R projects they would provide only
a quarter of 1% of the absolute minimum that IPCC indicates is needed from global CO₂ sequestration.
Specifically, relative to combined sequestration results from agricultural, forestry and land-use (“AFOLU”) projects needing to
capture CO₂ equivalents, the IPCC suggested that we need (IPCCC 2018):
• Up to 5 billion tonnes (gigatonnes) per year by year 2030,
• From 1 to 11 billion tonnes (gigatonnes) per year by year 2050, and
• From 1 to 5 billion tonnes (gigatonnes) per year by 2100.
In context that means that the failed 2020 commitments don’t cover even one year of what the IPCC suggested is needed from
forestry and other AFOLU sequestration projects.
In the 26 years since the Earth Summit, the need to mitigate accelerating climate change has become paramount. Our view is
that implementing A/R schemes must now intentionally anticipate and incorporate the need for near term carbon capture. To
this end, consideration of timber bamboo, which has significant sequestration timing advantages, needs to be embraced,
studied and included. Regrettably, the greater good of the earth may not sensibly accommodate both a return to precise
historical biodiversity and the imminent need for carbon capture and storage in A/R projects.
In the next section we compute estimates of the absolute values of carbon flows from timber bamboo and wood A/R. To do
this, we employ a rigorous model for forestry sequestration developed by a team of researchers at the US Department of
Agriculture Forest Service. Parallel to this we, built the first generalized model for timber bamboo for comparison. Comparing
the results will reveal the substantially greater sequestration potential of timber bamboo compared to wood in absolute
cumulative terms, i.e. without any time discounting. In the final section we re-evaluate the absolute carbon flows by time
weighting them to highlight the criticality of early action in fighting climate change. Once time-weighted, we complete a set of
Scenario Analyses to test the robustness of the model’s assumptions and the impact of time-weighting the annual carbon flows.
12 The area reported in Global Forest Resources Assessment 2010 is only 31.5 million ha, to which we have added 2 million has for Indonesia which was
eliminated from the 2010 report but present in prior reports.
63. Projecting Carbon Flows from Wood and Timber Bamboo A/R
The urgency to choose the most potent and effective A/R alternative to achieve near term CDR is clear. The tools to compare
alternatives, however, have not been available. Commercial wood forestry is well studied and has a deep published literature
that has produced robust models with projections of longitudinal carbon flows from wood A/R projects, such as the USFS
model. The climate policy and climate science communities assume that wood A/R is a ready and capable CDR tool, but they
have not asked if it the most potent A/R option. Timber bamboo A/R has been overlooked by mainstream climate science and
there exists no known timber bamboo A/R model that can project longitudinal carbon flows across multiple species to compare
to wood A/R. To construct the comparison of timber bamboo and wood A/R alternatives, we begin with the USFS (Forest
Service) carbon flow model for wood A/R and then build a generalized carbon flow model for multiple species and locations of
timber bamboo A/R that can be directly compared to the wood results from the USFS model. This newly built A/R model for
timber bamboo is termed the
generalized model of timber bamboo
carbon flows or simply the “BC model.”
The USFS model “Methods for
Calculating Forest Ecosystem and
Harvested Carbon with Standard
Estimates for Forest Types of the United
States” is built from ten forestry-derived
carbon pools constructed under the IPCC
guidelines published in 2003 (Smith, et
al., 2005). The USFS model is intended to
provide open access for analysis of
“other harvest quantities, stand ages and
forest types,” which allows us to directly
compare wood-based carbon flows with
timber bamboo-based carbon flows
across multiple species and growing
locations. The calculation framework of
both the USFS and the BC models
incorporates all three sets of carbon
flows that are attributed to an A/R
project (See Figure 3.1).
Because bamboo is a grass, timber bamboo grows very differently than wood, generating very different forest-based carbon
flows (CF1). This growth and development-based difference then drives earlier but regular partial harvests and storage into
HWP (CF2). When assumed HWP is taken out of service, the disposition of carbon flows is the same, except for the earlier
timing of bamboo HWP (CF3). In presenting the results in this section, we use inputs to the models that we expect to be the
most likely. The presented results are therefore the Expected or Base Case results. In Section 4, we will also present Low and
High Cases to reflect an understanding of the sensitivity to various inputs. Finally, we construct a Scenario Analysis to reflect
weightings of the various cases.
Modeling Forest/Plantation-based Carbon Flows (CF1). For timber bamboo, as described in the BC model, we
used available annual growth data for three species (Guadua angustifolia, Dendrocalamus asper and Bambusa bambos) and
built a generalized model of timber bamboo A/R carbon flows. The model was then cross-fitted to an additional five locations
for the three species for a total of eight species-locations projections. By fitting the model of one species to multiple locations
for that species we are expanding the reliability and applicability of the generalized carbon flow projections. For wood, we
chose three species from the USFS model: Douglas fir, the largest growing commercial timber species in North America,
Loblolley, the fastest growing and most widely planted commercial species in North America, and Ponderosa Pine, a commonly
planted and widely used specie. We extracted wood-based carbon flows from the USFS model using these three species for
seven species-locations.
7Figure 3.2 shows the accumulated carbon during the growth periods for the three timber bamboo species averaged across the
eight locations and the three commercial wood species averaged across the seven locations. Notice how much faster the timber
bamboo plantation can accumulate sequestered carbon per hectare. By the ninth year, all three species of bamboo have
accumulated more than 100 tonnes of C/ha. In contrast, Loblolley, the fastest growing commercial species doesn’t accumulate
100 tonnes C/ha until year 18, which is twice as long as the slowest of the three timber bamboo species.
3.2 Avg. Cumulative Carbon Growth in Bamboo and Wood Species Pre-Harvest
250
2030: Bonn
Challenge – 2050: IPCC
200 350 mil ha Target – 1.5° C
C / HA
Bamboo
(MT) 150 Wood
100
50
1 3 5 7 9 11 13 15 17 19 21 23 25 27 29 31 33 35 37 39 41 43 45 47 49 51 53 55 57 59 61 63 65 67 69 71 73 75
YEARS
Loblolley Douglas Fir Ponderosa Pine B. Bambos Guadua D. Asper
The largest growing wood species, Douglas fir, doesn’t accumulate the 100 tonnes C/ha until year 27, which is three times
longer than the slowest of the three timber bamboo species. The third commercial wood species, Ponderosa Pine, hasn’t
reached the 100 tonnes C/ha mark by year 75 when the plantation is presumed to be harvested. Immediately, these forest or
plantation level comparisons point to timber bamboo as embodying a potent timing benefit compared to wood in A/R projects.
To model the carbon flows coming from the bamboo plantations, but without harvest events or HWP production, the BC model
incorporates a total of 42 variables.13 Our intent is to manage all the known growth and accumulation dynamics that have been
observed in both natural and commercial bamboo plantings while focusing on commercial plantings. Among the 42 growth and
accumulation inputs separately modeled are:
• Annual growth and accumulation of biomass (and thus carbon) above and below ground separately,
• Distribution of growth and accumulation of biomass by plant organ,
• Ground litter development lag and prevalence,
• Age of first harvestable biomass from planting and age of culm when first harvested,
• Gregarious or mast flowering by percentage, including pre-emptive harvestability and lag to replant, and
• Post maturity growth and accumulation rates and caps from maximum accumulation during “equilibrium”.
13
We appreciate the insights and input of Hormilson Cruz Rios of SurBambu regarding plantation practices in timber bamboo.
8Modeling Harvest Occurrence and HWP Production (CF2). Harvest cycles for wood are as projected in the
seven selected harvest locations and range from 25 to 75 years. In the USFS model, the seven locations have different HWP
product end-use allocations based on historical data available to the USFS. However, to achieve comparability with bamboo, we
constrain both wood and timber bamboo to only two HWP options--paper and oriented strand board OSB. These two HWP have
maximally different service half-lives, which allows us to vary the relative portion of paper and OSB to test impact of HWP half-
life on carbon flows and to isolate the projected CDR from location specific HWP histories for wood. Harvest cycles for bamboo
across the eight locations are always annual, starting between six and nine years after initial planting and growing to a steady
state upon the stand reaching final maturity, each of which is species dependent.
As explained above, both timber bamboo and wood stands (forests or plantations) exhibit declining annual net biomass
accumulation once they enter their mature phase. Only if fiber is harvested and stored in durable Harvested Wood Products,
can a forest or commercial plantation continue to capture significant amounts of carbon in the regenerated biomass. There are
three significant differences between timber bamboo and wood relative to the harvest occurrence and any resulting HWP
production.
(1) Commercial softwoods are harvested in much longer cycles ranging from seldom less than 25 years to often
more than 75 years. In contrast, once a bamboo stand reaches initial maturity between seven and 10 years,
mature culms that are two years or older can be harvested from paper and pulp, while culms three years or
older can be harvested for more durable HWP production, such as building materials.
(2) Commercial softwoods are most frequently harvested by clear-cutting or very significant partial cutting.
Admitted clear-cutting accounts for 40% of all US forestry harvests and 90% of all Canadian forestry harvests.
In North America, approximately 2.6 million hectares are clear cut annually. (Masek, et al., 2011) Partial and
selective cutting may still be followed by a clear-cutting. In contrast, timber bamboo is never clear-cut. Once a
bamboo stand is mature, it is usually intercut annually or biennially when structurally mature culms are
harvested individually from each plant, or “clump”. This allows the rhizome to continue pushing up new
shoots to replace the harvested culm. For trees, successful competition for sunlight is a main determinant of
growth since clear cutting allows all trees in a given area to be replanted without any competing canopy. In
contrast, bamboo, like all grasses, regenerates a new plant from the same underground rhizome that has
already accumulated the required nutrients to push the next new shoot up to a full height culm in the next
growing season.14
(3) The efficiency that harvested softwoods are turned into HWP is low compared to timber bamboo. This is an
important difference between wood and timber bamboo that is difficult to overstate. The lower the
conversion efficiency the more carbon is emitted at time of harvest.
For wood, the USFS model directly incorporates these three elements for each of the species and forest types covered. For
timber bamboo, the BC model incorporates these elements. The USFS model includes two stages of conversion efficiency. The
first stage occurs in the field at the time of harvest. That is, what portion of the felled tree is converted to roundwood that is
taken to the mill versus what portions are left on the ground to decay or otherwise emit carbon. The second stage is the waste
that is produced during the production of the HWP. By restricting our HWP options to parallel relative amounts of paper and
OSB, we avoid confounding factors from specific HWP production allowing us to focus on the core wood versus timber bamboo
comparison.
Two perceptions about wood harvests should be mentioned. First, the general perception is that wood efficiently captures and
stores CO₂ when harvested and converted to HWP. While wood A/R is proposed and pursued as an earth-wide CDR mechanism,
its harvest and HWP conversion efficiency are disappointingly far from the general perception. It is also far from the projections
of timber bamboo. Figure 3.3 shows the average gross and net capture and emission for harvesting wood and timber bamboo
plantations over 100 years. These projections were made using data from the USFS model and the base case of the BC model.
Moreover, in-field assessments demonstrate that disruptions from “harvest of mature … forest[s]…generally result in a net loss
of carbon storage that would not be offset by storage in harvested wood or regained by forest growth for more than a century.”
(Allred, 2008)
14
We appreciate the input of Roger Lewis of Resource Fiber LLC on the rhizomal growth of selected bamboo species.
9Second, there has been a specific perception among climate scientists that when wood is harvested and burned for bioenergy it
can be considered carbon neutral because the stand of wood producing the fuel will in turn regrow and absorb the carbon
emitted. This is reflected in the Global Warming Potential bio metric (“GWPbio“), which presumes that the GWP from biogenic
sources is zero, or carbon neutral.15 However, recent research questions the claim of carbon neutrality of biogenic sources
because of the long rotation or harvest cycles for most wood. (Holtsmark, 2015). Only when the source is a very short harvest
cycle like a perennial grass can the emissions from biogenic fuel be considered carbon neutral (Liu, 2017). Timber bamboo is a
perennial grass with an annual harvest cycle after an initial growth period of 5 to 10 years. Compared to the fastest growing
woods that have a clear-cut harvest cycle of around 15-18 years, and the average timber species that have harvest cycles
exceeding 50 years, timber bamboo growth pattern is highly advantageous.
To model the carbon flows coming from wood harvest and HWP production, we use the USFS model as configured for each of
the seven species-locations but constrain HWP to paper and OSB. To model the carbon flows coming from timber bamboo
harvest and HWP production and emission waste, the BC model specifies:
• The vintage of the culms being harvested annually,
• The portions of the culm and above ground biomass that will be productized versus emitted as waste,
• A transit burden to transport timber bamboo raw material from harvest locations in the tropics, and
• The proportion of mast flowering as appropriate by species, and when occurring the portion of culms
harvestable followed by a configurable planting lag.
15
We appreciate the input of Simon Gmuender of Quantis International on GWPbio.
10
Carbon
CaptureModeling HWP Final Disposition, Landfill and Methane (CF3). Because we constrain HWP to only paper and
OSB in the same proportions for both timber bamboo and wood, the modeling of HWP carbon flows is identical for wood and
timber bamboo. The BC model and the USFS model both use the USFS half-life functions for HWP service life and the end of life
allocations between emissions and landfill deposition. For the portion in landfills, however, we update the emission projections
based on research that became available following the publication of the USFS model. The USFS model, as published, used
simplistic assumptions for: (1) the portion of HWP that was degradable in landfills, (2) when the degradation initiates and (3)
how long the degradation occurs before reaching the non-degradable residual state. More current research allowed us to make
projections that treated each of these three inputs independently for paper versus OSB. (Ximenes, et al., 2015)
In addition, the USFS model assumed all landfill emissions were CO₂, resulting from commonly observed aerobic digestion in
landfills. However, methane, a far more powerful greenhouse gas than CO₂, is known to be emitted from landfills as a result of
anaerobic fermentation. The presumed potency of methane is a function of the framework analyzed and is not currently
resolved in IPCC Inventory Guidelines or in the climate science literature. Methane potency is most frequently stated in terms of
CO₂ equivalents. The CO₂ equivalent of methane ranges from one molecule of methane equaling one molecule of CO₂ to 72
molecules of CO₂. Given this large range and the fact that timber bamboo is producing HWP that ends up in landfill far sooner
than wood HWP does, we felt it critical to test the impact of possible methane emissions resulting from HWP landfill
accumulations. The result of sensitivity analysis on methane to CO₂ equivalents was revealing but generally did not diminish the
conclusion below about the overall performance of timber bamboo compared to wood A/R projects. In fact, as we increased the
CO₂ equivalent, the bamboo-based A/R produced better results than did the wood-based A/R. At 1:1, 21:1 and 47:1 CO₂
equivalents, the Carbon Benefit Multiple for timber bamboo relative to wood was 4.9x, 5.2x and 5.8x, respectively. At the high
end of the CO₂ equivalents, 72x, the CBM for bamboo A/R rose to 10x that of wood A/R.
Figure 3.4 shows the disposition of carbon across the entire cradle-to-grave of timber bamboo and wood projects for our Base
Case Scenario. Carbon flows through the product ecosystem as an in-use product before being discarded to either a landfill or
burned and immediately emitted as CO₂.
3.4 Summary Carbon Disposition of OSB and Paper Products
100%
80% Carbon Emissions as CO₂ Equivalents (CO₂ and CH₄)
Disposition
60%
40% Carbon in Products in Landfill
20%
Carbon in Products in Use
0%
1 12 23 34 45 56 67 78 89 100
Years
Once carbon in a discarded product enters a landfill, it will begin the aerobic degradation process, emitting carbon dioxide
based on a specified decay function or it will remain intact if the HWP is non-degradable. Because the same proportions of
paper and OSB are used for both timber bamboo and wood, once the HWP is in landfill the half-life functions are identical for
residual and emission proportions for both timber bamboo and wood. Figure 3.5A and 3.5B describe the disposition of carbon
in, and emitted from, a landfill for both OSB and Paper product, respectively. Notice only a small fraction of OSB degrades. In
reality very little (3%) of wood products and only (26%) of paper products degrade in landfills (Micales & Skog, 1996).
113.5A Carbon Disposition of OSB Products in Landfill
100% CH₄ Landfill Emissions (1:1 carbon equivalent)
CO₂ Landfill Emissions
80%
Disposition
60%
40%
20%
Carbon in Products in Landfill
0%
1 12 23 34 45 56 67 78 89 100
Years
3.5B Carbon Disposition of Paper Products in Landfill
100%
CH₄ Landfill Emissions (1:1 CO₂ equivalent)
80% CO₂ Landfill Emissions
Disposition
60%
40%
20% Carbon in Products in Landfill
0%
1 12 23 34 45 56 67 78 89 100
Years
To model the carbon flows during HWP service life and landfill degradation, we use the USFS model as configured for each of
the seven species-locations but constrain HWP to paper and OSB as discussed above. To model the carbon flows coming from
timber bamboo harvest and HWP production and emission waste, the BC model specifies:
• The portions of paper and OSB that are discarded to landfills versus emitted following use by being burned,
• The portions of paper and OSB that are degradable versus the final inert landfill residuals,
• The separate half-life assumptions for the degradable portions of paper and OSB,
• The separate lag periods before degradation begins,
• The portions of the degradable portions that will be emitted as CO₂ versus methane, and
• The CO₂ equivalent level for the methane emitted portion.
12Carbon Flow Projections (Expected Case) for Each Species-Location. The final output of the USFS and BC
models is annual net carbon flows. Recognizing that numerous inputs are required for both models, we present only the
Expected or Base Case projection in this section, and subsequently present additional Low and High Cases in Section 4. The net
carbon flows can be presented visually in three ways: the net annual flows, the accumulation of the annual flows or as a present
value summary (see Carbon Benefit Multiple, Section 4). In Figures 3.6 A & B we present the net annual carbon flows separately
for timber bamboo and wood.
For the timber bamboo annual carbon flow projections shown in Figure 3.6A, the protruding positive projections show the
carbon capture during early period initial growth out to about year 16. Since these three species are not known to mast flower,
there are no observable negative flows in the projections (though mast flowering is captured in the Low Case, see below). 16
3.6A Annual Bamboo Carbon Flows
55
0
1 12 23 34 45 56 67 78 89 100
C/HA-55
(MT)
-110
-165
YEARS
D. Asper Philippines D. Asper Taiwan D. Asper Philippines Guadua Mexico
Guadua Bolivia Guadua Colombia B. Bambos India B. Bambos India
For the wood annual carbon flow projections shown in Figure 3.6B, there are no early positive protruding projections because
of the slower growth of the wood. The large negative (downward) protruding projections for wood depict the significant net
carbon emissions that occur at the time of harvest for wood.
3.6B Annual Wood Carbon Flows
55
0
1 12 23 34 45 56 67 78 89 100
C/HA -55
(MT)
-110
-165
YEARS
Loblolly SE Loblolly SC Ponderosa Pine PWE Ponderosa Pine RMS
Douglas Fir PWE Douglas Fir PWW Douglas Fir RMN
16Mast flowering or gregarious flowering, which has been observed in some bamboo species and not others, is the infrequent simultaneous flowering of a
species across a large geographic area, following which the flowering members of the species die. Species known to mass flower do in long cycles ranging from
30 to over 100 years. (See Hinkle 2018 for more discussion.)
13In Figures 3.7 A&B we present the accumulation of the above net annual flows. The eight independent curves in Figure 3.7A and
the seven independent curves in Figure 3.7B depict the accumulation of net annual carbon flows for each of the species-
location pairings for timber bamboo and wood, respectively. For timber bamboo shown in Figure 3.7A, the accumulation begins
early and is continuous due to the presence of regular HWP and the absence of any mast flowering in the Expected Case
(scientists still debate if, when, and how these three species mast flower, so we leave it out here). Notice that six of the eight
species-locations exceed a 200 Mt/ha benchmark by year 12.
3.7A Cumulative Bamboo Carbon Flows
1,000
800
600
C/HA
(MT)
400
200
200Mt
Mt
200
Benchmark
Benchmark
0
1 12 23 34 45 56 67 78 89 100
YEARS
D. Asper Philippines D. Asper Taiwan D. Asper Philippines Guadua Mexico
Guadua Bolivia Guadua Colombia B. Bambos India B. Bambos India
For wood, shown in Figure 3.7B, the accumulation of captured carbon takes far longer and remains a lower level than for timber
bamboo. The precipitous declines in cumulative carbon capture are the result of emissions that occur at harvest that
substantially offset the otherwise cumulative carbon capture. Notice that none of the seven species-locations for wood reach
the 200Mt/ha benchmark until year 45 (or approximately 2065, when CDR is of far less value) and then only the same species-
location exceeds 200 Mt/ha again another 45 years later.
3.7B Cumulative Wood Carbon Flows
1,000
800
600
C/HA
(MT)
400
200 Mt
200
Benchmark
0
1 12 23 34 45 56 67 78 89 100
YEARS
Loblolly SE Loblolly SC Ponderosa Pine PWE Ponderosa Pine RMS
Douglas Fir PWE Douglas Fir PWW Douglas Fir RMN
The average total of accumulation of carbon across the eight timber bamboo projections is 555 mt/ha, while for wood that
average totals 112 mt/ha. Thus, a hectare of timber bamboo can accumulate 443 mt/ha carbon more than wood, nearly five
times as much. Expressed in CO₂, timber bamboo accumulates 1,625 mt/ha more than wood does.
144. Rational Decision Making Between Wood and Timber Bamboo AR – the
Carbon Benefit Multiple
Assuming the carbon flow models presented above produce realistic projections to compare multiple species of timber bamboo
and wood A/R alternatives, we need to construct a framework to complete a rational decision between the alternatives that
incorporates the following:
1. Expected, Low and High Case projection that stress test the specific assumptions or inputs,
2. Time-valuing carbon flows to weigh earlier carbon capture more significantly, accordingly to a decision-maker’s level of
concern about climate change,
3. Weighted scenario analysis that includes all three Expected, Low and High Cases, but in various weightings to reflect a
robust range of possible future outcomes than just the Expected Case, and
4. The Carbon Benefit Multiple, a single point, bottom-line metric that scales the relative benefit of timber bamboo A/R.
In the body of this section, we introduce each of these elements in the decision framework. Together, they allow us to reach a
robust and rational conclusion between the ability of timber bamboo and wood A/R to deliver near term capture and long-term
storage of atmospheric carbon dioxide.
Expected, Low and High Case Projections. For our timber bamboo carbon flow projections (BC model) we have set the
various inputs to levels that best fit our current understanding and expectations. We call this the Expected Case or Base Case.
However, because the BC model is novel and thus inherently speculative, we also constructed two outlying cases where inputs
are adjusted to increase and decrease the CDR compared to the Expected Case projection. We call these the Low and High Case
projections. Figure 4.1 details principal inputs for the Base Case and changes from the Base Case for the Low and High Cases.
4.1 Principal Inputs for Low, Expected (Base) and High Case Bamboo Carbon Flow Projections
Principal Inputs Low Base High
Mast flowering Emit 100% of standing Carbon No mast flowering No mast flowering
Stock at specified intervals
after planting. Guadua at 60
years, D. asper and B. Bambos
at 40 and 82 years,
respectively.
% of mature carbon harvested 30% (↓50%) 60% 85% (↑41%)
% of harvested carbon productized or 70%, 30% (↓13%) 80%, 20% 90%, 10% (↑13%)
emitted in field
% of carbon in harvested culms 50%, 0%, 25%, 25% (↓41%) 70%, 15%, 10%, 5% 80%, 15%, 5%, 0% (↑12%)
turned into durable structural panels,
particle board, paper, or emitted
during production
% of non-culm aboveground carbon 0%, 50%, 50% (↓38%) 0%, 80%, 20% 0%, 90%, 10% (↑13%)
turned into OSB, paper, or emitted
during production
Equilibrium growth rate scalar (% of 30% (↓53%) 64% 64% (↑0%)
the growth rate in the final year of
the initial growth period)
Time Valuing Carbon Flows. A great many of life’s decisions reflect the higher value of near-term benefits and the lower
value of more distant benefits. Generally, this disproportionate temporal valuation reflects having higher usefulness or
confidence in near term benefits and lower usefulness or confidence in more distant benefits. Surprisingly, decision making
15You can also read